F fibonacci
- Göstergeler
-
Alexandre Favero
 My Journey in the Financial Market
I began my journey in the financial market in 2006, at a time when access to complete and well-structured educational materials on the subject was scarce. Faced with this gap, my learning came largely through self-directed study and hands-on experience. - Sürüm: 19.0
- Etkinleştirmeler: 5
Volume • Fibonacci • Pullback • Technical Analysis
This indicator was developed with an approach focused on identifying areas of interest in the market, combining different concepts widely used in technical analysis and trading studies.
Its purpose is to assist traders in interpreting price behavior through the confluence of information, allowing each user to integrate the indicator into their own analysis system and personal strategies.
KEY CONCEPTS ANALYZED
The system brings together different technical elements, including:
-
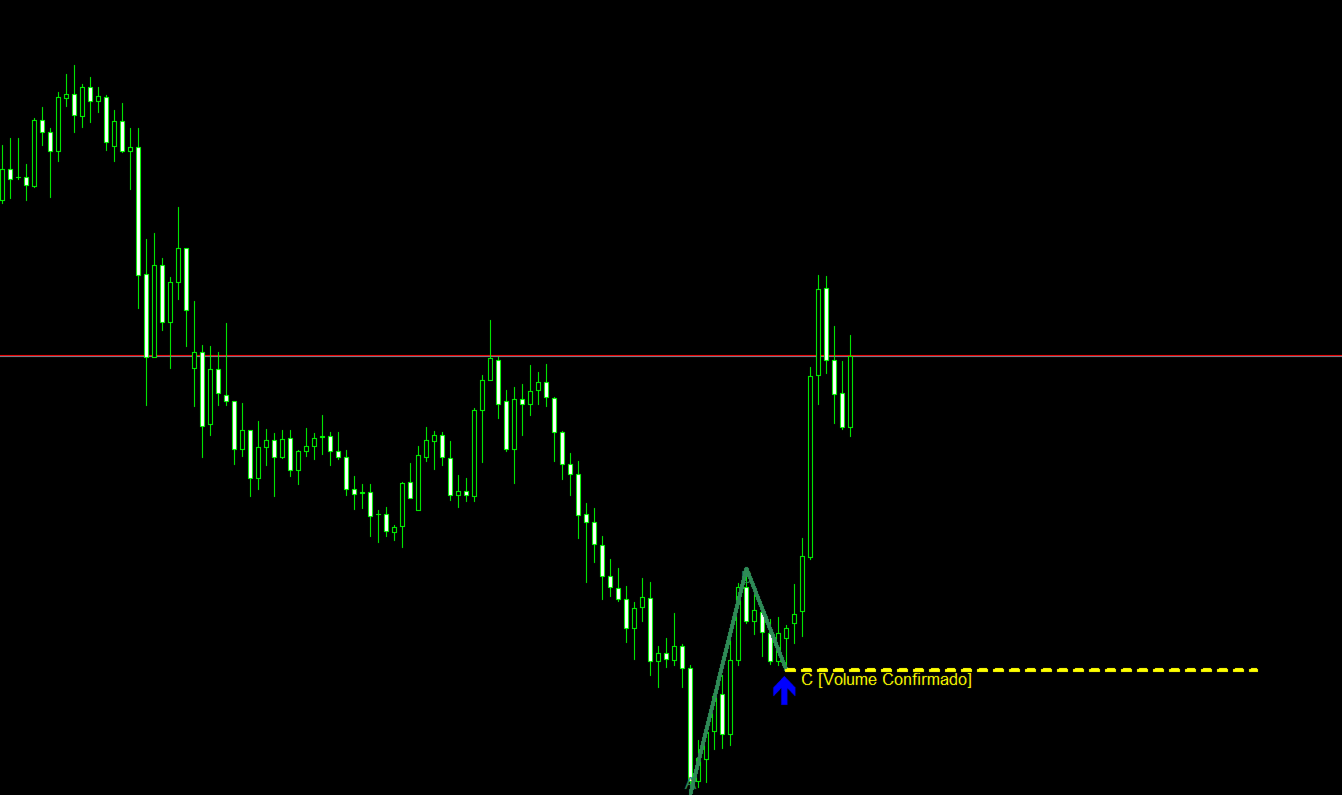
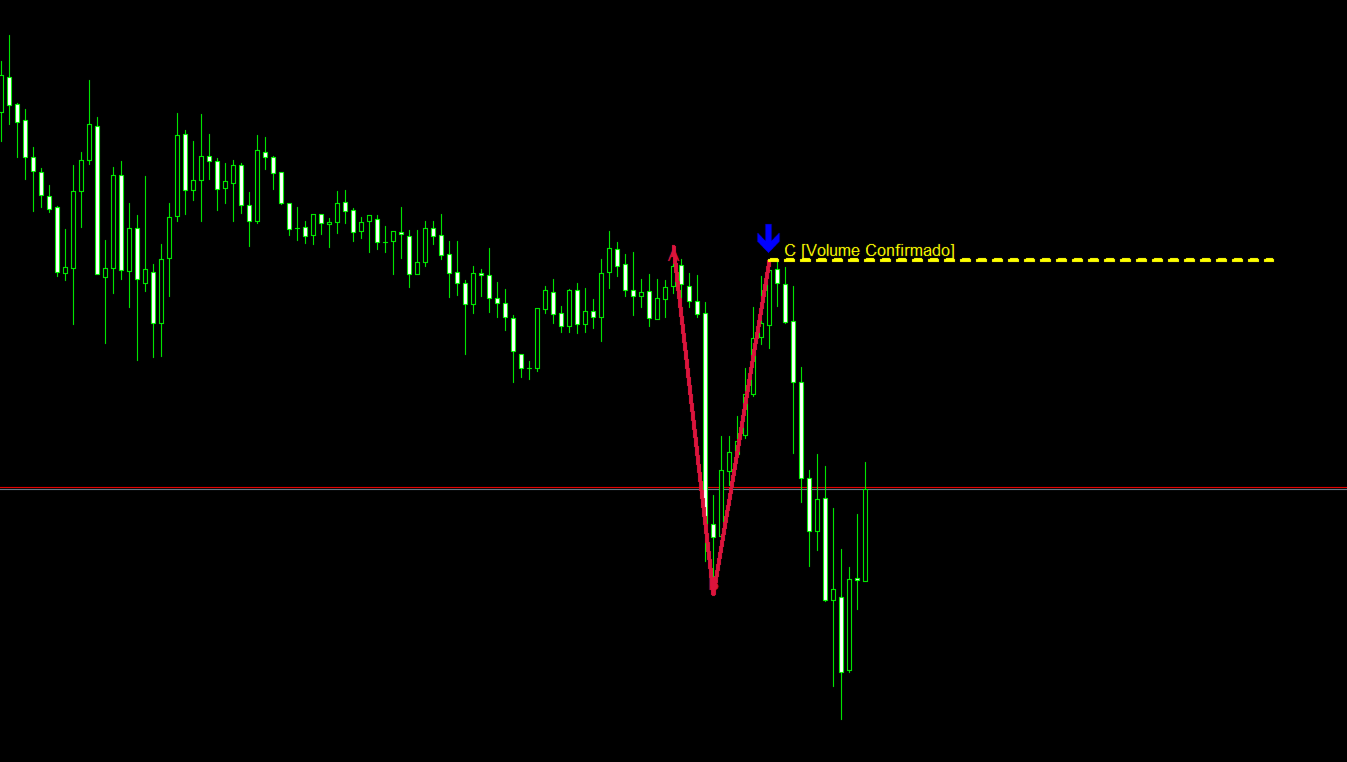
Volume Analysis — seeks to identify relevant changes in market activity and potential areas of interest.
-
Fibonacci Levels — uses retracements and extensions as references for evaluating potential price reaction areas.
-
Pullbacks — identifies corrective movements within market structure, seeking areas where price may continue its movement or react.
-
Price Structure — analyzes price behavior to assist in identifying relevant market areas.
-
Signal Confluence — combines different technical factors to improve the quality of the analysis.
-
Probabilistic Approach — interprets signals as possibilities rather than certainties.
A TOOL FOR YOUR OWN SYSTEM
The purpose of the indicator is not to replace the trader's strategy.
It was designed to function as an additional layer of analysis, allowing users to combine their own criteria with the information provided by the indicator.
In this way, traders can apply their knowledge, personal rules, and filters together with the signals identified by the system.
CONFLUENCE AS THE BASIS FOR DECISION-MAKING
Instead of considering a single indicator or signal in isolation, the methodology seeks to identify situations where different technical factors point toward the same area on the chart.
For example:
Relevant volume + Fibonacci retracement + pullback area + favorable market structure = greater technical confluence.
This combination does not mean that the future price movement is guaranteed. Rather, it represents a market condition that traders may consider as part of their decision-making process.
PROBABILITY-BASED APPROACH
Financial markets are inherently uncertain. For this reason, the indicator should not be interpreted as a tool capable of predicting the next price movement with certainty.
Its purpose is to work with a logic based on probability, context, and confluence.
The trader remains responsible for defining:
-
entry point;
-
risk management;
-
stop loss;
-
profit target;
-
position size;
-
additional filters;
-
trade exit criteria.
YOUR SYSTEM + OUR CONFLUENCE
One of the main advantages of the tool is that it allows traders to use the indicator together with their own methodology.
The system can be used as a:
Trade Filter → Setup Confirmation → Area Identification → Pullback Analysis → Volume Analysis → Fibonacci Confirmation → Decision-Making Support.
The concept is simple:
The indicator does not make the decision for the trader. It provides information to help the trader make more structured decisions.
A NEW WAY TO READ THE CHART
By combining volume, Fibonacci, pullbacks, and other technical analysis concepts into a single framework, the indicator seeks to transform different chart-based information into a visual context of confluence.
The greater the number of independent factors converging in a particular area, the greater the potential interest for the trader to study that area.
This approach encourages a more disciplined methodology based on rules, context, probability, and risk management, rather than decisions based solely on emotions or a single signal.
IMPORTANT
No indicator can guarantee results or predict future market movements with certainty.
This indicator should be used as an analytical support tool, integrated into each trader's own system and accompanied by appropriate risk management.
The final decision always belongs to the user.