Volume Tracker

This indicator draws a PVA (Price-Volume Analysis) volumes histogram or a standard volumes histogram in the first chart subwindow.  An alert option signals when a "Climax" situation exists.  Specific details follow.

The PVA Volumes Histogram 


 This indicator creates PVA Volumes to be used together with the PVA Candles indicator. Special colors are used for candles and corresponding volume bars when notable situations occur involving price and volume, hence PVA (Price-Volume Analysis).  The criteria for the  special colors used are as follows.

Situation "Climax"


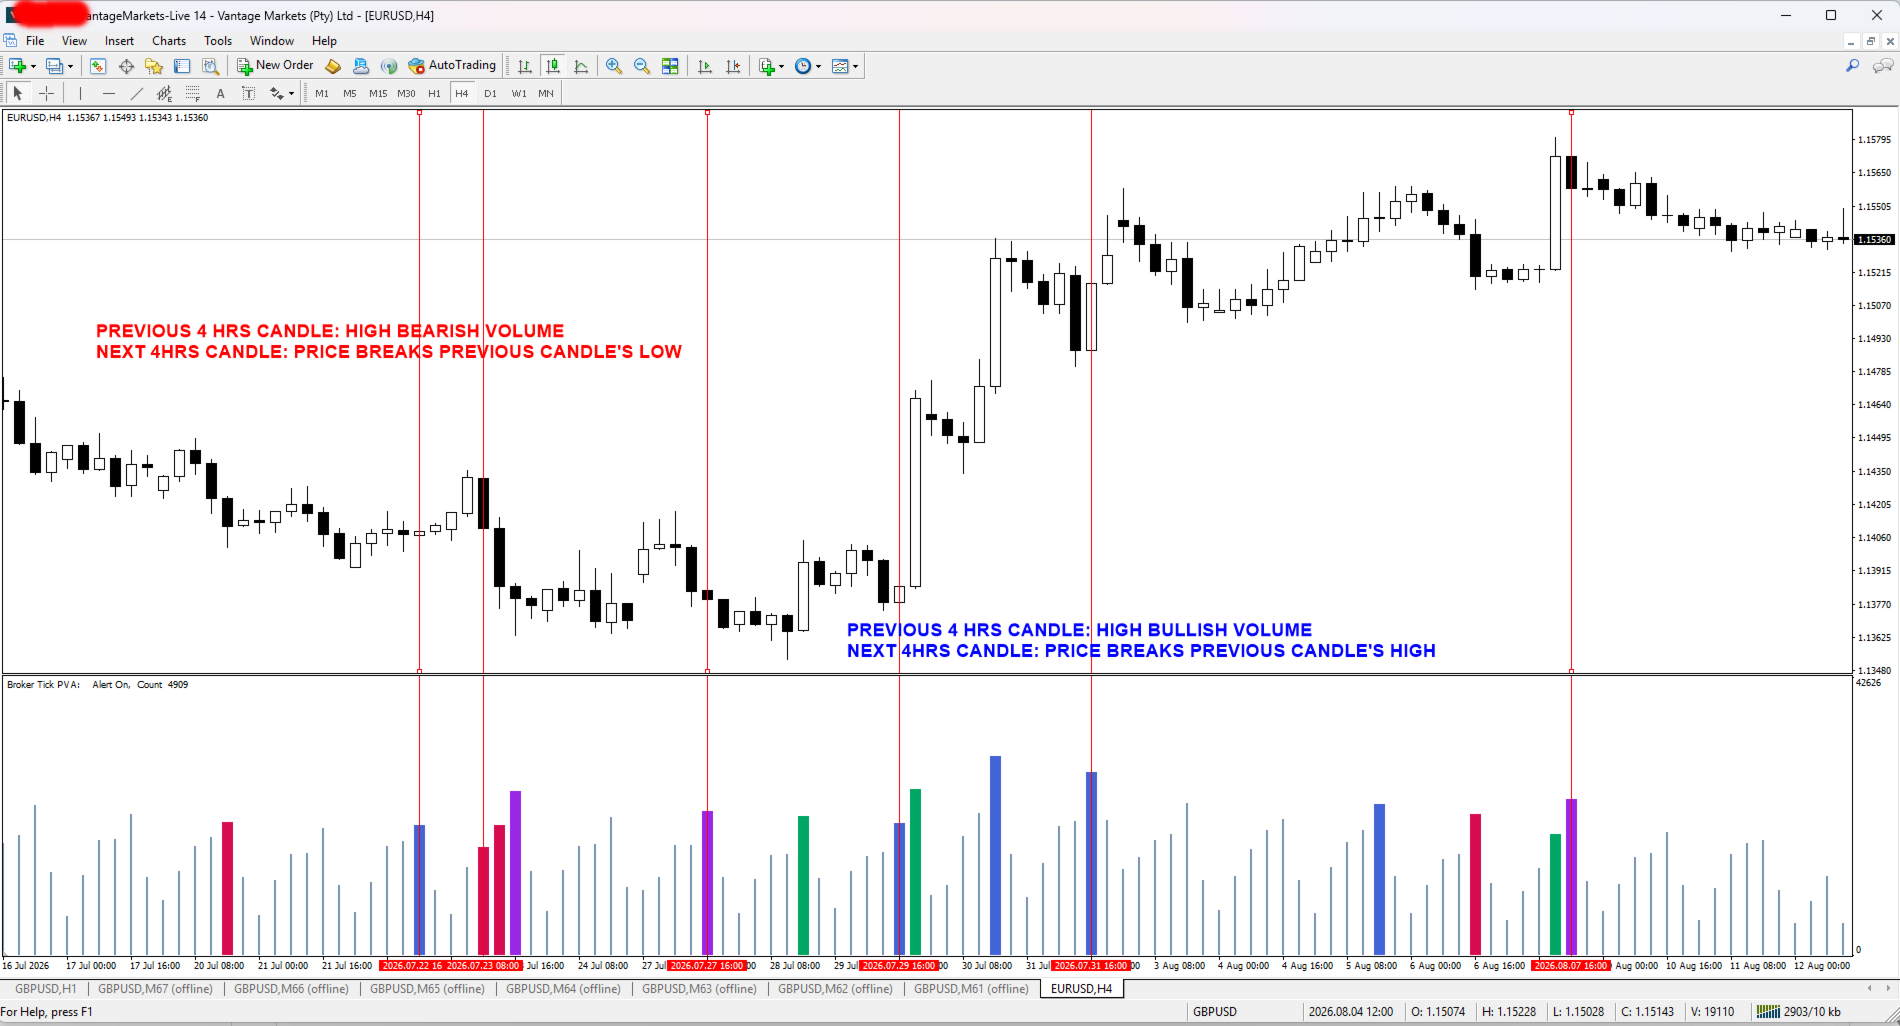
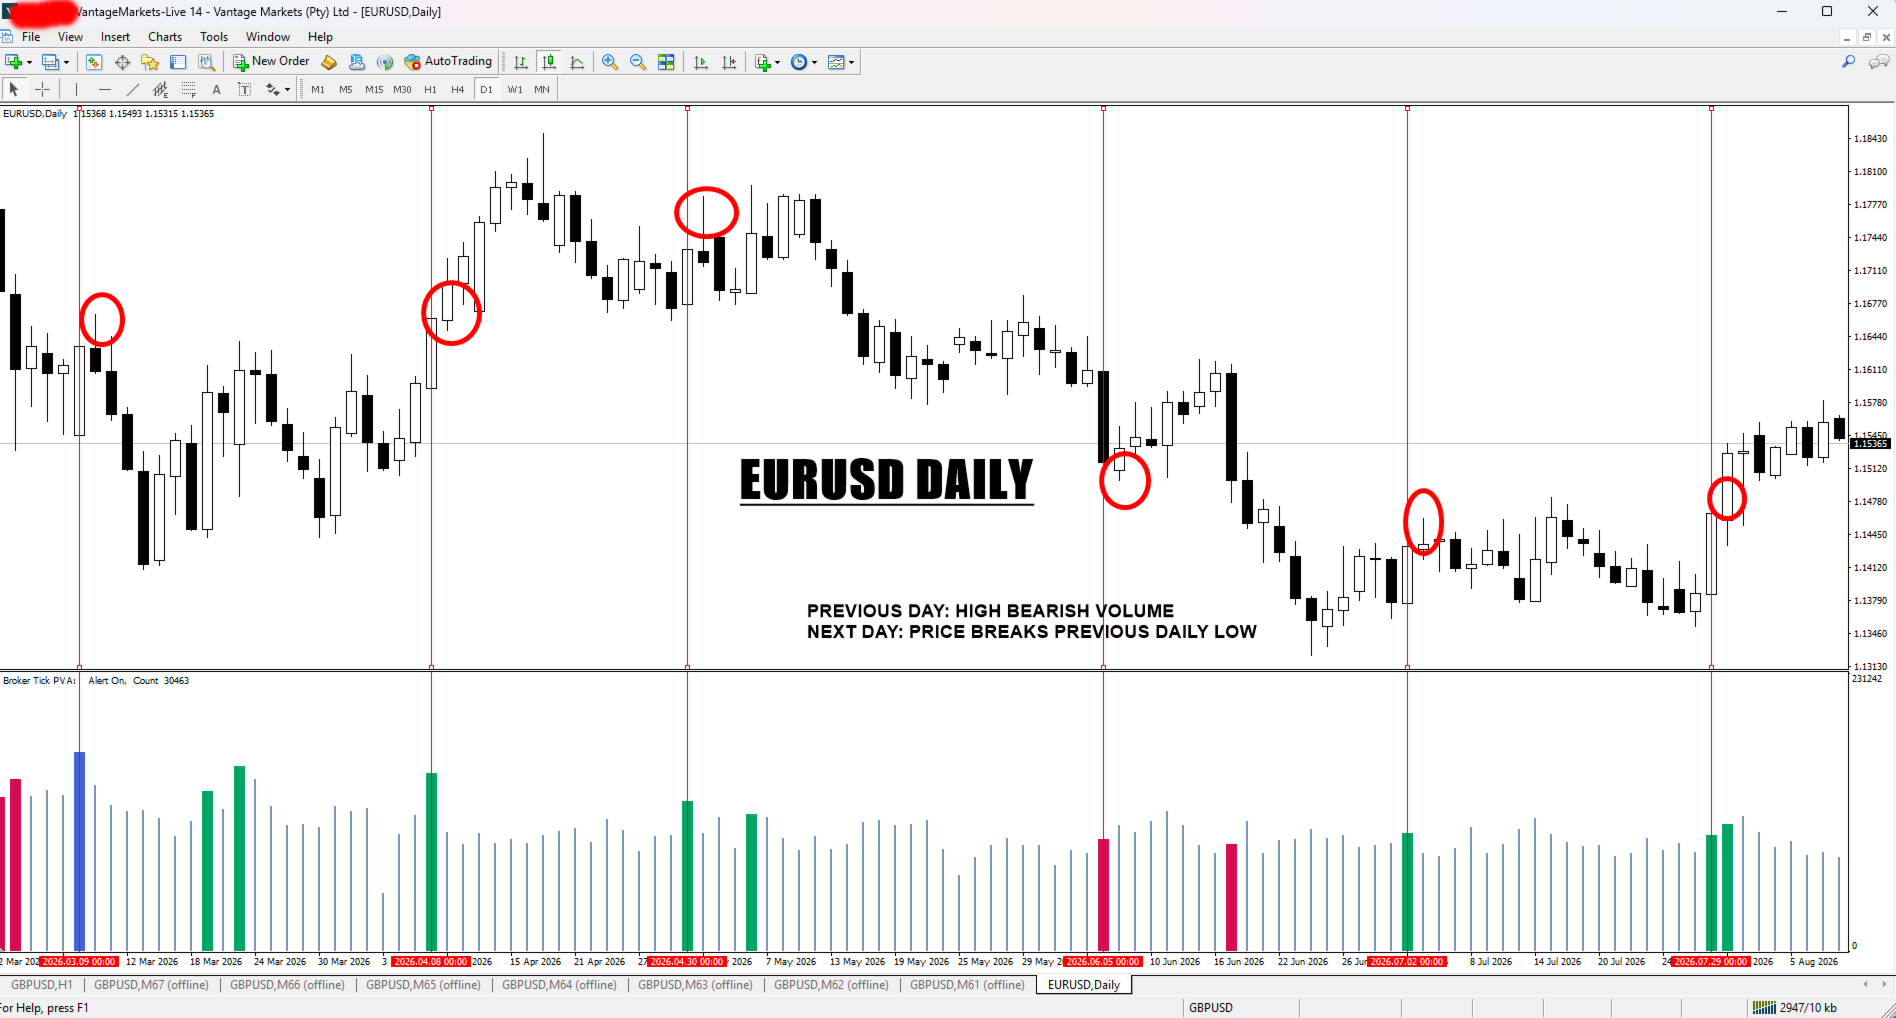
Bars with volume >= 200% of the average volume of the 10 previous chart TFs, and bars where the product of candle spread x candle volume is >= the highest for the 10 previous chart time TFs.


Default Colors: 


Bull bars are green and bear bars are red.


Situation "Volume Rising Above Average"


Bars with volume >= 150% of the average volume of the 10 previous chart TFs.

   Default Colors:  Bull bars are blue and bear are blue-violet.

PVA Color Options -


There are three PVA color options provided....

     1. Simple:  Use this option for a simple PVA two color display based on Climax only
        situations (an option allows you to include "Rising" volume).  You can change any

        color.  To start, a shade of blue/red are input for the PVA bull/bear bars.


     2. Standard:  Use this option for the 4-color PVA display where you can change any

        color. To start, the traditional PVA colors are input.


     3. Default:  There are no inputs.  The hard coded traditional PVA colors display.


These color options help traders suffering from color blindness by enabling them to choose the colors that work best for them.  Of course, there are many other reasons that some traders might wish to choose colors differing from the traditional colors. And, it is easy to return anytime to the default traditional PVA color display.

The Alert -


This indicator includes a sound-text alert that triggers once per TF at the first qualification of the TF bar as a "Climax" situation.  Set "Alert_On" to "true" to activate the alert.  Enter your "Broker_Name_In_Alert" to avoid confusion if simultaneously using multiple platforms.  If also using the PVA Candles indicator, be sure the two alert inputs in that indicator are set to "false".

The Standard Volumes Display -


A normal volume histogram is displayed in the single color selected.  However, you can highlight Climax situations with wider bars and utilize the Alert.


Strategy


On high volume candle, once its closed, traget previous candle´s high or low. Use higher timeframes.

Yazarın diğer ürünleri
Master Candle
Kristmundur Roman Zakharii
Master Candle (MC) Indicator automatically detects "Master Candles", also known as "Mother Candles", i.e. candle that engulf several candles that follow them. See screenshots. You can choose how many candles Master Candle should engulf. By default it is set to 4. Feel free to change colour and thickness of lines as it suites you. I find this indicator to be very useful to identify congestions and breakouts, especially on 60 minutes charts. Usually if you see candle closing above or below "Maste
FREE
Yearly Levels
Kristmundur Roman Zakharii
This indicator automatically plots Yearly High , Yearly Low and Yearly Average price levels from the previous year. It also builds two additional equidistant parallel levels ( Extended Highs R2 , R3 / Extended Lows S2 , R3 ) extended from previous Year High / Low. Extended High R3 / Low S3 is 100 percent Low-to-High extension ( as in Fibonacci 100 % extensions ) above / below the previous Year H/L and is the final reversal level with a sure reaction.  Extended High/Low R3/S3   represent the ulti
MACD Platinum
Kristmundur Roman Zakharii
This version of the MACD named MACD Platinum is the   MACD indicator calculated with ZeroLag moving averages (ZLEMA) .   ZLEMA is an abbreviation of   Zero Lag   Exponential   Moving Average . It was developed by John Ehlers and Rick Way. ZLEMA is a kind of Exponential   moving average   but its main idea is to eliminate the lag arising from the very nature of the   moving averages   and other trend following indicators.
Japanese Candle Patterns
Kristmundur Roman Zakharii
This indicator (translated from the Japanese source) automatically identifies authentic Japanese candlepatterns (Japanese Sakata Gohou rules) and displays with arrows the following Japanese candlestick patterns: BEARISH AND BULLISH ENGULFING CANDLES (known as Tsutsumi in Japanese) BULLISH THREE WHITE SOLDIERS BEARISH THREE BLACK CROWS BEARISH EVENING STARS BULLISH MORNING STARS THREE LINES THREE INSIDE DOWN (marks with a box) THREE INSIDE UP (marks with a box) You can switch off or on to have
Hurst Channel
Kristmundur Roman Zakharii
This tool is known as the Hurst Channel  or Hurst Bands . At first sight, it might resemble the  Bollinger Bands  because it consist of three bands, upper, lower and middle band.  So how do you trade this? If the asset is in a downtrend , you will see lower highs . If these lower highs retrace up to the upper band, you go with the main trend and take a sell. If you are in an uptrend , you should see higher lows that bounce off of the lower band. Stay concentrated on the highs and lows! For targ
MTF Kijun
Kristmundur Roman Zakharii
4 (1)
The indicator plots higher timeframe Kijun-sen (of Ichimoku ) on lower timeframes. To change timeframes, in the timeframe field enter the number: M1    PERIOD_M1 1 1 minute. M5    PERIOD_M5 5 5 minutes. M15  PERIOD_M15 15 15 minutes. M30  PERIOD_M30 30 30 minutes. H1    PERIOD_H1 60 1 hour. H4    PERIOD_H4 240 4 hour. D1    PERIOD_D1 1440 Daily. W1   PERIOD_W1 10080 Weekly. MN1  PERIOD_MN1 43200 Monthly. By default, the Kijun is shifted 3 periods forward but if you wish to have it exactly as

Separated tick volume moving averages: This tool makes it is easier to track the volume behind the moves. It will separate tick volume into bullish and bearish volumes with two separate moving averages. Tracking volume versus price in an easy way is now accessable to any trader. It will put you on track with the market makers and those who move the price. Volume is not the only thing which moves the price but its an important factor behind it. Hence it has a predictive power. How tick volume w
Tick Volume Moving Averages
Kristmundur Roman Zakharii
Separated tick volume moving averages: This tool makes it is easier to track the volume behind the moves. It will separate tick volume into bullish and bearish volumes with two separate moving averages. Tracking volume versus price in an easy way is now accessable to any trader. It will put you on track with the market makers and those who move the price. Volume is not the only thing which moves the price but its an important factor behind it. Hence it has a predictive power. How tick volume w
Filtrele:
Değerlendirme yok
Değerlendirmeye yanıt