SmartTrader Pip Value Display

SmartTrader Pip Value Display answers a question that trips up more traders than you'd expect: what is a pip actually worth, right now, on this symbol, at this lot size?

Why the textbook answer is often wrong

"$10 per pip on a standard lot" is a rule of thumb for a handful of major USD pairs - it is not a universal fact. Gold, indices, JPY pairs, and plenty of other symbols have real pip values that differ from that number, sometimes significantly, and it depends on your specific broker's contract specifications, not a textbook average.

What it shows

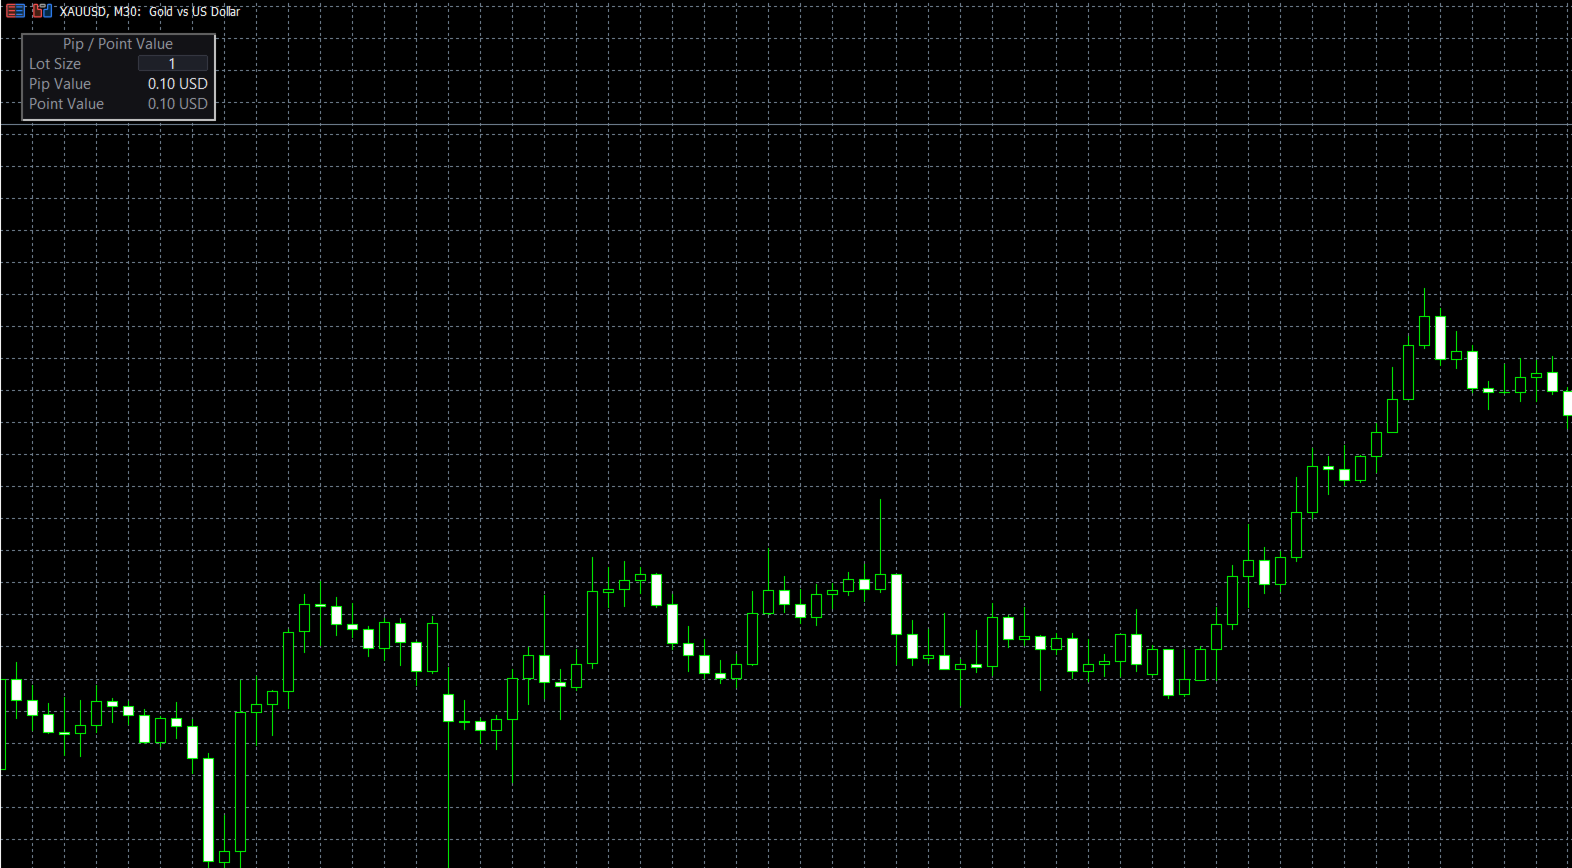
  • An editable Lot Size box directly on the chart - click it, type a number, press Enter
  • Pip Value - what one pip is worth in your account currency, at that lot size
  • Point Value - the same, for one point

Both are calculated from your broker's actual tick value and tick size (SYMBOL_TRADE_TICK_VALUE / SYMBOL_TRADE_TICK_SIZE), not an assumption. Pip vs. point is also detected automatically from the symbol's digit count - 5 and 3-digit ("fractional pip") brokers use 1 pip = 10 points, 4 and 2-digit brokers use 1 pip = 1 point - so you don't have to remember which convention your broker uses.

What it doesn't do

No signals, no scoring, no trade recommendations. It's a calculation utility, not an analysis tool - pairs naturally with SmartTrader Position Calculator if you want the lot-size math to go with it.

From the same developer as SmartTrader AI Pro.

Requirements: MetaTrader 5, any symbol.
Yazarın diğer ürünleri
SmartTrader MTF Trend Bias is a small, free indicator that answers one question: what's the trend doing across six timeframes at once? The panel shows: - Bullish / Bearish / Neutral for M1, M5, M15, M30, H1, and H4 - spelled out in full, color-coded, no symbols to decode - Hover any row for the exact reasoning (which EMAs, which direction) - Read only from each timeframe's last CLOSED bar, never the still-forming one - the most common cause of an MTF indicator "flipping its answer with no pric
FREE
Session Clock is a small, free indicator that answers one question at a glance: what trading session is active right now, and how long until it changes? The panel shows: - The current session (Asian, London, London/NY Overlap, New York, or Sydney/Late), color-coded - A live countdown to the next session change - What the next session will be Optionally, it also draws labeled vertical lines directly on your chart at each session boundary - so you can see exactly where the Asian session ended a
FREE
SmartTrader Volatility Monitor shows two things that matter before you take a trade: is the spread reasonable right now, and is volatility behaving normally? What it shows Spread - current spread in points, color-coded Good / Elevated / Wide against thresholds you set Volatility - current ATR compared to its recent average, shown as a ratio (e.g. "1.8x") and a state: Low, Normal, or High Why "Low" volatility gets flagged too, not just "High" Most volatility tools only warn about high volatility.
FREE
SmartTrader AI Pro
Ahmed Jazlaan Mohamed
Most technical indicators ask you to trust unverifiable claims. This one doesn't. Every scoring weight and every threshold in SmartTrader AI Pro was calibrated against real historical XAUUSD data using a documented, repeatable backtesting methodology - and the results (where the model's score genuinely correlates with subsequent price movement, and where it doesn't) are disclosed in the product documentation, not hidden behind "proven profitability" language. The panel shows: - Live price, spr
SmartTrader Position Calculator answers the question every trade needs answered before you place it: how big should this position actually be? Three draggable lines appear on your chart - Entry, Stop Loss, and Take Profit. Drag them to wherever your actual trade plan calls for, and the panel updates live: - Exact Lot Size, calculated from your chosen risk percentage and the real distance to your stop - How much you're actually risking, in your account currency - Risk:Reward ratio, from your T
SmartTrader Drawdown Tracker answers the question that matters most for account survival, not just profit: how far are you currently from your own high-water mark, and how bad has it gotten? What it shows Current Equity or Balance (your choice) Peak - the high-water mark since you attached it Drawdown - your current % distance from that peak, color-coded (green/amber/red at thresholds you set) Worst Seen - the maximum drawdown reached since tracking started, so a bad stretch doesn't get forgotte
SmartTrader Watchlist Scanner shows a quick technical bias across a list of symbols you choose, all in one panel - no more switching charts one by one to check how each instrument is looking. What it shows A 0-100 score per symbol, higher = more bullish, 50 = neutral The bias spelled out (Bullish, Bearish, Neutral) next to a colored score badge Quick preset categories - Forex Majors, Metals & Indices, Crypto, Energies, or a cross-category Mix - so you can get started without typing a single symb
SmartTrader Portfolio Risk Manager answers a question most traders never actually check: is your "diversified" portfolio genuinely diversified, or are several of your open positions secretly the same correlated bet wearing different symbol names? What it shows Portfolio-level drawdown - the same peak-equity/drawdown formula validated in SmartTrader AI Pro's EA circuit breaker, applied to your whole account Every open position, aggregated by symbol and direction, with real dollar risk calculated
Filtrele:
Değerlendirme yok
Değerlendirmeye yanıt