Median Indicator
- Göstergeler
-
Sofien Kaabar
 Quant Atlas 📈 builds quantitative market intelligence tools for traders and market researchers.
🔹Our work focuses on algorithmic support and resistance levels, market structure analytics, conviction frameworks, path probability, and decision support indicators for MetaTrader 5. - Sürüm: 1.0
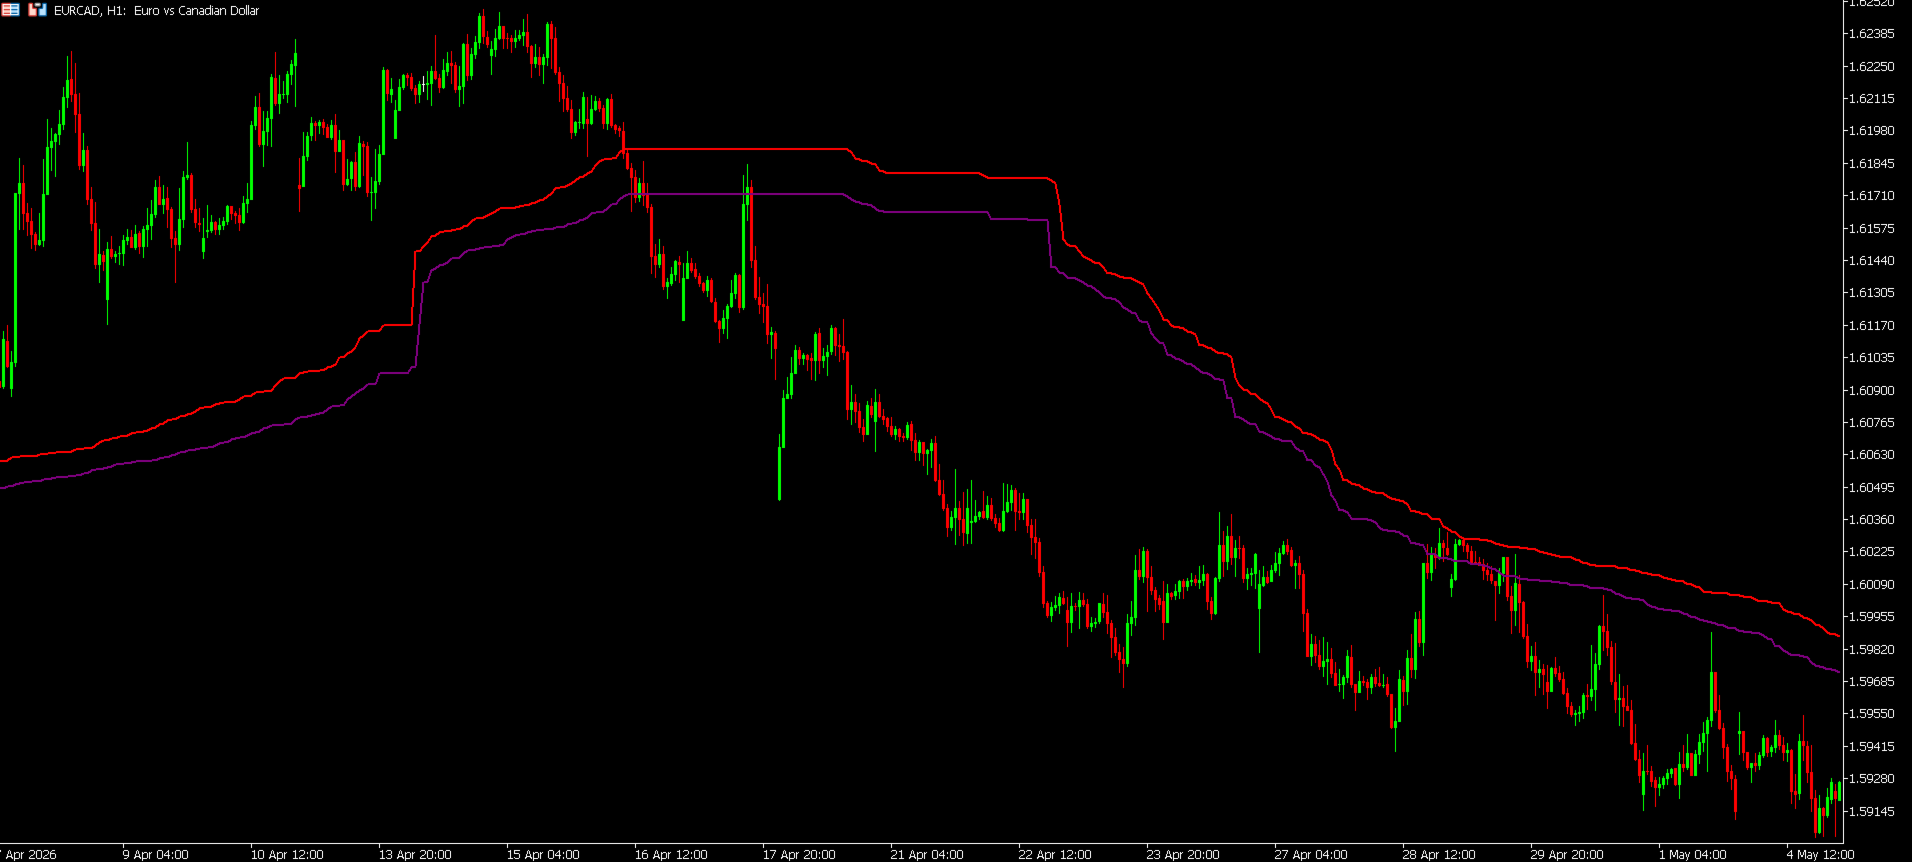
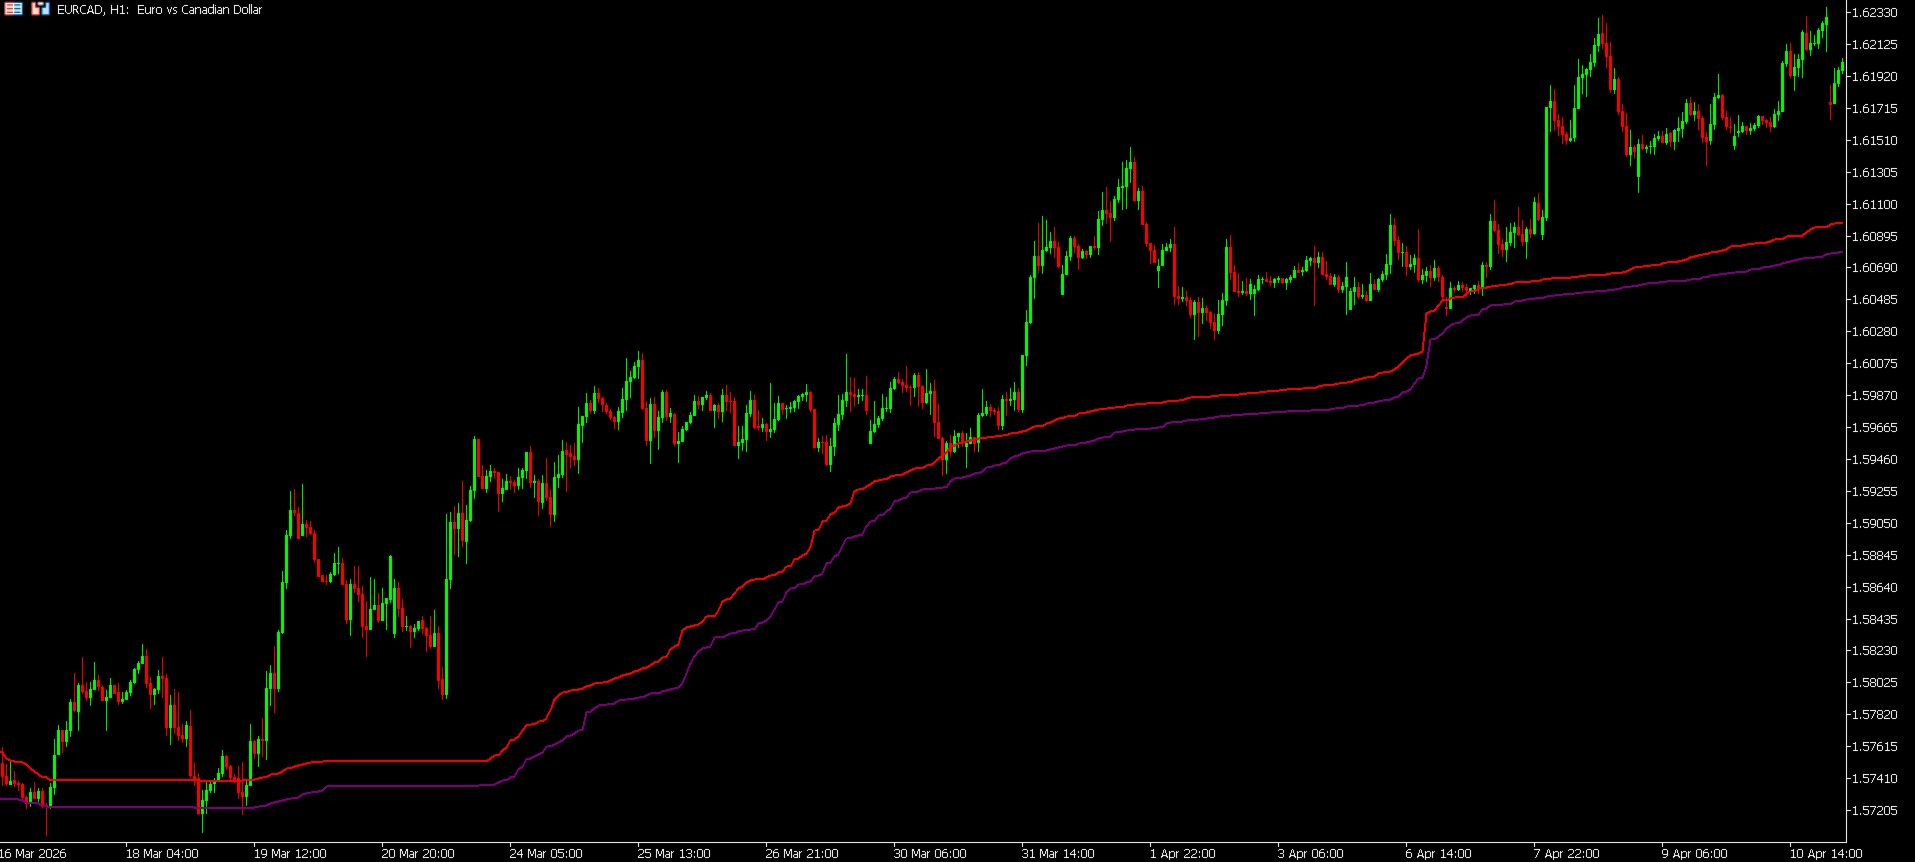
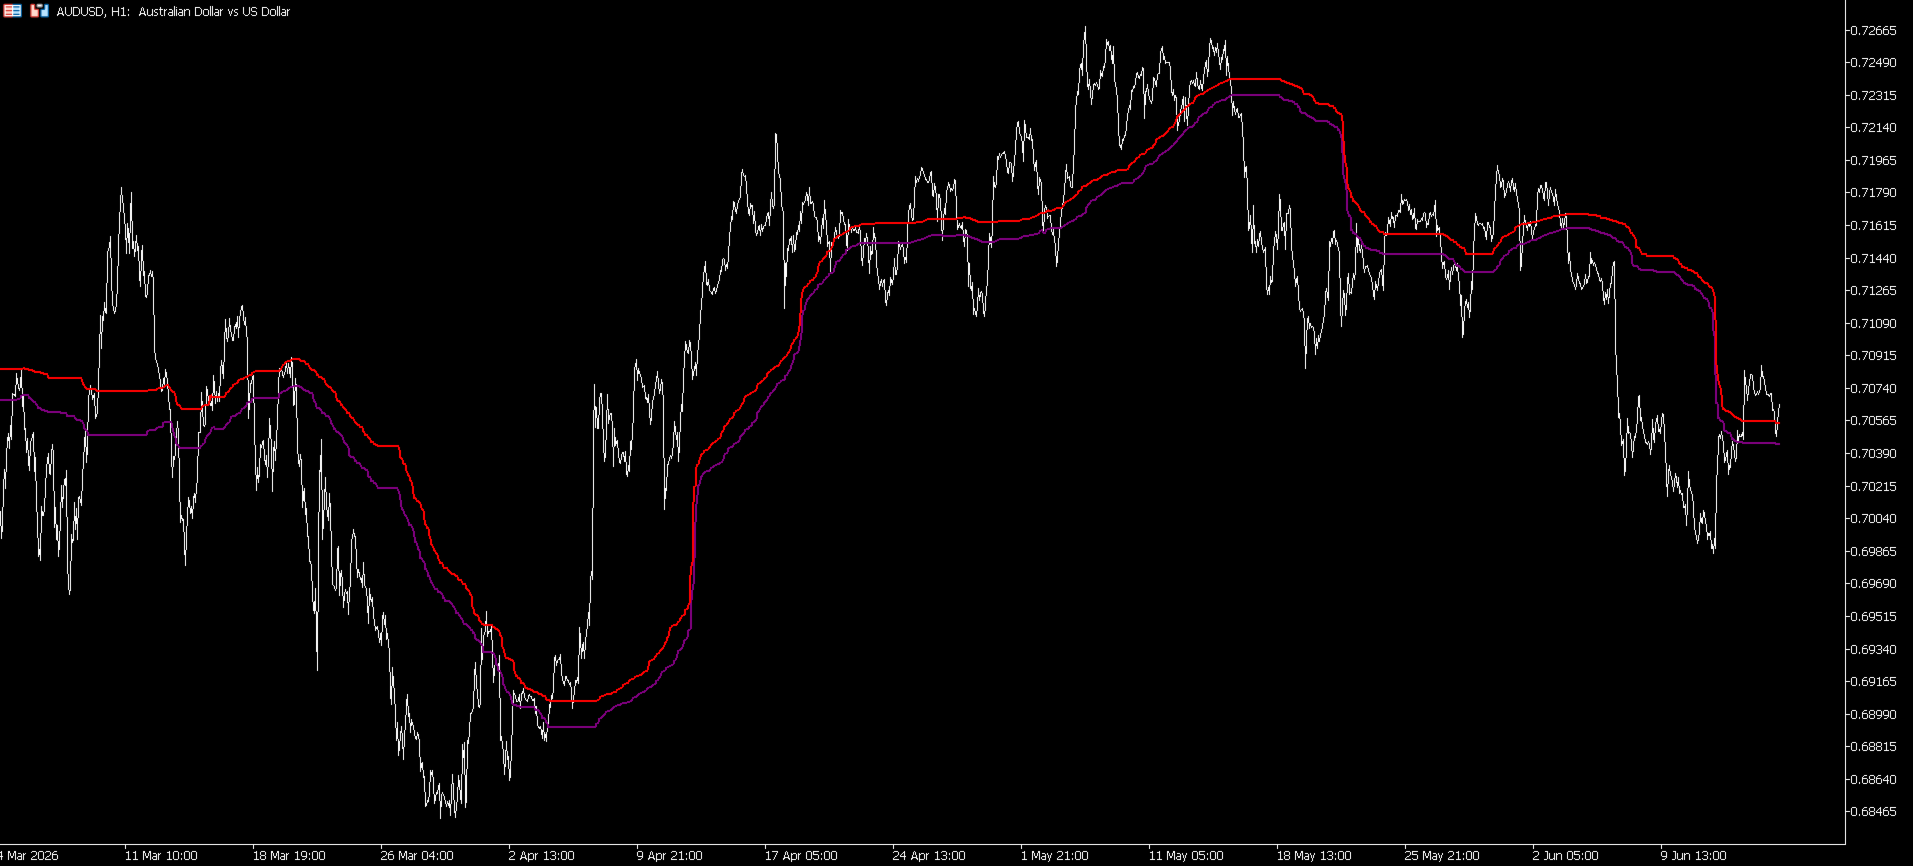
Median is a clean price structure indicator designed to plot the rolling median of recent highs and lows directly on the chart.
Creator: https://www.quant-atlas.com/
The indicator calculates the 50th percentile of recent low prices and high prices over a selected lookback window. This creates two dynamic reference lines that can help traders read the central structure of recent price behavior.
Signal Display
• Purple line: rolling median of lows
• Red line: rolling median of highs
These lines can act as adaptive reference zones for price structure, trend context, compression, and mean reversion analysis.
Key Features
• Rolling median structure
• Separate median line for highs and lows
• Default 200 period lookback
• Clean chart overlay
• Adjustable line colors and width
• Suitable for multiple markets and timeframes
• Useful as a structural filter or confirmation layer
How to Use
When price trades above the median structure, it may suggest that buyers are maintaining stronger control relative to recent price distribution.
When price trades below the median structure, it may suggest that sellers are maintaining stronger control relative to recent price distribution.
The space between the two median lines can also help traders observe changes in market structure, compression, and directional bias.
Important
Median is a decision support indicator. It does not predict future market direction and should not be used as a standalone trading system. It is best used with price action, trend context, support and resistance, volatility analysis, and proper risk management.