GDXM Multi Symbol Comparisson
- Göstergeler
- Sürüm: 1.28

Multi Symbol Comparison GDXM
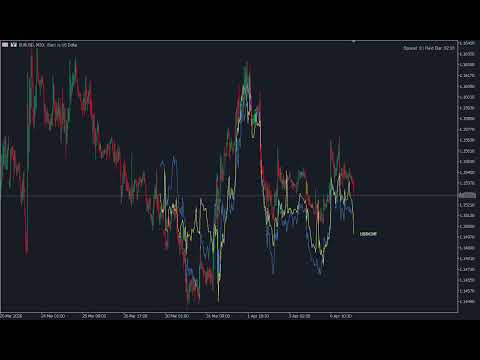
The Multi Symbol Comparison GDXM is a professional-grade institutional analysis tool designed for traders utilizing Smart Money Concepts (SMC) and ICT methodologies to identify market divergences and "cracks in correlation" (SMT - Smart Money Technique).
Unlike standard comparison indicators, this tool allows you to visualize up to 5 assets simultaneously, normalized on a 0–100% efficiency scale. This makes it effortless to identify which asset is leading or failing to follow the trend of the primary pair. There is a version that shows this indicator in a separated window.
Why use Multi Symbol Comparison?
-
SMT Detection: Visually identify when GBPUSD creates a new high while EURUSD fails to do so, signaling imminent institutional accumulation or distribution.
-
Multi-Timeframe Correlation: Synchronize higher timeframe data (such as Daily closes plotted on a 1H chart) to understand macro context within your micro execution.
-
Clean & Customizable UI: Built with scannability in mind, featuring high-legibility fonts (Verdana 8) and adjustable color schemes that won't clutter your workspace.
Key Features
-
Overlay up to 5 Assets: Compare highly correlated pairs (e.g., EURUSD, GBPUSD, AUDUSD) or inversely correlated assets (e.g., EURUSD vs. DXY).
-
Step Mode: Enable InpStepMode to visualize HTF closes in a "staircase" format, perfect for tracking "Power of 3" (PO3) open lines and daily bias.
-
Symbol Inversion: Built-in function to invert cross-currency pairs, allowing you to compare assets like USDJPY and EURUSD in the same visual direction.
-
Normalized Scaling (0-100%): All assets are adjusted to a common visual window, eliminating the confusion caused by different price denominations.
Technical Parameters
-
Symbols: Enter the asset name exactly as it appears in your "Market Watch" window.
-
Indicator Timeframe: Set the reference period for comparison (e.g., Daily, H4).
-
Lookback: Define the number of historical bars used for normalization calculations.
-
Label Offset: Adjust the horizontal distance of asset names to prevent overlap with current price action.
Pro Trader Tip: Use the Separate Window version to monitor the DXY (Dollar Index) relative strength while trading currency pairs, ensuring you are always aligned with institutional liquidity.