Dynamic Equilibrium
- Göstergeler
- Pieter Gerhardus Van Zyl
- Sürüm: 1.0
- Etkinleştirmeler: 10
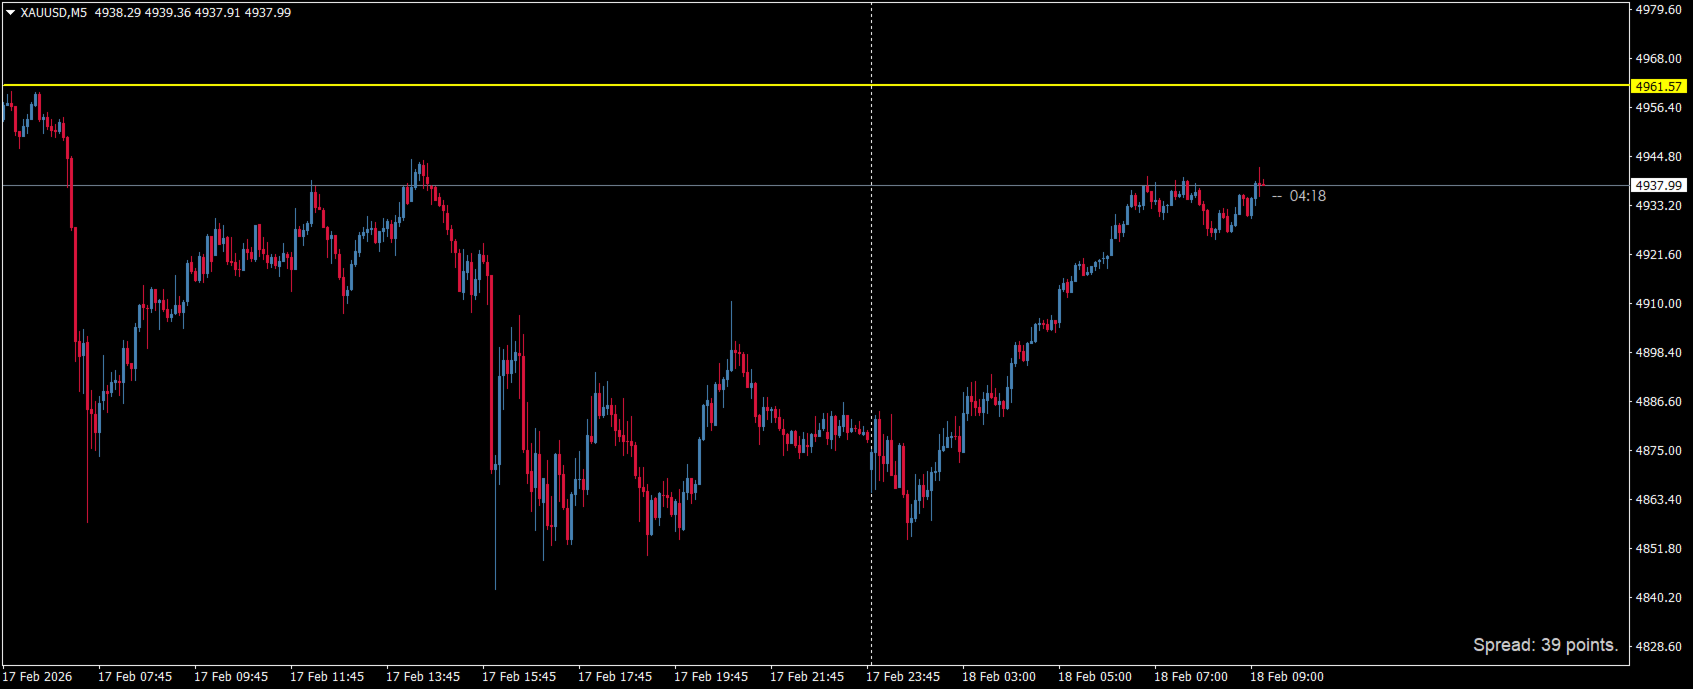
Dynamic Equilibrium is a precision-based price balancing indicator designed to identify statistically significant equilibrium levels derived from recent market behavior. Instead of plotting traditional oscillators or lagging averages, it projects a single adaptive horizontal equilibrium line directly onto the main chart — highlighting where price is most likely to rebalance after expansion or dynamically keep moving towards.
At its core, the indicator evaluates short-term volatility, directional pressure, and displacement characteristics within a controlled historical window. When a qualifying imbalance condition appears, a new equilibrium level is calculated and locked in. This level remains stable until a fresh structural shift is detected, ensuring clarity and reducing noise. The built-in timer refresh mechanism keeps the level synchronized with new market data without constant recalculation thus keeping it dynamic.
The appearance of the equilibrium line is fully customizable, allowing you to control color, width, and style.
How to Use
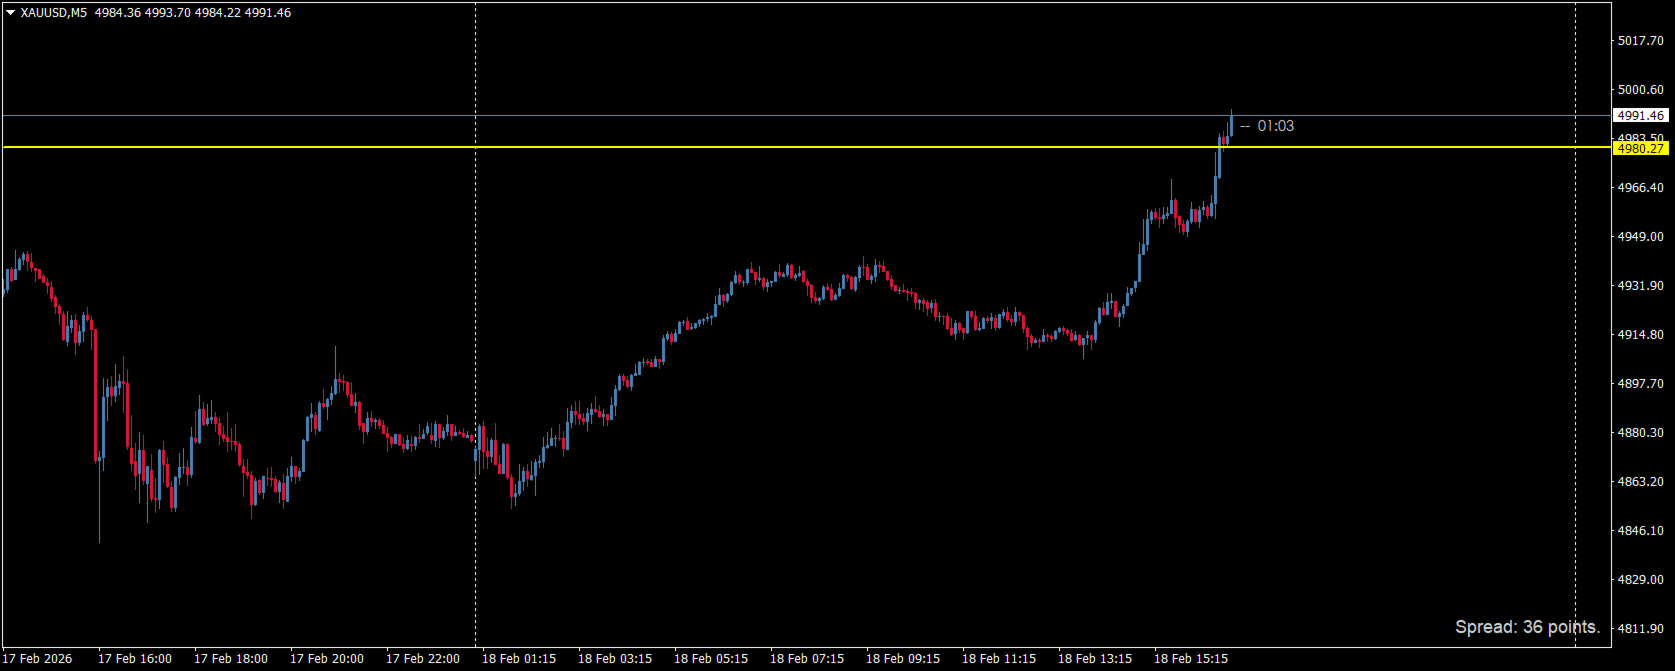
If price holds consistently below the equilibrium and the equilibrium line moves further away, it suggests bullish control. Sustained trading above the line and the line keeps moving lower indicates bearish pressure. Use it as a directional bias filter for lower-timeframe trading.
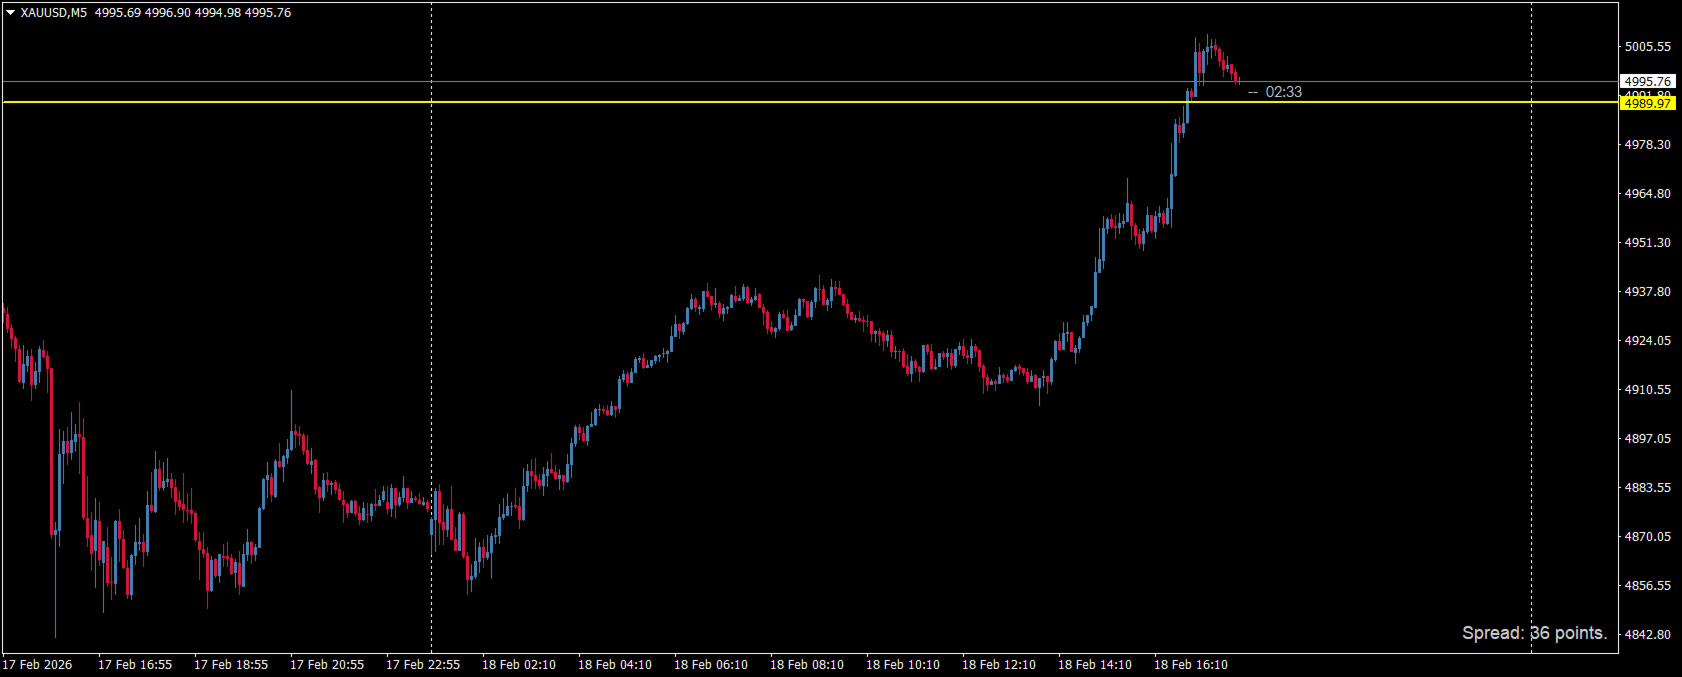
2. Mean Reversion Context
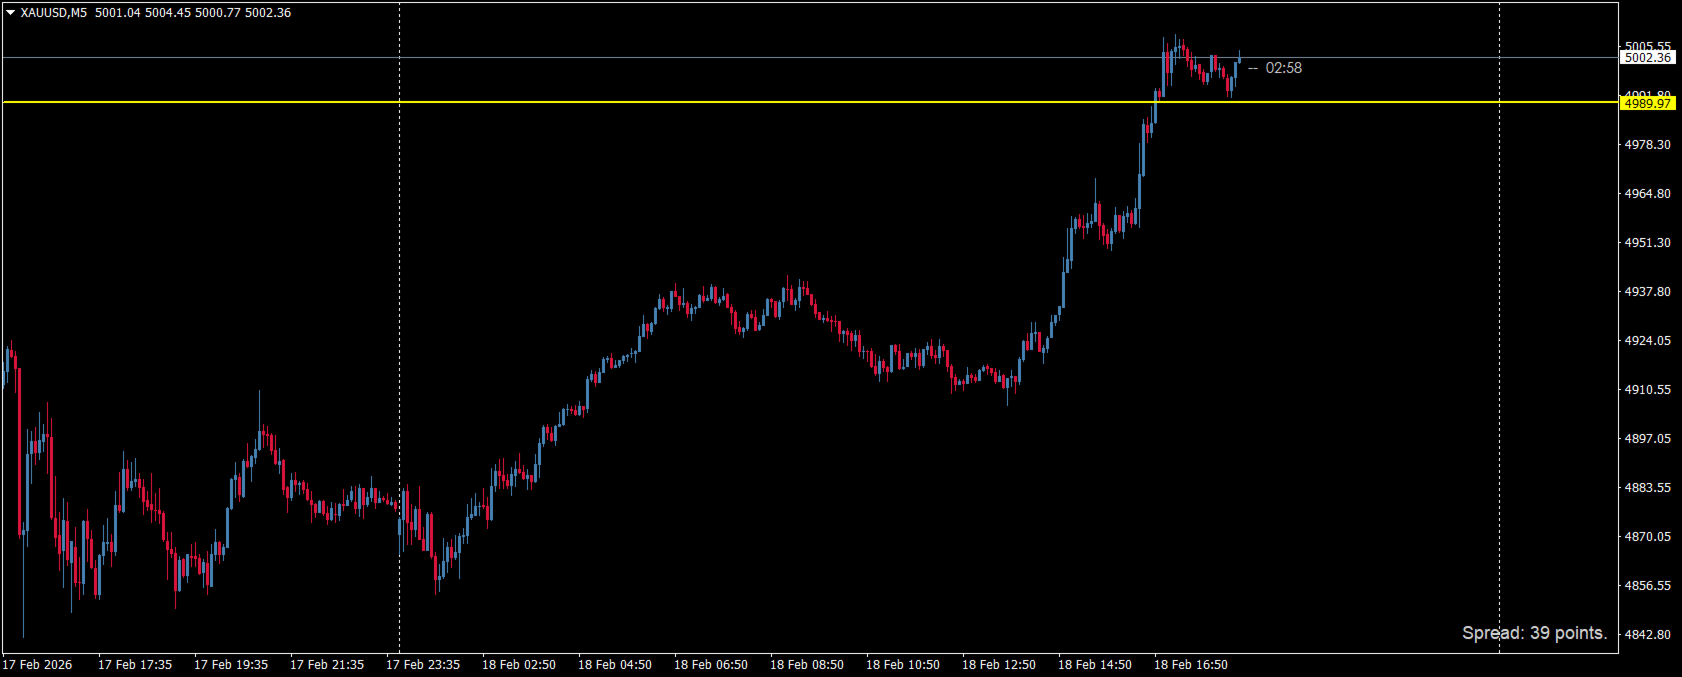
When price stretches aggressively away from the equilibrium line, it often signals temporary imbalance. Watch for exhaustion patterns or confirmation signals to anticipate a pullback toward the level.
Symbol - Any | Timeframe - 1 minute or 5 minute recommended
Dynamic Equilibrium is best used as a potential magnetic line — not a certain signal generator. Pair it with price action or order-flow concepts while keeping execution disciplined and adaptive.