Canvas Footprint

Footprint Indicator for MT5


1. Introduction 


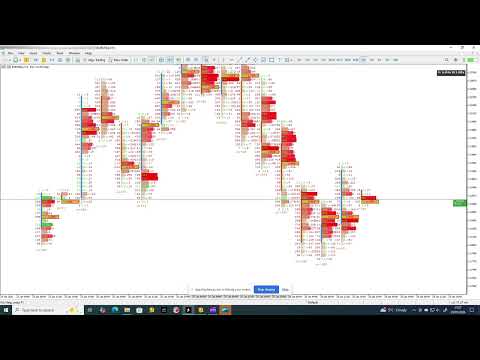
This Indicator provides a real-time footprint and volume profile visualization per candle directly on MetaTrader 5 charts, allowing traders to analyze order flow, volume distribution, and market pressure with precision. 


2. Installation 

1. Copy the Indicator file into the MetaTrader 5 /Indicators folder. 

2. Restart MetaTrader 5. 

3. Drag the Indicator onto a chart. 


3. Indicator Overview 

The Indicator renders a footprint representation for each candle, displaying Bid and Ask traded volume, delta values, and the Point of Control (POC). Columns can be stacked or scrolled horizontally to inspect historical order flow without changing timeframe. 


4. Footprint Concepts Bid / Ask Volume

Displays traded volume at each price level separated by aggressor side. Delta: The difference between Ask and Bid volume, indicating buying or selling pressure. Point of Control (POC): The price level with the highest traded volume within a candle. 


5. Inputs and Settings

All Indicator parameters are configurable via the Inputs tab. Typical settings include:- Number of footprint columns displayed- Price aggregation step- Color settings for Bid, Ask, Delta, and POC- Scroll and stacking behaviour. Refer to the input descriptions in MT5 for precise parameter definitions. 


6. How to Read the Footprint

High Ask volume above the POC suggests aggressive buying. High Bid volume below the POC suggests aggressive selling. Divergence between delta and price movement may indicate absorption or exhaustion. 

7. How to use the vertical zoom

Dragging with the left mouse button pressed on the price scale will activate the vertical zoom at the speed set in the input parameter.

8. How to use the horizontal zoom

Scrolling the mouse wheel while pressing the ctrl key will activate the horizontal zoom at the speed set in the parameters. Minimum and maximum zoom level can be set  as input parameter.

9. Typical Use Cases 

Identifying institutional activity- Confirming breakouts and reversals- Scalping and intraday order-flow analysis 


10. Performance Notes & Limitations

The Indicator is optimized for intraday analysis. Very low timeframes and extended history depth may increase CPU usage depending on broker tick density. 


11. Troubleshooting

Check broker provides real tick volume- Reduce visible columns if performance degrades. If on lunching the indicator only one bar is visible, just switch timeframe to reload ticks data. 


12. Disclaimer

This Indicator is a trading analysis tool and does not provide trading signals. Trading involves risk. Past performance is not indicative of future results


13. Input parameters definition


GENERAL INPUT PARAMETERS

  • Number of footprint bars to display on chart
    Sets how many footprint columns are drawn on the chart at the same time.

  • Number of ticks to load for footprint calculation
    Defines how much tick history is loaded to build the footprints. If you notice missing footprints or a weekend gap increase the value

  • Use the chart's current timeframe (true) or custom period (false)
    Chooses whether footprints follow the chart timeframe or a custom one.

  • Custom footprint period in minutes 
    Sets a manual timeframe for footprints when not using chart timeframe.

  • Horizontal spacing between footprint columns in pixels
    Controls the distance between each footprint column.

  • Multiplier for price step size in footprint display
    Adjusts the vertical price resolution of footprint rows.

  • Display large numbers in 'K' notation (e.g., 1K = 1000)
    Shortens large volume numbers for readability.

  • Fix the footprint canvas height regardless of zoom
    Prevents canvas height from changing when zooming.

  • Fixed canvas height in pixels 
    Sets the exact height of the footprint drawing area.

  • Margin from top of chart to footprint display
    Adds vertical spacing above the footprint area.

  • Show bid price line
    Enables drawing of the bid price line.

  • Color of bid price line
    Sets the color of the bid line.

  • Transparency of bid price line (0 = transparent, 255 = opaque)
    Controls how visible the bid line is.

  • Show ask price line
    Enables drawing of the ask price line.

  • Color of ask price line
    Sets the color of the ask line.

  • Transparency of ask price line
    Controls how visible the ask line is.

  • Hide the default chart price line
    Removes MetaTrader’s standard price line.

PRICE AND TIMEFRAME COUNTER BOX

  • Show price and timeframe counter box
    Displays a box with current price and timeframe information.

  • Background color of counter box
    Sets the background color of the box.

  • Transparency of counter box background
    Controls box background opacity.

  • Text color inside counter box
    Sets the color of the text in the box.

  • Transparency of counter box text
    Controls text opacity inside the box.

  • Border color of counter box
    Sets the outline color of the box.

  • Transparency of counter box border
    Controls the opacity of the box border.

VOLUME PROFILE HISTOGRAM

  • Show volume profile histogram
    Enables the volume profile next to footprints.

  • Selected histogram position
    Chooses whether the histogram is centered, left, or right.

  • Use gradient coloring based on volume intensity
    Changes bar color intensity according to volume size. Higher the volume more intense the bar color

  • Color for buy volume bars
    Sets the color of buy volume histogram bars.

  • Color for sell volume bars
    Sets the color of sell volume histogram bars.

  • Transparency of volume profile bars
    Controls histogram bar opacity.

  • Show border around histogram bars
    Enables borders around each bar.

  • Border color for buy volume bars
    Sets border color for buy bars.

  • Border color for sell volume bars
    Sets border color for sell bars.

  • Transparency of histogram bar borders
    Controls border opacity.

  • Height of each histogram row in pixels
    Sets vertical size of each price level row.

TEXT LABELS (VOLUME & DELTA)

  • Font size for volume and delta text labels
    Controls the size of text labels.

  • Font name used for all text labels
    Sets the font family used throughout.

TOTAL VOLUME LABELS (Histogram Side)

  • Show total buy/sell volume labels on histogram side
    Displays aggregated volume values next to histogram.

  • Text color for total buy volume labels
    Sets color of total buy volume text.

  • Text color for total sell volume labels
    Sets color of total sell volume text.

BUY / SELL VOLUME LABELS

  • Show separate buy and sell volume labels
    Displays individual buy and sell values per price level.

  • Text color for buy volume labels
    Sets color of buy volume text.

  • Text color for sell volume labels
    Sets color of sell volume text.

DELTA LABELS

  • Show delta (buy-sell) volume labels
    Displays the difference between buy and sell volume.

  • Text color for positive delta values
    Sets color for positive delta numbers.

  • Text color for negative delta values
    Sets color for negative delta numbers.

CANDLES

  • Show candlestick chart overlay
    Enables candle drawing over footprints.

  • Width of each candle body in pixels
    Controls candle body thickness.

  • Color for bullish candles
    Sets color of bullish candles.

  • Color for bearish candles
    Sets color of bearish candles.

  • Transparency of candle bodies
    Controls candle body opacity.

  • Show candle borders and wicks
    Enables drawing of candle outlines and wicks.

  • Color for candle borders and wicks
    Sets color of candle outlines and wicks.

  • Transparency of candle borders and wicks
    Controls opacity of candle outlines.

POINT OF CONTROL (POC)

  • Show Point of Control (POC) line/marker
    Displays the price level with highest volume.

  • Color for POC when delta is positive
    Sets POC color for positive delta.

  • Color for POC when delta is negative
    Sets POC color for negative delta.

  • Transparency of POC fill
    Controls POC visibility.

  • Border color for POC
    Sets outline color of the POC.

ZOOM CONTROLS

  • Disable default MetaTrader zoom controls
    Turns off built-in platform zoom behaviour.

  • Display current horizontal zoom level on chart
    Shows numerical zoom level.

  • Distance of zoom level display from top of canvas
    Controls vertical placement of zoom label.

  • Font size for zoom level text
    Sets zoom label text size.

  • Font name for zoom level text
    Sets zoom label font.

  • Background color of zoom level box
    Sets zoom label background color.

  • Transparency of zoom level box background
    Controls zoom label background opacity.

  • Border color of zoom level box
    Sets border color of zoom label box.

  • Transparency of zoom level box border
    Controls border opacity.

  • Font color for zoom level text
    Sets zoom label text color.

  • Transparency of zoom level text
    Controls zoom label text opacity.

    HORIZONTAL ZOOM

    • Enable horizontal zoom functionality
      Allows zooming in and out horizontally.

    • Speed factor for horizontal zoom
      Controls how fast horizontal zoom reacts.

    • Maximum allowed horizontal zoom level
      Sets upper horizontal zoom limit.

    • Minimum allowed horizontal zoom level
      Sets lower horizontal zoom limit.

    PERFORMANCE OPTIMIZATION

    • Target frames per second for rendering
      Limits rendering speed to reduce CPU usage.

    • Enable caching to improve chart rendering performance
      Reuses cached data to improve performance.

    • Cache update interval in milliseconds
      Controls how often cached data is refreshed.


    14. How to use the zoom

    The vertical zoom is activated by dragging on the chart's price with the left mouse's button while the horizontal zoom is activated by scrolling while pressing the ctrl key. Press 'r/R' key to reset the zoom. 

    15. Panning function

    To pan horizontally simply press ctrl key and left click the mouse on the screen (the mouse button must be released). The panning remains active as long as the ctrl key is pressed. To pan vertically, drag on the chart with the left mouse's button.


    If any further explanation about this Indicator is needed or if any problem is encountered, kindly get in touch.

    This Indicator is under active development thus stay tuned for more functionality to be added. 

    16. Set files

    Sorry but I had to remove the link to my google-drive as it doesn't comply with the market rules. I will write soon a blog entry and put some link there to download some pre-defined set file for various pairs. 

    Önerilen ürünler
    The indicator highlights the points that a professional trader sees in ordinary indicators. VisualVol visually displays different volatility indicators on a single scale and a common align. Highlights the excess of volume indicators in color. At the same time, Tick and Real Volume, Actual range, ATR, candle size and return (open-close difference) can be displayed. Thanks to VisualVol, you will see the market periods and the right time for different trading operations. This version is intended f
    FREE
    Weis Waves
    Flavio Javier Jarabeck
    2.83 (18)
    The original author is David Weis, an expert in the Wyckoff Method. The Weis Wave is a modern adaptation of the 1930's Wyckoff Method, another expert in Tape Reading techniques and Chart Analysis. Weis Waves takes market volume and stacks it into waves according to price conditions giving the trader valuable insights about the market conditions. If you want to learn more about this subject you can find tons of videos in YouTube. Just look for "The Wickoff Method", "Weis Wave" and "Volume Spread
    FREE
    Aggression Volume
    Flavio Javier Jarabeck
    4.29 (17)
    Aggression Volume Indicator is the kind of indicator that is rarely found in the MQL5 community because it is not based on the standard Volume data provided by the Metatrader 5 platform. It requires the scrutiny of all traffic Ticks requested on the platform... That said, Aggression Volume indicator requests all Tick Data from your Broker and processes it to build a very special version of a Volume Indicator, where Buyers and Sellers aggressions are plotted in a form of Histogram. Additionally,
    FREE
    Value Chart Candlesticks
    Flavio Javier Jarabeck
    4.57 (14)
    The idea of a Value Chart indicator was presented in the very good book I read back in 2020 , " Dynamic Trading Indicators: Winning with Value Charts and Price Action Profile ", from the authors Mark Helweg and David Stendahl. The idea is simple and the result is pure genius: Present candlestick Price analysis in a detrended way! HOW TO READ THIS INDICATOR Look for Overbought and Oversold levels. Of course, you will need to test the settings a lot to find the "correct" one for your approach. It
    FREE
    Here   our more valuable tools SMC Trend Trading   ,  Easy SMC Trading  ,  Institutional SMC Architect Volume Analysis Tools  ,  Volume flow Profile  ,  Market volume profile  , FVG with Volume  , Liquidity Heatmap Profile  ,  Volume Spread Analysis Automatically detects major swing points not internal noise Generates buy/sell signals at key Fibonacci levels Displays professional GUI panel with real-time analysis Marks major swings with visual indicators Trading Strategy BUY at 38.2%-61.8% Fib
    FREE
    (Special New Year promotion - free price!) The indicator displays the actual 'Scale in points per bar' (identical to the manual setting in the Terminal, see screenshot) in the upper right corner of the chart. The displayed value changes INSTANTLY whenever the chart scale is changed! (This is very convenient when planning screenshots). In Settings: Change language (Russian/English), font size of the displayed text, text label offset coefficient from the graph corner, equally in X and Y directi
    FREE
    The "MR Volume Profile 5" indicator is a charting tool that displays trading volume at different price levels rather than time intervals. A key concept in volume profile is the point of control (POC)—the price level with the highest volume traded during the session or time range. While tools like VWAP or OBV provide volume trends, the "MR Volume Profile 5" indicator offers granular detail about where the most market activity occurs at specific price levels. This makes it a more precise tool for
    Mirror Chart MT5
    Andrej Hermann
    5 (1)
    The Mirror Chart MT5 is a overlay indicator specifically designed to project a second financial instrument directly onto the main chart window. This tool is invaluable for traders who rely on correlation analysis, as it visualizes the price movements of two different instruments in real time. Unlike traditional overlays, this indicator utilizes intelligent, dynamic centering and scaling logic. It continuously analyzes the visible price range in the current window for both symbols and calculates
    FREE
    Haven Volume Profile
    Maksim Tarutin
    4.55 (11)
    Haven Volume Profile, ticaret hacminin dağılımına dayalı olarak önemli fiyat seviyelerini belirlemeye yardımcı olan çok fonksiyonlu bir hacim profili analiz göstergesidir. Piyasayı daha iyi anlamak ve önemli giriş ve çıkış noktalarını belirlemek isteyen profesyonel yatırımcılar için tasarlanmıştır. Diğer Ürünler ->  BURADAN Temel Özellikler: Point of Control (POC) Hesaplama - en yüksek ticaret aktivitesinin gerçekleştiği seviye, en likit seviyeleri belirlemeye yardımcı olur Value Area (yüksek ak
    FREE
    White Weis Volume Ticks
    Ricardo Almeida Branco
    5 (4)
    White Weis Volume This indicator shows the sum of the volume in each wave, bulish or bearish, as idealized by David Weis , but it brings an important addition , which is the marking of the bar with the highest volume of the wave (White Bar)! In coding the indicator, it was sought to optimize the code to require minimal processing during use and not to overload mt5. The indicator can be used for pre-trading analysis and study, where the trader analyzes possible points of support and resistance
    Volume Profile Density V2.40 Fiyat seviyelerine göre işlem hacmini gösterir ve kurumsal ilgiyi çeken bölgeleri ortaya çıkarır. Klasik hacim göstergelerinden farklı olarak, hacmin gerçekte nerede yoğunlaştığını gösterir. Temel ilkeler: Yatay çubuklar = her fiyat seviyesindeki işlem hacmi Daha uzun çubuk → daha yüksek hacim Kırmızı bölgeler = güçlü destek / direnç alanları Ana kullanımlar: Gerçek destek ve direnç bölgelerini belirleme POC (Point of Control) tespiti Değer Alanı (toplam hacmin %70’i
    FREE
    Donchian Pro
    Paulo Henrique Faquineli Garcia
    4.75 (4)
    The Donchian Channel Channels are among the most popular tools of technical analysis, as they visually convey to the analyst the limits within which most price movement tends to occur. Channel users know that valuable information can be obtained at any time, whether prices are in the central region of a band or close to one of the border lines. One of the best known techniques to explore these concepts is Bollinger Bands. However, John Bollinger was not the only one to research the application
    FREE
    VWAP + Volume Profile Combined Indicator FREE Launch Offer OVERVIEW Professional combination of VWAP (Volume Weighted Average Price)  and Volume Profile in a single MT5 indicator. This powerful tool  combines two of the most respected institutional trading tools  into one seamless display. KEY FEATURES 1. VWAP with 6 calculation modes 2. Volume Profile with Value Area analysis 3. Point of Control identification 4. Standard deviation bands 5. Dynamic color changing 6. Separate buy/sell vol
    FREE
    Enhanced Volume Profile: The Ultimate Order Flow & Liquidity Analysis Tool Overview Enhanced Volume Profile is an indicator for MetaTrader 5 that displays the traded volume at specific price levels over a defined period. It separates the total volume into buy and sell components, presenting them as a side-by-side histogram on the chart. This allows users to observe the volume distribution and the proportion of buy and sell volumes at each price level. Graphics Rendering The indicator uses the
    FREE
    VP hidden
    Emr Aljnaby
    4.33 (12)
    The indicator works to convert normal volume into levels and determine financial liquidity control points. It is very similar in function to Fixed Volume Profile. But it is considered more accurate and easier to use than the one found on Trading View because it calculates the full trading volumes in each candle and in all the brokers present in MetaTrade, unlike what is found in Trading View, as it only measures the broker’s displayed prices. To follow us on social media platforms: telegram
    FREE
    Order Book, known also as Market Book, market depth, Level 2, - is a dynamically updated table with current volumes of orders to buy and to sell specific financial instument at price levels near Bid and Ask. MetaTrader 5 provides the means for receiving market book from your broker, but in real time only, without access to its history. This expert adviser OrderBook History Playback allows you to playback the market book events on the history using files, created by OrderBook Recorder . The exper
    FREE
    Donchian Breakout And Rsi
    Mattia Impicciatore
    4.5 (2)
    Genel Açıklama Bu gösterge, klasik Donchian Kanalı ’nın geliştirilmiş bir versiyonudur ve gerçek işlem için pratik işlevlerle zenginleştirilmiştir. Standart üç çizgiye (üst, alt ve orta çizgi) ek olarak sistem breakout (fiyat kırılımı) noktalarını tespit eder ve bunları grafikte oklarla görsel olarak gösterir. Ayrıca grafiği sadeleştirmek için mevcut trend yönünün tersindeki çizgi yalnızca görüntülenir. Gösterge şunları içerir: Görsel sinyaller : Kırılım sırasında renkli oklar Otomatik bildiriml
    FREE
    BoxInside MT5
    Evgeny Shevtsov
    5 (4)
    This indicator calculates the volume profile and places labels that correspond to the VAH, VAL and POC levels, for each candle individually. Indicator operation features The indicator works on the timeframes from M3 to MN, but it uses the history data of smaller periods: M1 - for periods from M3 to H1, M5 - for periods from H2 to H12, M30 - for the D1 period, H4 - for the W1 period, D1 - for the MN period. The color and location of the VAL, VAH and POC labels on the current candle are considere
    FREE
    Introduction Welcome to the world of Forex trading, where every tick of the market can be influenced by news events. Introducing our expert advisor for MetaTrader, your ultimate tool for navigating the complexities of news trading. This innovative advisor is specifically designed to automate your trading strategy during key macroeconomic releases, ensuring you never miss an opportunity.  When important indicators are announced, volatility often spikes, creating potential for profit. Our expert
    FREE
    Elevate Your Trading with Advanced Anchored Volume Weighted Average Price Technology Unlock the true power of price action with our premium Anchored VWAP Indicator for MetaTrader 5 - the essential tool for precision entries, strategic exits, and high-probability trend continuation setups. Write me a DM for a 7 day free trial.  Anchored VWAP Plus gives traders unprecedented control by allowing custom anchor points for Volume Weighted Average Price calculations on any chart. With support for 4 sim
    FREE
    The Volume Weighted ATR indicator is a helpful tool for measuring market activity. It is based on the idea of the Volume-Weighted ATR. Combining these two elements helps identify potential turning points or breakout opportunities. The indicator for the classification of the activity of the market uses the moving average and its multiples. Accordingly, where the VWATR bar is located (relative to the moving average), it is labelled as ultra-low, low, average, high, very high or ultra high. The Vo
    FREE
    Follow The Line MT5
    Oliver Gideon Amofa Appiah
    4.6 (35)
    This indicator obeys the popular maxim that: "THE TREND IS YOUR FRIEND" It paints a GREEN line for BUY and also paints a RED line for SELL. (you can change the colors). It gives alarms and alerts of all kinds. IT DOES NOT REPAINT and can be used for all currency pairs and timeframes. Yes, as easy and simple as that. Even a newbie can use it to make great and reliable trades. NB: For best results, get my other premium indicators for more powerful and reliable signals. Get them here: https://www.m
    FREE
    Friend of the Trend: Your Trend Tracker Master the market with Friend of the Trend , the indicator that simplifies trend analysis and helps you identify the best moments to buy, sell, or wait. With an intuitive and visually striking design, Friend of the Trend analyzes price movements and delivers signals through a colorful histogram: Green Bars : Signal an uptrend, indicating buying opportunities. Red Bars : Alert to a downtrend, suggesting potential selling points. Orange Bars : Represent cons
    FREE
    Overview Market Volume Profile Modes is a powerful MT5 volume distribution indicator that integrates multiple Volume Profile variants. Users can switch between different analysis modes through a simple menu selection. This indicator helps traders identify key price levels, support and resistance zones, and market volume distribution. Core Concepts • POC (Point of Control): The price level with the highest volume concentration, representing the market's accepted "fair value" area • VAH (Value A
    FREE
    Master Edition, piyasa yapısını hacim ve para akışı merceğinden görselleştirmek için tasarlanmış profesyonel kalitede bir analiz aracıdır. Standart hacim göstergelerinin aksine, bu araç doğrudan grafiğinizde bir Günlük Hacim Profili görüntüleyerek, fiyat keşfinin tam olarak nerede gerçekleştiğini ve "akıllı paranın" nerede konumlandığını görmenizi sağlar. Bu Master Edition, netlik ve hız için tasarlanmıştır ve yüklendiğinde grafik düzeninizi anında güzelleştiren benzersiz bir Otomatik Tema Senkr
    Ideal for scalpers, day traders and swing trades. Automatically identifies key support and resistance levels based on historical price data. It displays real-time trading zones and a precise countdown timer for each candle, helping traders make faster and more confident decisions. Fully customizable for multiple timeframes and instruments. The indicator analyzes historical price data to draw horizontal levels that represent key trading areas. It also displays, in real time, the current zone whe
    FREE
    VWAP_PC_MQL5 — MT5 üzerinde hacim ağırlıklı ortalama fiyatı (VWAP) gösteren basit, el yapımı bir gösterge. TF: Tüm zaman dilimlerinde çalışır. Parite: Forex, endeks, emtia ve hisse senetleriyle uyumlu. Ayarlar: AppliedPrice – hesaplama için kullanılan fiyat türü LineColor / Width / Style – çizgi görünümü SessionReset – günlük sıfırlama veya sürekli mod Çalışma prensibi (VWAP): VWAP (Volume Weighted Average Price) = (Fiyat × Hacim toplamı) / (Hacim toplamı) Fiyat VWAP’ın üzerindeyse alıcılar b
    FREE
    Simple QM Pattern MT5
    Suvashish Halder
    3.33 (3)
    Simple QM Pattern   is a powerful and intuitive trading indicator designed to simplify the identification of the Quasimodo (QM) trading pattern. The QM pattern is widely recognized among traders for effectively signaling potential   reversals   by highlighting key market structures and price action formations. This indicator helps traders easily visualize the QM pattern directly on their charts, making it straightforward even for those who are new to pattern trading. Simple QM Pattern includes d
    FREE
    High Low Open Close
    Alexandre Borela
    4.98 (44)
    Bu projeyi seviyorsanız, 5 yıldız incelemesi bırakın. Bu gösterge açık, yüksek, düşük ve belirtilen fiyatlar için çizer Dönem ve belirli bir zaman bölgesi için ayarlanabilir. Bunlar birçok kurumsal ve profesyonel tarafından görünen önemli seviyelerdir. tüccarlar ve daha fazla olabileceği yerleri bilmeniz için yararlı olabilir Aktif. Mevcut dönemler şunlardır: Önceki gün. Önceki Hafta. Önceki Ay. Previous Quarter. Önceki yıl. Veya: Mevcut gün. Hafta. Şimdi Ay. Şimdiki Mahallesi. Bugün yıl.
    FREE
    Order Book, known also as Market Book, market depth, Level 2, - is a dynamically updated table with current volumes of orders to buy and to sell specific financial instument at price levels near Bid and Ask. MetaTrader 5 provides the means for receiving market book from your broker in real time. The expert OrderBook Recorder records market book changes and stores them in local files for further usage in indicators and expert adviser, including testing in the tester. The expert stores market book
    FREE
    Bu ürünün alıcıları ayrıca şunları da satın alıyor
    Neuro Poseidon MT5
    Daria Rezueva
    4.8 (54)
    Neuro Poseidon is a new indicator by Daria Rezueva. It combines precise trading signals with adaptive TP/SL levels - creating best possible trades as a result! Message me and get  Neuro Poseidon Assistant  as a gift to automize your trading process! What makes it stand out? 1. Proven profitability on all assets and timeframes 2. Only confirmed BUY and SELL signals present on the chart 3. Adaptive TP & SL levels generated by the software for each trade 4. Easy to understand - suitable for al
    M1 Quantum MT5
    Hamed Dehgani
    5 (5)
    M1 Quantum ile Canlı İşlem Sinyalleri : Sinyal Fiyat Planı: Güncel Fiyat: $149 (Erken kullanıcı teklifi) Bir sonraki planlanan fiyat: $169 Planlanan perakende fiyatı: $299 Geliştirici Notu: Satın alma işleminden sonra benimle iletişime geçerek en güncel önerilen ayar dosyasını (Set File) , kullanım tavsiyelerini ve diğer M1 Quantum kullanıcılarıyla iletişim kurabileceğiniz VIP destek grubuna davetiye alabilirsiniz. M1 Quantum , hızlı ve doğru alım-satım sinyalleri sunan, yerleşik Stop Loss, Tak
    Divergence Bomber
    Ihor Otkydach
    4.9 (92)
    Bu göstergeyi satın alan herkese aşağıdaki ekstra içerikler ücretsiz olarak sunulmaktadır: Her işlemi otomatik olarak yöneten, Stop Loss ve Take Profit seviyelerini ayarlayan ve işlemleri strateji kurallarına göre kapatan özel yardımcı araç: "Bomber Utility" Göstergenin farklı varlıklar üzerinde kullanılmasına yönelik ayar dosyaları (set dosyaları) Bomber Utility için 3 farklı modda kullanım sunan ayar dosyaları: "Minimum Risk", "Dengeli Risk" ve "Bekle-Gör Stratejisi" Bu ticaret stratejisini hı
    UZFX {SSS} Scalping Smart Signals v4.0 MT5, hızlı hareket eden piyasalarda doğru ve gerçek zamanlı sinyaller bekleyen scalperlar, günlük işlemciler ve swing işlemciler için tasarlanmış, yeniden çizilmeyen yüksek performanslı bir işlem göstergesidir. (UZFX-LABS) tarafından geliştirilen bu gösterge, fiyat hareketi analizi, trend teyidi ve akıllı filtrelemeyi bir araya getirerek tüm döviz çiftleri ve zaman dilimlerinde yüksek olasılıklı alım ve satım sinyalleri, Uyarı Sinyalleri ve Trend Devam Fırs
    Göstergemiz, piyasada ilgi gösterilen bölgeleri vurgular ve ardından emir birikim bölgelerini gösterir. Büyük ölçekli bir emir defteri (order book) gibi çalışır. Bu, büyük sermaye için geliştirilmiş bir göstergedir. Performansı olağanüstüdür. Piyasada ne tür bir ilgi olursa olsun, onu görürsünüz . (Bu, tamamen yeniden yazılmış ve otomatikleştirilmiş bir versiyondur – artık manuel analiz gerekmez.) İşlem Hızı (Transaction Speed) , piyasada büyük emirlerin nerede ve ne zaman biriktiğini gösteren v
    Gem SIGNAL
    Shengzu Zhong
    5 (1)
    GEM Signal Pro GEM Signal Pro, MetaTrader 5 için geliştirilmiş bir trend takip göstergesidir ve daha net sinyaller, daha düzenli işlem kurulumları ve daha pratik risk yönetimini doğrudan grafik üzerinde görmek isteyen yatırımcılar için tasarlanmıştır. Sadece basit bir ok göstermek yerine, GEM Signal Pro işlem fikrinin tamamını daha temiz ve daha okunabilir bir şekilde sunmaya yardımcı olur. Koşullar onaylandığında, gösterge giriş fiyatını, stop loss seviyesini ve take profit hedeflerini grafik ü
    Tanıtım       Quantum Breakout PRO   , Breakout Bölgeleri ile ticaret yapma şeklinizi değiştiren çığır açan MQL5 Göstergesi! 13 yılı aşkın ticaret tecrübesine sahip deneyimli tüccarlardan oluşan bir ekip tarafından geliştirilmiştir.       Kuantum Breakout PRO       yenilikçi ve dinamik koparma bölgesi stratejisiyle ticaret yolculuğunuzu yeni zirvelere taşımak için tasarlanmıştır. Kuantum Breakout Göstergesi, size 5 kar hedefi bölgesi ile kırılma bölgelerinde sinyal okları ve kırılma kutusuna da
    ARIPoint
    Temirlan Kdyrkhan
    1 (1)
    ARIPoint is a powerful trading companion designed to generate high-probability entry signals with dynamic TP/SL/DP levels based on volatility. Built-in performance tracking shows win/loss stats, PP1/PP2 hits, and success rates all updated live. Key Features: Buy/Sell signals with adaptive volatility bands Real-time TP/SL/DP levels based on ATR Built-in MA Filter with optional ATR/StdDev volatility Performance stats panel (Success, Profit/Loss, PP1/PP2) Alerts via popup, sound, push, or email Cu
    The Oracle Pro
    Ottaviano De Cicco
    The Oracle Pro: Synthetic Multi-Timeframe Bias Engine for MT5 ️ Summer Launch Offer — Get The Oracle Pro for USD 199 (early buyers). Price rises with traction; final price USD 399. The Oracle Pro is a premium multi-timeframe bias engine for MetaTrader 5, built for demanding and professional traders. It answers one question with discipline: what is the directional bias on each timeframe right now, how strong is it, and how much do the timeframes agree? Everything is computed on closed bars only
    Quantum TrendPulse
    Bogdan Ion Puscasu
    5 (25)
    SuperTrend   ,   RSI   ve   Stochastic'in   gücünü tek bir kapsamlı göstergede birleştirerek işlem potansiyelinizi en üst düzeye çıkaran nihai işlem aracı olan   Quantum TrendPulse'u   tanıtıyoruz. Hassasiyet ve verimlilik arayan yatırımcılar için tasarlanan bu gösterge, piyasa trendlerini, momentum değişimlerini ve en uygun giriş ve çıkış noktalarını güvenle belirlemenize yardımcı olur. Temel Özellikler: SuperTrend Entegrasyonu:   Güncel piyasa trendlerini kolayca takip edin ve karlılık dalgası
    Current event:  https://c.mql5.com/1/326/A2SR2025_NoMusic.gif MT5 için A2SR Gösterge: Otomatik Gerçek Arz ve Talep (S/R). + İşlem Araçları. Product description in English here. --   Guidance   : -- at   https://www.mql5.com/en/blogs/post/734748/page4#comment_16532516 -- and  https://www.mql5.com/en/users/yohana/blog Daha Akıllı İşlem Kararları İçin Güçlü, Gerçek ve Zamandan Tasarruf Sağlayan + EA Uyumlu Nesneler. Temel Avantajlar Önde Gelen Gerçek SR Seviyeleri (Gecikmiyor, Yeniden Boyanmı
    Azimuth Pro
    Ottaviano De Cicco
    5 (7)
    Azimuth Pro V2: Synthetic Fractal Structure and Confirmed Entries for MT5 Overview Azimuth Pro is a multi-level swing structure indicator by Merkava Labs . Four nested swing layers, swing-anchored VWAP, ABC pattern detection, three-timeframe structural filtering, and closed-bar confirmed entries — one chart, one workflow from micro-swings to macro-cycles. This is not a blind signal product. It is a structure-first workflow for traders who care about location, context, and timing. ️ Summer Sale
    Btmm state engine pro
    Garry James Goodchild
    5 (5)
    BTMM State Engine Pro is a MetaTrader 5 indicator for traders who use the Beat The Market Maker approach: Asian session context, kill zone timing, level progression, peak formation detection, and a multi-pair scanner from a single chart. It combines cycle state logic with a built-in scanner dashboard so you do not need the same tool on many charts at once. What it does Draws the Asian session range; session times can follow broker server offset or be set in inputs. Tracks level progression (L
    Quant Direction MT5
    Georgios Kalomoiropoulos
    Quant Direction, 3 boyutlu bir piyasa analiz aracıdır. Çeşitli parametrelerdeki yüzdesel sapmaları hassas bir şekilde hesaplayan, tamamen objektif, algoritma tabanlı piyasa analizi sunar. Gelişmiş yapay zeka tabanlı modelleme araçları kullanılarak geliştirilen ve titizlikle test edilen bu algoritma, piyasayı benzersiz bir hassasiyetle analiz eder. Platformda herhangi bir döviz çiftini veya finansal enstrümanı analiz edebilirsiniz. İster kısa vadeli, ister günlük, isterse swing trading yapın, Qua
    Trend Forecaster
    Alexey Minkov
    5 (8)
    Trend Forecaster is a MetaTrader 5 indicator that combines breakout signals, possible reversal area analysis, market range data and a visual statistics panel in one chart workspace. It shows Buy and Sell signals, tracks Average Range and Current Range, and can automatically adjust Sensitivity for the current symbol and timeframe. Manual Sensitivity control is also available. The indicator can be used on Forex pairs, metals, stocks, indices and cryptocurrencies. Different timeframes are supported
    KURAMA GOLD SIGNAL PRO (MT5) — 7 Katmanlı Filtre, Otomatik TP/SL, Kalite Puanı ve Sinyal Geçmişi Kaydı | Eksiksiz XAUUSD Ticaret Sistemi Gerçek zamanlı olarak yeniden çizmez. Bir sinyal belirdiği anda ok, giriş, TP ve SL anında sabitlenir ve sonradan hareket etmez. Sizin işlem yaptığınız şey bu gerçek zamanlı sinyaldir. Ve v7.20'de, gerçekten gönderilen her sinyal otomatik olarak kaydedilir ve yeniden başlatmanın ardından olduğu gibi geri yüklenir. ALICILARA ÖZEL HEDİYE
    CGE Trading Suite
    Carl Gustav Johan Ekstrom
    5 (2)
    Institutional-Grade Analytics for MT5 One indicator. The full analytical edge of a professional trading desk, built into your MT5 chart. CGE Trading Suite unifies everything a serious trader reads in a market — structure, momentum, timing, and capital flow — into one seamless MT5 workspace. 17 integrated modules act as a single system: ICT sessions and killzones, order-block and liquidity mapping, MIDAS volume curves, automated trend lines and channels, the Economic Confidence Model, and a live
    Top indicator for MT5   providing accurate signals to enter a trade without repainting! It can be applied to any financial assets:   forex, cryptocurrencies, metals, stocks, indices .  Watch  the video  (6:22) with an example of processing only one signal that paid off the indicator! MT4 version is here It will provide pretty accurate trading signals and tell you when it's best to open a trade and close it. Most traders improve their trading results during the first trading week with the help of
    Bu gösterge, fiyat dönüş noktalarını ve fiyat geri dönüş bölgelerini doğru bir şekilde gösterir.       Başlıca oyuncular   . Yeni trendlerin nerede oluştuğunu görüyorsunuz ve her işlem üzerinde kontrolü elinizde tutarak, azami hassasiyetle kararlar alıyorsunuz. TREND LINES PRO   göstergesiyle birlikte kullanıldığında maksimum potansiyelini ortaya koyar.  VERSION MT4 Göstergenin gösterdiği şey: Yeni bir trendin başlangıcında aktivasyonla birlikte tersine dönüş yapıları ve tersine dönüş seviyeler
    Shock Pullback
    Suleiman Alhawamdah
    5 (1)
    Basitçe söylemek gerekirse, mevcut mum çubuğunun yanında “pip” olarak bilinen beyaz sayıların hareketi görünmeye başladığında işlem yapmaya başlayabilirsiniz. Beyaz “pip”ler, bir alım veya satım işleminin şu anda aktif olduğunu ve beyaz renkleriyle belirtildiği gibi doğru yönde ilerlediğini gösterir. Beyaz pip hareketi durduğunda ve sabit yeşil renge dönüştüğünde, bu mevcut ivmenin sona erdiğini gösterir. Sayıların yeşil rengi, alım veya satım işlemiyle elde edilen toplam kârı “pip” cinsinden t
    Grabber System MT5
    Ihor Otkydach
    4.83 (24)
    Size mükemmel bir teknik gösterge olan Grabber’ı tanıtıyorum. Bu araç, kullanıma hazır bir “her şey dahil” işlem stratejisi olarak çalışır. Tek bir yazılım kodu içinde güçlü piyasa teknik analiz araçları, işlem sinyalleri (oklar), uyarı işlevleri ve push bildirimleri entegre edilmiştir. Bu göstergeyi satın alan herkes aşağıdaki hediyeleri ücretsiz olarak alır: Açık emirleri otomatik yönetmek için Grabber Yardımcı Aracı Kurulum, yapılandırma ve nasıl işlem yapılacağını adım adım anlatan video kıl
    Backtesting Simulator MT5
    Diego Arribas Lopez
    4 (1)
    [ MT4 Version ] Are you tired of spending months on demo or live accounts to test your trading strategies? The Backtesting Simulator is the ultimate tool designed to elevate your backtesting experience to new heights. Utilizing Metatrader historical symbol information, it offers an unparalleled simulation of real market conditions. Take control of your testing speed, test ideas quickly or at a slower pace, and witness remarkable improvements in your testing performance. Forget about wasting tim
    Price & Time Market Structure Indicator A professional market structure tool that analyzes waves through both price and time — not price alone. Main Description NeoWave PRO   is a professional market structure indicator for MetaTrader 4 designed for traders who want to move beyond traditional one-dimensional wave tools such as ZigZag, swing indicators, and basic high/low systems. Most wave indicators analyze only one thing: Price. But a real market wave is not only a price movement. A true wave
    Weltrade Spike Sentinel
    Batsirayi L Marango
    5 (1)
    Introducing Indicator for PainX and GainX Indices Traders on Weltrade Get ready to experience the power of trading with our indicator, specifically designed for Weltrade   broker's PainX and GainX Indices.  Advanced Strategies for Unbeatable Insights Our indicator employs sophisticated strategies to analyze market trends, pinpointing optimal entry and exit points.  Optimized for Maximum Performance To ensure optimal results, our indicator is carefully calibrated for 5-minute timeframe charts on
    RelicusRoad Pro MT5
    Relicus LLC
    4.96 (24)
    RelicusRoad Pro: Kantitatif Piyasa İşletim Sistemi ÖMÜR BOYU ERİŞİMDE %70 İNDİRİM (SINIRLI SÜRE) - 2.000+ TRADER'A KATILIN Neden çoğu trader "mükemmel" indikatörlere rağmen başarısız olur? Çünkü tekil kavramları boşlukta trade ederler. Bağlamı olmayan bir sinyal kumardır. Sürekli kazanmak için KONFLÜANS (UYUM) gerekir. RelicusRoad Pro basit bir ok indikatörü değildir. Tam bir Kantitatif Piyasa Ekosistemi dir. Tescilli volatilite modellemesini kullanarak fiyatın ilerlediği "Adil Değer Yolu"nu har
    Meravith MT5
    Ivan Stefanov
    5 (1)
    Göstergе, herhangi bir noktadan hacmi analiz eder ve bu hacim için piyasanın tükeniş seviyelerini hesaplar. Meravith’in ana çizgileri: Boğa hacim tükeniş çizgisi – hedef olarak kullanılır. Ayı hacim tükeniş çizgisi – hedef olarak kullanılır. Trend çizgisi – piyasa trendini gösterir. Piyasanın boğa mı ayı mı olduğuna bağlı olarak rengi değişir ve trend desteği görevi görür. Nasıl kullanılır: Mor dikey çizgiye çift tıklayın ve istediğiniz konuma taşıyın. Her şeyi analiz edebilirsiniz – trendleri v
    PrimeScalping
    Temirlan Kdyrkhan
    PrimeScalping is a powerful trading companion designed to generate high-probability entry signals with dynamic TP/SL/DP levels based on volatility. Built-in performance tracking shows win/loss stats, PP1/PP2 hits, and success rates — all updated live. Key Features: Buy/Sell signals with adaptive volatility bands Real-time TP/SL/DP levels based on ATR Built-in MA Filter with optional ATR/StdDev volatility Performance stats panel (Success, Profit/Loss, PP1/PP2) Alerts via popup, sound, push, or e
    Royal Wave Pro M5
    Vahidreza Heidar Gholami
    3.5 (4)
    Royal Wave is a Trend-Power oscillator which has been programmed to locate and signal low-risk entry and exit zones. Its core algorithm statistically analyzes the market and generates trading signals for overbought, oversold and low volatile areas. By using a well-designed alerting system, this indicator makes it easier to make proper decisions regarding where to enter and where to exit trades. Features Trend-Power Algorithm Low risk Entry Zones and Exit Zones Predictions for Overbought and Over
    Presenting one-of-a-kind Gann Indicator for XAUUSD IQ Gold Gann Levels is a non-repainting, precision tool designed exclusively for XAUUSD intraday trading. It uses W.D. Gann’s square root method to plot real-time support and resistance levels, helping traders spot high-probability entries with confidence and clarity. William Delbert Gann (W.D. Gann) was an exceptional market analyst whose trading technique was based on a complex blend of mathematics, geometry, astrology, and ancient calculation
    OmniSync Projection
    Antonio-alin Teculescu
    5 (1)
    Chronos Fractal Engine is an innovative price projection indicator for MetaTrader 5, designed to transform your technical analysis by intelligently identifying and projecting historical price patterns. Built upon an advanced correlation algorithm and the fractal principles of the market, this powerful tool visualizes potential future price movements, giving you a unique edge in your trading decisions. What is Chronos Fractal Engine? At its core, the Chronos Fractal Engine employs a sophisticat
    Yazarın diğer ürünleri
    Session Box Indicator for MetaTrader 5 IMPORTANT NOTE: **A new input parameter ( Skip weekends  )  has been introduced which must be set to false for markets opened 24/7** Version 1.00 Release Version 1.01 Complete code rewrite Version 1.02 Fix: added missing font name and removed emoji as session name, added label positioning Version 1.03 Fix: proper weekend handling, complete minute support for all sessions, independent label position Description: The SessionBox indicator is designed to visu
    FREE
    HTF Power of Three (ICT) -  MT4 Indicator - Version 1.1 Overview The   HTF Power of Three   indicator is a professional implementation of the Inner Circle Trader's (ICT) Power of Three concept, inspired by Larry Williams. This indicator visualizes higher timeframe (HTF) candle development in real-time on any lower timeframe chart, making it an essential tool for ICT traders who study institutional price movement patterns. What is Power of Three (PO3)? Power of Three represents a three-staged Sma
    Session Box Indicator for MetaTrader 4 IMPORTANT NOTE: **A new input parameter ( Skip weekends  )  has been introduced which must be set to false for markets opened 24/7** Version 1.00 Release Version 1.01 Complete code rewrite Version 1.02 Fix: added missing font name and removed emoji as session name, added label positioning Version 1.03 Fix: proper weekend handling, complete minute support for all sessions, independent label position Description: The SessionBox indicator is designed to visu
    Range Bar Pro
    Antonio Molinaro
    Range Bar Pro Indicator for MetaTrader 5 Visualize market trends, levels and other features with Range Bar Pro, an innovative indicator that draws a unique, standalone candle on the right side of any MT5 chart. This single candle is generated from an analysis of price over a specified range, providing you with a powerful snapshot of the market. Key Features: Single-Candle Visualization: Gain quick insights with a single, specially derived candle that reflects comprehensive price movement over a
    ADX-Based Candle Color Indicator for MT5 Description:   Enhance your trading experience with the ADX-Based Candle Color Indicator for MT5! This powerful tool colors candlesticks based on the Average Directional Index (ADX) indicator, helping you quickly assess market strength and direction at a glance. Key Features:   - Color-Coded Candles:     - Green (Bullish) when D+ > D-.     - Red (Bearish) when D- > D+.   - Intensity Mapping:       The color intensity reflects the ADX value—stronger col
    HTF Power of Three ICT
    Antonio Molinaro
    5 (2)
    HTF Power of Three (ICT) -  MT5 Indicator - Version 1.1 Overview The HTF Power of Three indicator is a professional implementation of the Inner Circle Trader's (ICT) Power of Three concept, inspired by Larry Williams. This indicator visualizes higher timeframe (HTF) candle development in real-time on any lower timeframe chart, making it an essential tool for ICT traders who study institutional price movement patterns. What is Power of Three (PO3)? Power of Three represents a three-staged Smart M
    In trading, the Master Pattern (sometimes called the market master pattern ) is a conceptual framework describing how price typically moves as capital flows through markets. It is not a rule-set, but a recurring structural sequence driven by institutional behaviour, liquidity, and crowd psychology. Different trading schools describe it with different names, but the underlying logic is largely the same. Core Idea Markets tend to move through a repeating cycle: Accumulation → Expansion → Distribut
    Filtrele:
    Değerlendirme yok
    Değerlendirmeye yanıt