PivotMaster Pro

PivotMaster Pro – The Ultimate Multi-Level Pivot Indicator

Overview
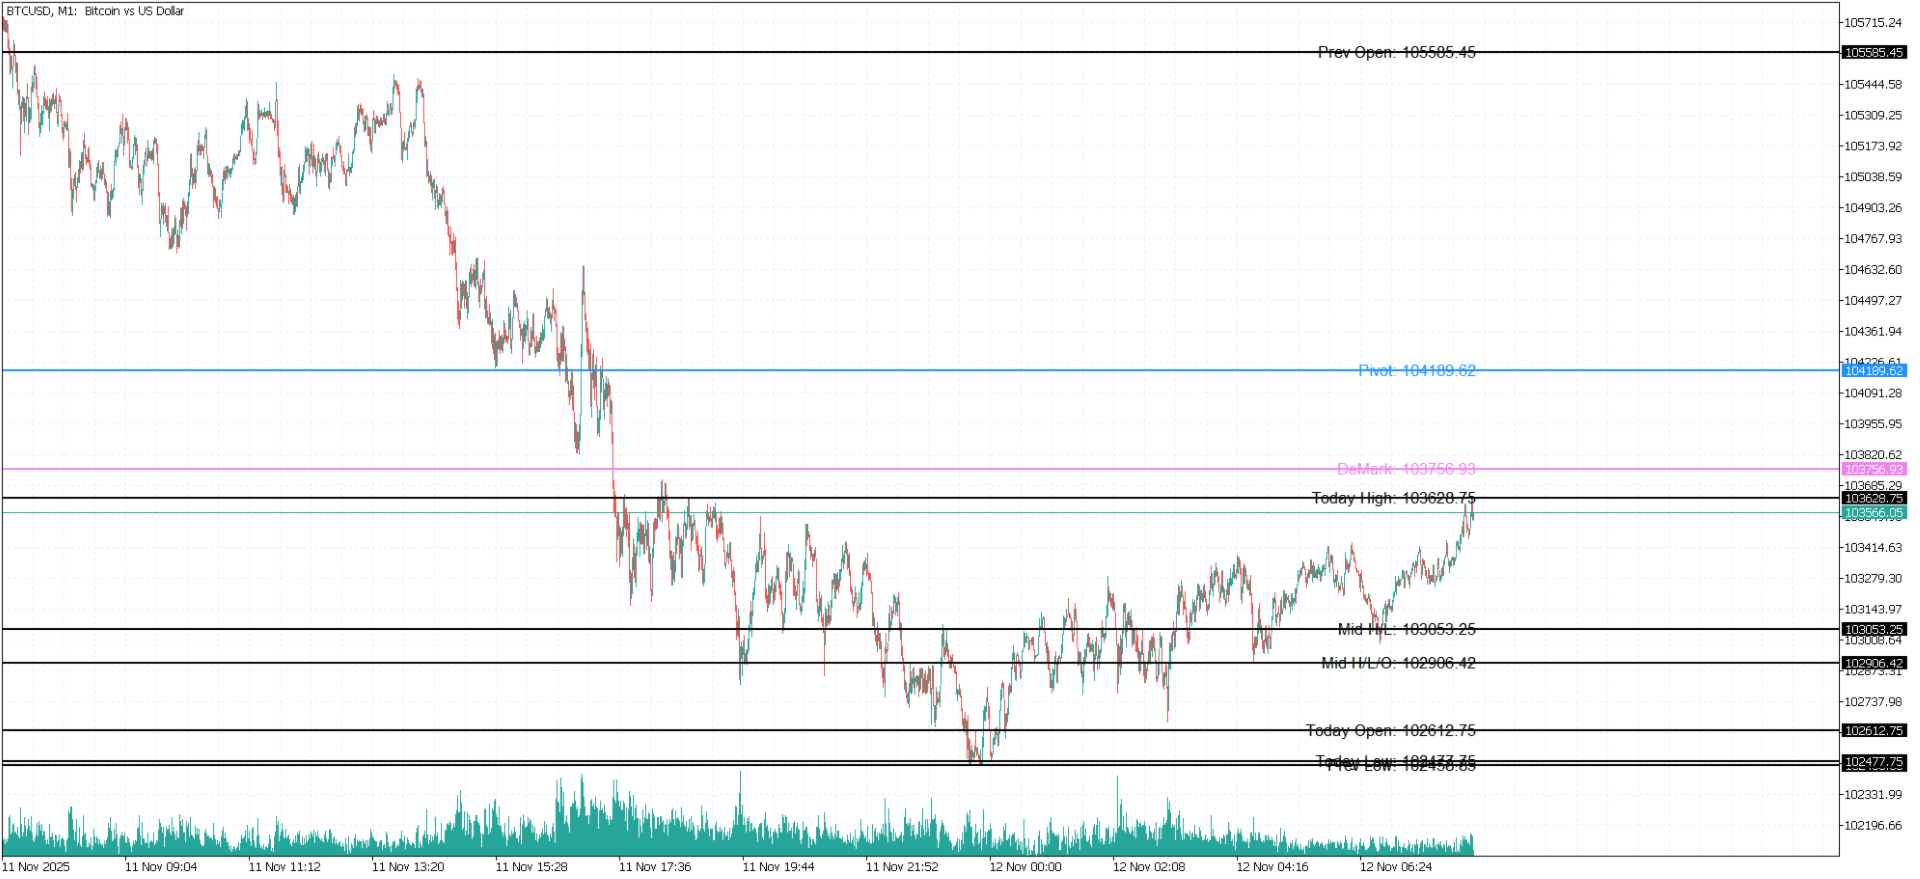
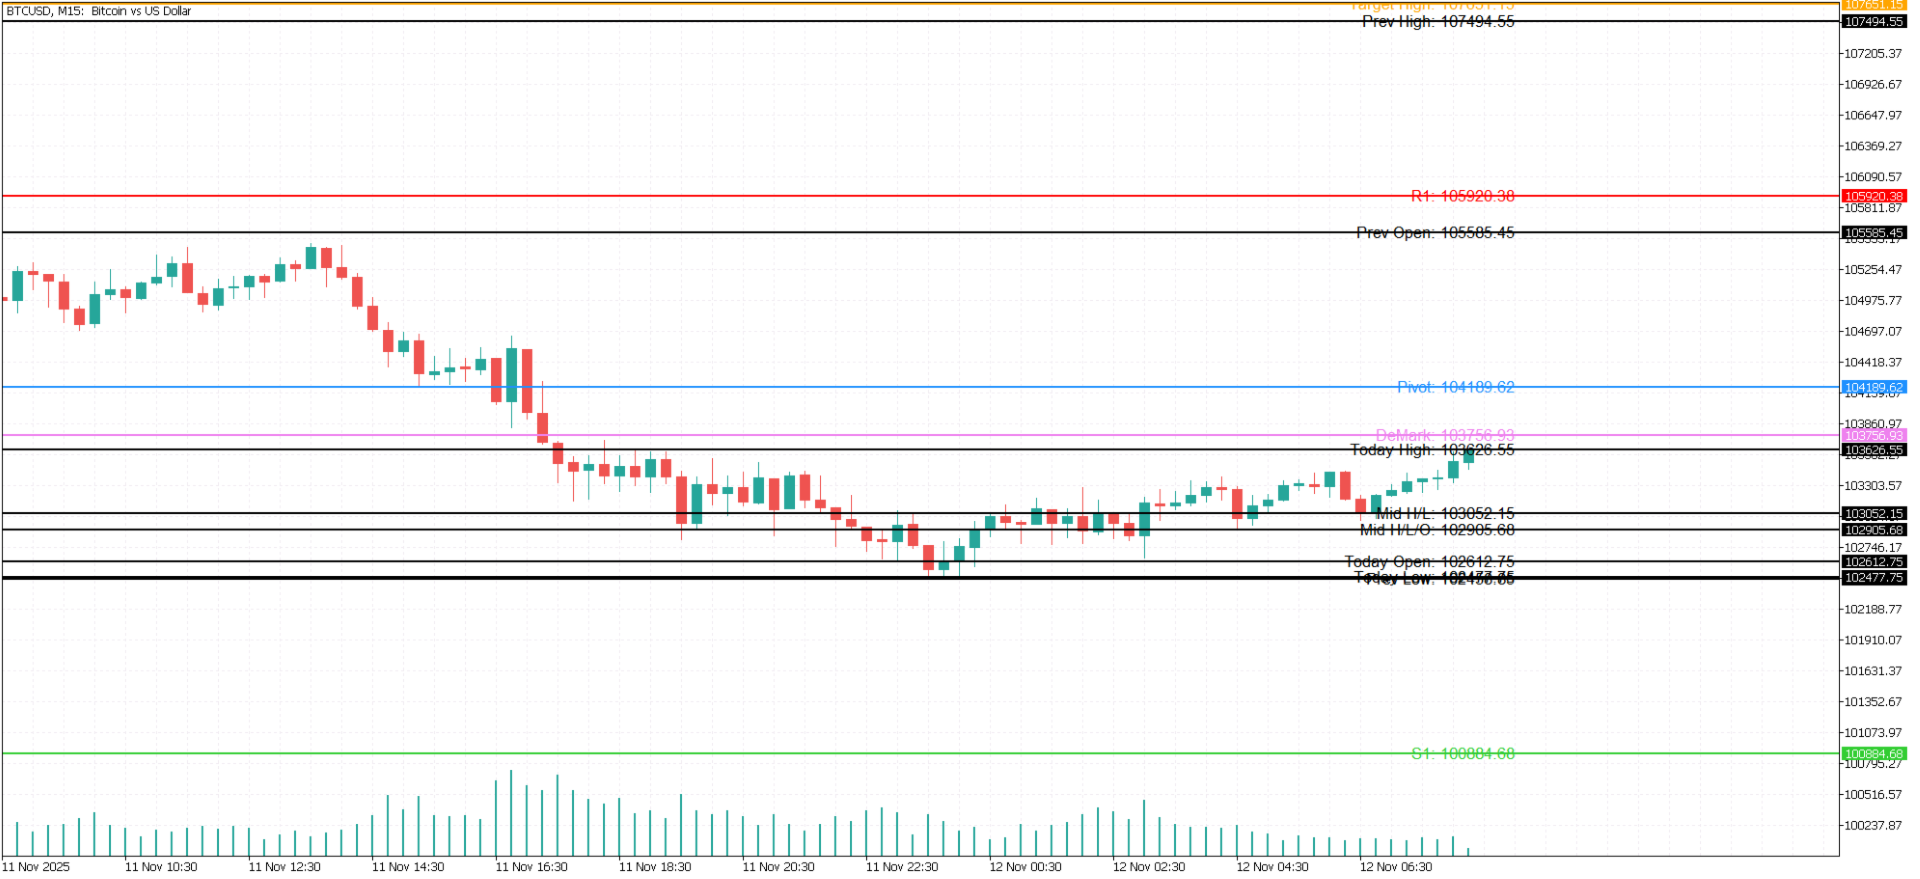
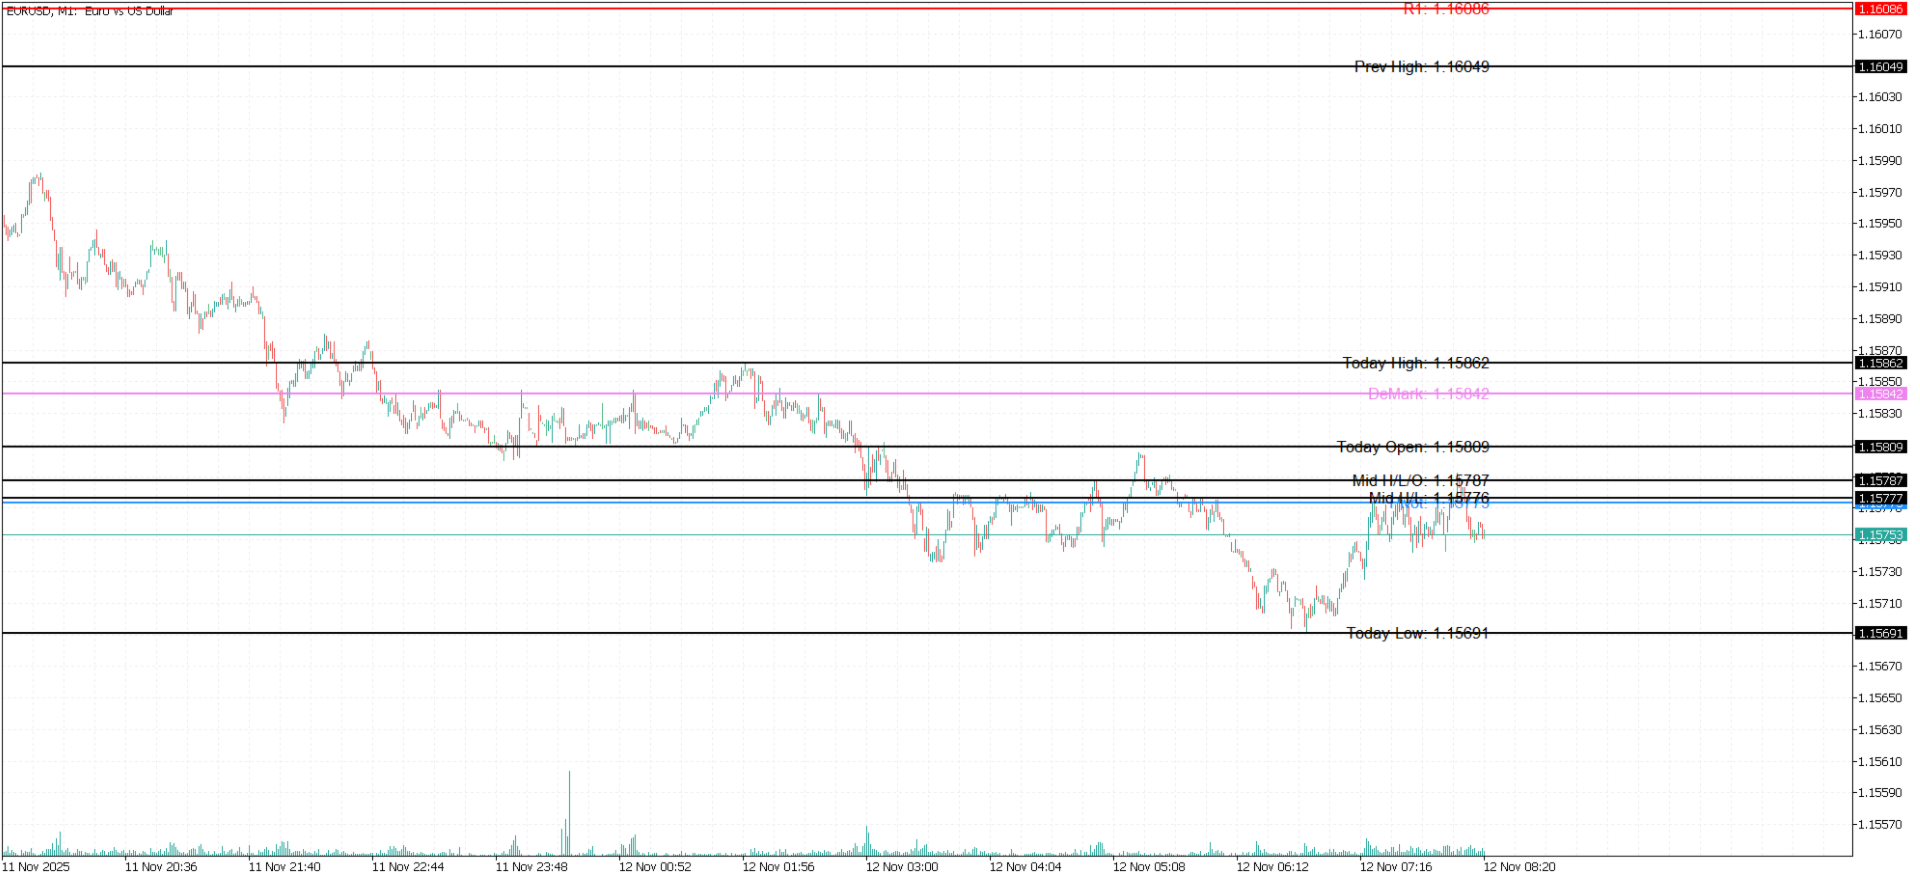
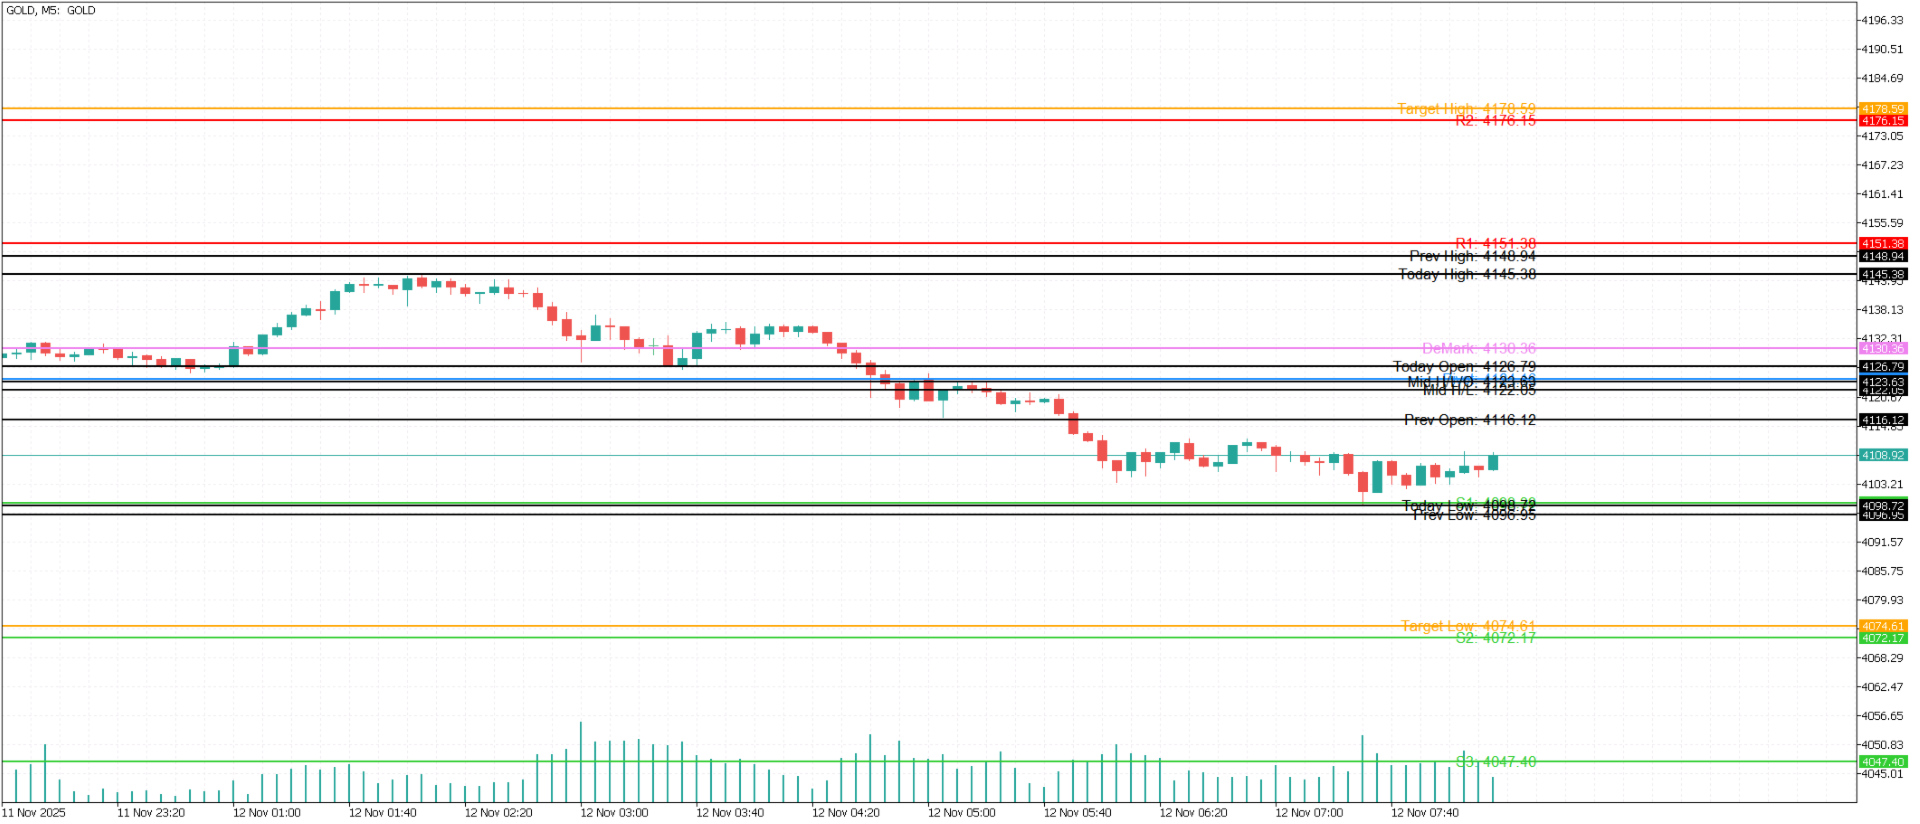
PivotMaster Pro is a professional-grade pivot indicator designed for traders who rely on precision and clarity. It automatically plots Classic Pivots and DeMark Pivots, along with previous day’s Open, High, Low and current day’s Open, giving you a complete view of market structure at a glance.

Key Features

  • Displays both Classic Pivot Points and DeMark Pivot Lines

  • Shows Previous Day OHLC and Current Day Open levels

  • Works on any timeframe and any instrument

  • Clean, optimized visual layout for intraday and swing traders

  • Ideal for identifying support/resistance zones and trend shifts

Use Cases
Perfect for scalpers, day traders, and swing traders who want to see all major price levels in one clean view.


Önerilen ürünler
Nadaraya-Watson Envelope Indicator convert to MT5 Nadaraya Watson Envelope Indicator is one of the monst popular indicator in TradingView. TradingView(Chrome, Edge) eats a huge of CPU, so I convert this to MT5 version. As you can see the screenshot, it's good with Schaff trend RSI Indicator (or others) If you want to get Schaff trend RSI Indicator , Link:  https://www.mql5.com/en/market/product/98011 Window Size - determines the window size for calculating smoothed values. A larger window siz
Engulfing with EMAs Indicator Unlock the power of advanced candlestick pattern detection with the Engulfing with EMAs Indicator , a cutting-edge tool designed for MetaTrader 5. This futuristic indicator combines the precision of engulfing pattern analysis with the trend-following strength of Exponential Moving Averages (EMA 21 and EMA 50), empowering traders to identify high-probability setups across all currency pairs and timeframes. Key Features: Comprehensive Engulfing Detection : Detects b
"Cherry Picker" EA'yı tanıtıyoruz: Ticaretinizi daha da tatlı hale getirin! Nasıl ki bir pastanın üzerindeki en olgun kirazları seçiyorsanız, Cherry Picker EA da MT5 piyasasındaki en tatlı ticaret fırsatlarını seçer. Bu yenilikçi EA, karmaşık piyasa koşullarında bile yüksek olasılıklı giriş noktalarını kesin bir şekilde belirleyerek kazancınızı maksimize eder. Sonuçların nasıl elde edildiği belirsiz olan sinir ağları veya ChatGPT gibi "kara kutu" EA'ların aksine, Cherry Picker EA şeffaftır. Yüks
Introduction Harmonic Patterns are best used to predict potential turning point. Traditionally, Harmonic Pattern was identified manually connecting peaks and troughs points in the chart. Manual harmonic pattern detection is painfully tedious and not suitable for everyone. You are often exposed under subjective pattern identification with manual pattern detection. To avoid these limitations, Harmonic Pattern Plus was designed to automate your harmonic pattern detection process. The functionality
Devrim niteliğindeki MT5 göstergesi ile tanışın, DARWIN Assistant   - başarılı ticaret dünyasına açılan nihai kapınız! Hassasiyet ve uzmanlıkla tasarlanan DARWIN Assistant   , tüm zaman dilimlerinde gelişmiş teknik göstergelerin (RSI, Stokastik, CCI ve Trendler) gücünden yararlanan özel bir strateji üzerinde çalışır. Bu son teknoloji gösterge size giriş için en doğru sinyalleri sunarak, piyasalarda benzersiz bir güvenle gezinmenizi sağladığından, olağanüstü bir ticaret deneyimi için kendinizi d
EFW Pattern Trader is a powerful pattern scanner for Forex and Stock trading. The pattern detection in EFW Pattern Trader uses the Fractal Wave Theory, which captures the endless up and down movement of the market. Therefore, EFW Pattern Trader can be considered as the robust price action indicator. Any patterns in EFW Pattern Trader can be backtested visually in your strategy tester. Visual backtesting with pattern will show you how pattern will likely behave in the live trading. Therefore, you
SBAHiLo
Umri Azkia Zulkarnaen
this is an indicator to clarify seeing Low and High in the market and is very useful for facilitating those who are studying technical price action this is a type of indicator that gives color to the candlestick where the indicator is divided into 3 colors red = bearish green = Bullish Gray = base this indicator can be used on the forex market or the mt5 binary market. https://t.me/SBA_FOREX_SIGNAL
Elliott Wave Trend was designed for the scientific wave counting. This tool focuses to get rid of the vagueness of the classic Elliott Wave Counting using the guideline from the template and pattern approach. In doing so, firstly Elliott Wave Trend offers the template for your wave counting. Secondly, it offers Wave Structural Score to assist to identify accurate wave formation. It offers both impulse wave Structural Score and corrective wave Structure Score. Structural Score is the rating to sh
The Fibonacci series.  This number sequence is formed as each subsequent number is a sum of the previous two. it turns out that it refers to its neighbors in the ratio 0.618 and 1.618 The most commonly used method for measuring and forecasting the length of the price movement is along the last wave, which ended in the opposite direction The Fibonacci Waves indicator could be used by traders to determine areas where they will wish to take profits in the next leg of an Up or Down trend.
Link to our products:  https://www.mql5.com/en/users/alireza.saeedian/seller TradeX candlestick indicator is one of the leading indicators in the market. you can show/hide any pattern with one click or you can change the setting from setting tab. If you don't have any information about candle stick pattern you can watch it from my YouTube channel. This indicator will be updated day by day.
Introducing the River Flow Divergence Indicator Are you ready to unlock your trading potential? Meet the River Flow Divergence Indicator, a powerful tool designed to help you navigate market trends and reversals with precision. This indicator is tailored for traders who are eager to fine-tune their strategies and take control of their success. Note: This indicator is not optimized out of the box. It’s crafted for you to customize and optimize according to your unique trading style and goals. Ho
BTFX Pivot Points
Bradley Thomas Farrington
The BTFX Pivot Points is an indicator which calculates the Support and Resistance levels for each day. By using this indicator the pivot levels point out clear targets to aim for. The resistance levels are shown in purple above the silver pivot line. The support levels are shown in Orange and can be found below the silver pivot line. This indicators works very well when used with The BTFX Daybreak Indicator. For a more in depth explanation of these indicators please watch the Youtube video attac
Mean Reversion Supply Demand Indicator Mean Reversion Supply Demand is the indicator to detect the important supply demand zone in your chart. The concept of supply demand trading relies on the quantity mismatching between buying and selling volumes in the financial market. Typically, supply demand zone serves to predict the turning point. The wave pattern, for any supply demand zone to work as an successful trade, looks like the price must touch the base zone, move away and then return to zone
CDC Trend Matrix
Peechanat Chatsermsak
The CDC Trend Matrix is a next-generation indicator that seamlessly combines trend detection with momentum insights, helping you spot optimal entry and exit zones at a glance. Its intuitive “zone” coloring immediately signals Bullish, Bearish, or Sideways market phases, while on-chart alerts keep you informed without cluttering your screen. Highlights Color-coded bars for instant trend zone recognition Clear BUY/SELL labels for precise action points Fully customizable settings to match your ri
This is a custom indicator for MetaTrader 5 named VPC_SupportResistance.mq5 . Here's a breakdown of what it does: Purpose: The indicator aims to automatically draw horizontal Support and Resistance (S/R) levels on the main chart window. Level Calculation Method: It looks back over a user-defined number of bars ( InpPeriod ). It identifies all the high prices and low prices within that period. It sorts these highs and lows. It then selects the highest unique high prices from the period as Resista
RQL_BOX Indicator — English Description (How to Use) What it does RQL_BOX is a manual range box tool controlled by two draggable vertical lines: LEFT handle (v-line): selects a candle on a chosen timeframe and sets the box High/Low to that candle’s wicks . RIGHT handle (v-line): defines how far to extend the box to the right (projection end). It then draws: the main box (range), optional top/bottom 20% zones , an optional 50% midpoint line , and an on-chart info panel with key metrics. How to us
FREE
FiboChampion
Marius Ovidiu Sunzuiana
The Next Evolution in Fibonacci Intelligence FiboChampion  isn’t just another Fibonacci tool—it’s a paradigm shift in how traders interpret price action. Engineered for precision and adaptability, this advanced indicator fuses quantum-inspired logic , machine-learned pattern recognition , and non-linear Fibonacci geometry to uncover market turning points with uncanny accuracy. What Sets FiboChampion Apart: Non-Linear Fibonacci Mapping : Goes beyond static retracements by adapting to fractal m
N/B: All our product purchase comes with our free ‘’DAILY   SCALPER EA’’ -   bit.ly/4qlFLNh Whatsapp Developer for yours after successful purchase ORDERBLOCK PRECISION BUYSELL SCANNER INDICATOR The Ultimate Institutional-Grade Trading Tool That Reveals What Professional Traders See ---   WHY THIS IS THE MOST POWERFUL TOOL YOU'LL EVER OWN FORGET about complicated indicators that give mixed signals. STOP wasting hours analyzing charts manually. ELIMINATE the guesswork from your trading dec
The Envelopes indicator determines the presence of a trend or flat. It has 3 types of signals, shows the probable retracement levels and levels of the possible targets. The Fibonacci coefficients are used in the indicator's calculations. Signals   (generated when touching the lines or rebounding from lines): Trend   - the middle line of the Envelopes has a distinct inclination; the lines below the channel's middle line are used for buy trades, the lines above the middle line and the middle line
PivotePoint MT5
Kambiz Shahriarynasab
Unlike many other indicators including the moving average indicator, Pivot Point can be a leading indicator. In these systems, the price levels of the previous period are used to determine the critical points instead of relying on the current price performance. Such an approach provides a clear framework for traders to plan their trades in the best possible way. You can use this method and its combination with the methods you want to build and use a powerful trading setup. MT4 version Let us kno
Introduction to Harmonic Pattern Scenario Planner The present state of Forex market can go through many different possible price paths to reach its future destination. Future is dynamic. Therefore, planning your trade with possible future scenario is an important step for your success. To meet such a powerful concept, we introduce the Harmonic Pattern Scenario Planner, the first predictive Harmonic Pattern Tool in the world among its kind. Main Features Predicting future patterns for scenario
Genel Bakış Multi Level ATR ve Hareketli Ortalama Bandı göstergesi, fiyat hareketlerini volatiliteyi göz önünde bulundurarak kapsamlı bir analiz sunar. Çeşitli bantlar aracılığıyla görsel temsil, trend ve konsolidasyon aşamalarını, ayrıca potansiyel tersine dönme noktalarını belirlemeyi kolaylaştırır. Özelleştirme seçenekleri sayesinde kullanıcılar, göstergeleri ticaret ihtiyaçlarına göre uyarlayabilirler. Özellikler Birden Fazla Bant Görselleştirmesi: Fiyat seviyeleri, yüksek, orta ve düşük değ
FREE
INDICATOR: GEN Support and Resistance Pro Developer: gedeegi General Description GEN Support and Resistance Pro is a technical indicator for MetaTrader that automatically identifies support and resistance (S&R) levels using price pivot logic. It supports multi-timeframe analysis and includes a trend momentum detection system that helps traders understand current market bias with additional visual and alert tools. Main Features Automatic S&R Detection: Identifies key support and resistance levels
Enhanced Bull-Bear Power Indicator Description The Enhanced Bull-Bear Power Indicator is a custom technical analysis tool designed for MetaTrader 5. It provides a visual representation of the relative strength between bullish and bearish market forces over a user-defined period. By calculating the average percentage change for bullish and bearish bars, the indicator computes a strength ratio that helps traders identify prevailing market sentiment. Features User-adjustable period for calculatio
Peak Trough Analysis is the great tool to detect peaks and troughs in your chart. Peak Trough Analysis tool can use three different peaks and troughs detection algorithm. The three algorithm include the orignal Fractals Indicator by Bill Williams, the Modified Fractals indicator and ZigZag indicator. You can use this peak and trough analysis tool to detect the price pattern made up from Equilibrium Fractal-Wave process. For further usage, there are good guide line on how to use this peak trough
FREE
This indicator watch the Fibonacci retracement for levels and timeframes selected by the trader. In the workload of day trading, having your eyes on all the timeframes to validate some information, for Fibonacci traders, is really time consuming and requires constant focus.  With this in mind, this tool allows you to have your attention on other trading details while this one monitors the retracements of each timeframe in real time. In the charts, this indicator data (retracement %, age of the r
Introduction to Support Resistance Indicator Support and Resistance are the important price levels to watch out during intraday market. These price levels are often tested before development of new trend or often stop the existing trend causing trend reversal at this point. Highly precise support and resistance are indispensable for experienced traders. Many typical trading strategies like breakout or trend reversal can be played well around these support and resistance levels. The Precision Sup
BREAK RETEST NON-REPAINT. WORKS BEST AT M15 AND ABOVE.  Benefits Fewer false breakouts . Combining close confirmation + retest + previous-close filter greatly reduces noise vs. raw high/low breaks. Tighter execution plans . The drawn level line gives an objective spot for entries, stop placement (just beyond the level), and partial-take-profit structure. Non-repainting confidence . Signals are placed on current bar. Flexible across markets . Works on FX, indices, metals, crypto; scalping on M15
PFractals
Kambiz Shahriarynasab
This indicator is based on the same famous fractal indicator with a slight difference: MetaTrader version 4 click here Advantages:      Works on all instruments and time series,      Does not redraw its results,      Comparison depth is adjustable,      Works well with any popular strategy,      Adjust the power of fractals Input settings:      Number of comparisons - The number of candles that each side selects for comparison.      Marker distance from the candlestick You can contact us v
TransitBlueOcean
Bonginkosi Innocent Khumalo
5 (1)
TransitBlueOcean is indicator system that uses ocean wave's pattern, to help one to know when to buy and when to sell. The indicator system is very powerful like the ocean waves. Join the mql5 channel for TransitBlueOcean  https://www.mql5.com/en/channels/transitblueocean   How to use: Zoom in so that the Ocean will appear on your chart. Buy when you see the candles, the candle will be above the ocean wave (buying signal). Sell when you can't see the candles, the candles will be inside the wav
Bu ürünün alıcıları ayrıca şunları da satın alıyor
Bu indikatörü satın alırsanız, Profesyonel Trade Manager’ımı  + EA ÜCRETSİZ olarak alacaksınız. Öncelikle, bu Ticaret Sistemi'nin Non-Repainting, Non-Redrawing ve Non-Lagging Göstergesi olduğunu vurgulamak önemlidir, bu da hem manuel hem de robot ticareti için ideal hale getirir. Online kurs, kılavuz ve ön ayarları indir. "Smart Trend Trading System MT5", yeni ve deneyimli tüccarlar için özelleştirilmiş kapsamlı bir ticaret çözümüdür. 10'dan fazla premium göstergeyi birleştiriyor ve 7'den fazla
SuperScalp Pro
Van Minh Nguyen
5 (6)
SuperScalp Pro – Gelişmiş Çoklu Filtreli Scalping Gösterge Sistemi SuperScalp Pro, klasik Supertrend ile çok sayıda akıllı onay filtresini birleştiren gelişmiş bir scalping gösterge sistemidir. Gösterge M1’den H4’e kadar tüm zaman dilimlerinde verimli çalışır ve özellikle XAUUSD, BTCUSD ve ana Forex pariteleri için uygundur. Bağımsız bir sistem olarak kullanılabilir veya mevcut ticaret stratejilerine esnek şekilde entegre edilebilir. Gösterge, hız ve yavaş EMA’lar, trend belirleyen üç EMA, EMA e
Divergence Bomber
Ihor Otkydach
4.89 (82)
Bu göstergeyi satın alan herkese aşağıdaki ekstra içerikler ücretsiz olarak sunulmaktadır: Her işlemi otomatik olarak yöneten, Stop Loss ve Take Profit seviyelerini ayarlayan ve işlemleri strateji kurallarına göre kapatan özel yardımcı araç: "Bomber Utility" Göstergenin farklı varlıklar üzerinde kullanılmasına yönelik ayar dosyaları (set dosyaları) Bomber Utility için 3 farklı modda kullanım sunan ayar dosyaları: "Minimum Risk", "Dengeli Risk" ve "Bekle-Gör Stratejisi" Bu ticaret stratejisini hı
FX Trend MT5 NG
Daniel Stein
5 (4)
FX Trend NG: Yeni Nesil Çoklu Piyasa Trend Zekâsı Genel Bakış FX Trend NG , çoklu zaman dilimlerinde çalışan profesyonel bir trend analiz ve piyasa izleme aracıdır. Piyasanın yapısını saniyeler içinde anlamanızı sağlar. Birden fazla grafik arasında geçiş yapmak yerine, hangi enstrümanların trendde olduğunu, momentumun nerede zayıfladığını ve hangi zaman dilimlerinin uyumlu olduğunu anında görebilirsiniz. Lansman Teklifi – FX Trend NG sadece $30 (6 Ay) veya $80 Ömür Boyu Lisans ile edinin. Zate
Entry In The Zone and SMC Multi Timeframe is a real-time market analysis tool developed based on Smart Money Concepts (SMC). It is designed to analyze market structure, price direction, reversal points, and key zones across multiple timeframes in a systematic way. The system displays Points of Interest (POI) and real-time No Repaint signals, with instant alerts when price reaches key zones or when signals occur within those zones. It functions as both an Indicator and a Signal System (2-in-1), c
ARIPoint
Temirlan Kdyrkhan
ARIPoint is a powerful trading companion designed to generate high-probability entry signals with dynamic TP/SL/DP levels based on volatility. Built-in performance tracking shows win/loss stats, PP1/PP2 hits, and success rates all updated live. Key Features: Buy/Sell signals with adaptive volatility bands Real-time TP/SL/DP levels based on ATR Built-in MA Filter with optional ATR/StdDev volatility Performance stats panel (Success, Profit/Loss, PP1/PP2) Alerts via popup, sound, push, or email Cu
Azimuth Pro
Ottaviano De Cicco
5 (4)
LAUNCH PROMO Azimuth Pro price is initially set at 299$ for the first 100 buyers. Final price will be 499$ . THE DIFFERENCE BETWEEN RETAIL AND INSTITUTIONAL ENTRIES ISN'T THE INDICATOR — IT'S THE LOCATION. Most traders enter at arbitrary price levels, chasing momentum or reacting to lagging signals. Institutions wait for price to reach structured levels where supply and demand actually shift. Azimuth Pro maps these levels automatically: swing-anchored VWAP, multi-timeframe structure lines, an
FX Power MT5 NG
Daniel Stein
5 (31)
FX Power: Daha Akıllı Ticaret Kararları için Para Birimlerinin Gücünü Analiz Edin Genel Bakış FX Power , her piyasa koşulunda başlıca para birimlerinin ve altının gerçek gücünü anlamak için vazgeçilmez bir araçtır. Güçlü para birimlerini alıp zayıf olanları satarak, FX Power ticaret kararlarınızı basitleştirir ve yüksek olasılıklı fırsatları ortaya çıkarır. İster trendlere sadık kalın ister Delta'nın aşırı değerlerini kullanarak tersine dönüşleri öngörün, bu araç ticaret tarzınıza mükemmel bir
Atomic Analyst MT5
Issam Kassas
4.07 (28)
Öncelikle belirtmek gerekir ki bu Ticaret Göstergesi Yeniden Çizim Yapmaz, Gecikmez ve Gecikme Göstermez, bu da hem manuel hem de robot ticareti için ideal hale getirir. Kullanıcı kılavuzu: ayarlar, girişler ve strateji. Atom Analisti, Piyasada Daha İyi Bir Avantaj Bulmak İçin Fiyatın Gücünü ve Momentumunu Kullanan PA Fiyat Hareketi Göstergesidir. Gürültüleri ve Yanlış Sinyalleri Kaldırmaya ve Ticaret Potansiyelini Artırmaya Yardımcı Olan Gelişmiş Filtrelerle Donatılmıştır. Birden fazla katmanl
Top indicator for MT5   providing accurate signals to enter a trade without repainting! It can be applied to any financial assets:   forex, cryptocurrencies, metals, stocks, indices .  Watch  the video  (6:22) with an example of processing only one signal that paid off the indicator! MT4 version is here It will provide pretty accurate trading signals and tell you when it's best to open a trade and close it. Most traders improve their trading results during the first trading week with the help of
Grabber System MT5
Ihor Otkydach
4.82 (22)
Size mükemmel bir teknik gösterge olan Grabber’ı tanıtıyorum. Bu araç, kullanıma hazır bir “her şey dahil” işlem stratejisi olarak çalışır. Tek bir yazılım kodu içinde güçlü piyasa teknik analiz araçları, işlem sinyalleri (oklar), uyarı işlevleri ve push bildirimleri entegre edilmiştir. Bu göstergeyi satın alan herkes aşağıdaki hediyeleri ücretsiz olarak alır: Açık emirleri otomatik yönetmek için Grabber Yardımcı Aracı Kurulum, yapılandırma ve nasıl işlem yapılacağını adım adım anlatan video kıl
Quantum TrendPulse
Bogdan Ion Puscasu
5 (20)
SuperTrend   ,   RSI   ve   Stochastic'in   gücünü tek bir kapsamlı göstergede birleştirerek işlem potansiyelinizi en üst düzeye çıkaran nihai işlem aracı olan   Quantum TrendPulse'u   tanıtıyoruz. Hassasiyet ve verimlilik arayan yatırımcılar için tasarlanan bu gösterge, piyasa trendlerini, momentum değişimlerini ve en uygun giriş ve çıkış noktalarını güvenle belirlemenize yardımcı olur. Temel Özellikler: SuperTrend Entegrasyonu:   Güncel piyasa trendlerini kolayca takip edin ve karlılık dalgası
Öncelikle, bu Ticaret Aracının Non-Repainting, Non-Redrawing ve Non-Lagging Gösterge olduğunu vurgulamakta fayda var, bu da onu profesyonel ticaret için ideal hale getiriyor. Çevrimiçi kurs, kullanıcı kılavuzu ve demo. Akıllı Fiyat Hareketi Kavramları Göstergesi, hem yeni hem de deneyimli tüccarlar için çok güçlü bir araçtır. İleri ticaret fikirlerini, Inner Circle Trader Analizi ve Smart Money Concepts Ticaret Stratejileri gibi 20'den fazla kullanışlı göstergeyi bir araya getirerek bir araya
Bu gösterge, fiyat dönüş noktalarını ve fiyat geri dönüş bölgelerini doğru bir şekilde gösterir.       Başlıca oyuncular   . Yeni trendlerin nerede oluştuğunu görüyorsunuz ve her işlem üzerinde kontrolü elinizde tutarak, azami hassasiyetle kararlar alıyorsunuz. TREND LINES PRO   göstergesiyle birlikte kullanıldığında maksimum potansiyelini ortaya koyar.  VERSION MT4 Göstergenin gösterdiği şey: Yeni bir trendin başlangıcında aktivasyonla birlikte tersine dönüş yapıları ve tersine dönüş seviyeler
Berma Bands
Muhammad Elbermawi
5 (8)
Berma Bantları (BB'ler) göstergesi, piyasa trendlerini belirlemeyi ve bunlardan yararlanmayı amaçlayan yatırımcılar için değerli bir araçtır. Fiyat ile BB'ler arasındaki ilişkiyi analiz ederek, yatırımcılar bir piyasanın trend veya aralıklı fazda olup olmadığını ayırt edebilir. Daha fazla bilgi edinmek için [ Berma Home Blog ] adresini ziyaret edin. Berma Bantları üç belirgin çizgiden oluşur: Üst Berma Bandı, Orta Berma Bandı ve Alt Berma Bandı. Bu çizgiler fiyatın etrafına çizilir ve genel tren
Her gün birçok trader ortak bir zorlukla karşılaşır: fiyat önemli bir seviyeyi kırıyor gibi görünür, işleme girerler ve ardından piyasa tersine dönerek stop loss'larını tetikler. Bu, sahte kırılım (false breakout) olarak bilinir — fiyatın bir destek veya direnç seviyesini kısa süreliğine aşması ve ardından yön değiştirmesi hareketidir. Bu hareketler, gerçek fiyat yönü netleşmeden önce stop loss'ların tetiklenmesine neden olabilir. Teknik analizde bu olgu yaygın olarak "likidite taraması" (liquid
TREND ÇİZGİLERİ PRO       Piyasanın gerçek yön değiştirdiği noktayı anlamaya yardımcı olur. Gösterge, gerçek trend dönüşlerini ve büyük oyuncuların piyasaya yeniden girdiği noktaları gösterir. Anlıyorsun   BOS hatları   Daha yüksek zaman dilimlerindeki trend değişiklikleri ve önemli seviyeler, karmaşık ayarlar veya gereksiz gürültü olmadan gösterilir. Sinyaller yeniden çizilmez ve çubuk kapandıktan sonra grafikte kalır. MT4 SÜRÜMÜ   -   RFI LEVELS PRO   göstergesiyle   birlikte kullanıldığında m
Pointer Trend Switch — precision trend reversal indicator Pointer Trend Switch is a high-precision arrow indicator designed to detect key moments of trend reversal based on asymmetric price behavior within a selected range of bars. It identifies localized price impulses by analyzing how far price deviates from the opening level, helping traders find accurate entry points before a trend visibly shifts. This indicator is ideal for scalping, intraday strategies, and swing trading, and performs equa
Trend indicator AI mt5
Ramil Minniakhmetov
5 (15)
Trend Ai göstergesi, trend tanımlamasını işlem yapılabilir giriş noktaları ve geri dönüş uyarılarıyla birleştirerek bir yatırımcının piyasa analizini geliştirecek harika bir araçtır. Bu gösterge, kullanıcıların forex piyasasının karmaşıklıklarında güvenle ve hassasiyetle yol almalarını sağlar. Birincil sinyallerin ötesinde, Trend Ai göstergesi geri çekilmeler veya düzeltmeler sırasında ortaya çıkan ikincil giriş noktalarını belirleyerek, yatırımcıların belirlenen trend içindeki fiyat düzeltmele
Tanıtım       Quantum Breakout PRO   , Breakout Bölgeleri ile ticaret yapma şeklinizi değiştiren çığır açan MQL5 Göstergesi! 13 yılı aşkın ticaret tecrübesine sahip deneyimli tüccarlardan oluşan bir ekip tarafından geliştirilmiştir.       Kuantum Breakout PRO       yenilikçi ve dinamik koparma bölgesi stratejisiyle ticaret yolculuğunuzu yeni zirvelere taşımak için tasarlanmıştır. Kuantum Breakout Göstergesi, size 5 kar hedefi bölgesi ile kırılma bölgelerinde sinyal okları ve kırılma kutusuna da
Göstergemiz, piyasada ilgi gösterilen bölgeleri vurgular ve ardından emir birikim bölgelerini gösterir. Büyük ölçekli bir emir defteri (order book) gibi çalışır. Bu, büyük sermaye için geliştirilmiş bir göstergedir. Performansı olağanüstüdür. Piyasada ne tür bir ilgi olursa olsun, onu görürsünüz . (Bu, tamamen yeniden yazılmış ve otomatikleştirilmiş bir versiyondur – artık manuel analiz gerekmez.) İşlem Hızı (Transaction Speed) , piyasada büyük emirlerin nerede ve ne zaman biriktiğini gösteren v
Advanced Supply Demand MT5
Bernhard Schweigert
4.5 (14)
Herhangi bir Acemi veya Uzman Tüccar için En İyi Çözüm! Bu gösterge benzersiz, yüksek kaliteli ve uygun fiyatlı bir ticaret aracıdır çünkü bir dizi tescilli özelliği ve yeni bir formülü bir araya getirdik. Bu güncelleme ile çift zaman dilimi dilimlerini gösterebileceksiniz. Yalnızca daha yüksek bir TF gösteremeyeceksiniz, aynı zamanda TF grafiğini ve ARTIK daha yüksek TF'yi de gösterebileceksiniz: YUVARLAK BÖLGELERİ GÖSTERMEK. Tüm Arz Talebi tüccarları buna bayılacak. :) Önemli Bilgiler Açıkland
TrendMaestro5
Stefano Frisetti
note: this indicator is for METATRADER4, if you want the version for METATRADER5 this is the link:  https://www.mql5.com/it/market/product/108106 TRENDMAESTRO ver 2.5 TRENDMAESTRO recognizes a new TREND from the start, he never makes mistakes. The certainty of identifying a new TREND is priceless. DESCRIPTION TRENDMAESTRO identifies a new TREND in the bud, this indicator examines the volatility, volumes and momentum to identify the moment in which there is an explosion of one or more of these da
Protect against whipsaws: revolutionize your swing trading approach Swing Trading is the first indicator designed to detect swings in the direction of the trend and possible reversal swings. It uses the baseline swing trading approach, widely described in trading literature. The indicator studies several price and time vectors to track the aggregate trend direction and detects situations in which the market is oversold or overbought and ready to correct. [ Installation Guide | Update Guide | Tro
Candle Smart Range
Gianny Alexander Lugo Sanchez
MetaTrader 5 için Candle Smart Range (CSR) Candle Smart Range, birden fazla zaman diliminde fiyat aralıklarının otomatik olarak tanımlanması için tasarlanmış teknik bir göstergedir. Bu araç, piyasa yapısını mum formasyonlarına ve fiyatın önceki en yüksek/en düşük seviyelerle olan etkileşimine dayanarak analiz eder. Ana Özellikler: Aralık Tespiti: İmpulsif hareketlerden önceki konsolidasyon bölgelerini tanımlar. Sahte Kırılma Tanımlama: Fiyatın önceki seviyeyi aştığı ancak mum kapanış kriterlerin
RelicusRoad Pro: Kantitatif Piyasa İşletim Sistemi ÖMÜR BOYU ERİŞİMDE %70 İNDİRİM (SINIRLI SÜRE) - 2.000+ TRADER'A KATILIN Neden çoğu trader "mükemmel" indikatörlere rağmen başarısız olur? Çünkü tekil kavramları boşlukta trade ederler. Bağlamı olmayan bir sinyal kumardır. Sürekli kazanmak için KONFLÜANS (UYUM) gerekir. RelicusRoad Pro basit bir ok indikatörü değildir. Tam bir Kantitatif Piyasa Ekosistemi dir. Tescilli volatilite modellemesini kullanarak fiyatın ilerlediği "Adil Değer Yolu"nu har
ATrend
Zaha Feiz
4.82 (17)
ATREND: Nasıl Çalışır ve Nasıl Kullanılır ### Nasıl Çalışır "**ATREND**" göstergesi, MT5 platformu için tasarlanmış olup, traderlara sağlam alım ve satım sinyalleri sağlamak amacıyla teknik analiz metodolojilerinin bir kombinasyonunu kullanır. Bu gösterge, öncelikle volatilite ölçümü için Ortalama Gerçek Aralık (ATR) kullanır ve potansiyel piyasa hareketlerini belirlemek için trend tespit algoritmalarıyla birleştirir. Satın aldıktan sonra bir mesaj bırakın ve özel bir bonus hediyesi kazanın. ##
FX Volume MT5
Daniel Stein
4.79 (24)
FX Volume: Bir Broker’ın Perspektifinden Gerçek Piyasa Duyarlılığını Deneyimleyin Kısa Özet Trading yaklaşımınızı bir adım öteye taşımak ister misiniz? FX Volume , perakende traderlar ile brokerların nasıl konumlandığını gerçek zamanlı olarak sunar—COT gibi gecikmeli raporlardan çok daha önce. İster istikrarlı kazançları hedefliyor olun, ister piyasada daha güçlü bir avantaj arayın, FX Volume önemli dengesizlikleri belirlemenize, kırılmaları (breakout) doğrulamanıza ve risk yönetiminizi iyileş
Native Channels
BeeXXI Corporation
5 (1)
This indicator recognizes all support and resistance levels. A number of unique high-performance techniques have been applied, which made the existence of this indicator possible. All formed channels are naturally visible: horizontal linear linear parabolic cubic (Polynomial 3 degrees - Wave) This is due to a bundle of approximating channels. The formed channels form "standing waves" in a hierarchical sequence. Thus, all support and resistance levels are visible. All parameter management is i
" Dynamic Scalper System MT5 " göstergesi, trend dalgaları içinde işlem yapmak için scalping yöntemi için tasarlanmıştır. Başlıca döviz çiftleri ve altın üzerinde test edilmiştir, diğer işlem araçlarıyla uyumluluğu mümkündür. Ek fiyat hareketi desteğiyle trend boyunca pozisyonların kısa vadeli açılması için sinyaller sağlar. Göstergenin prensibi. Büyük oklar trend yönünü belirler. Küçük oklar şeklinde scalping için sinyaller üreten bir algoritma trend dalgaları içinde çalışır. Kırmızı oklar yü
Filtrele:
İnceleme yok
İncelemeye yanıt