Supertrend Fakeout for MT5

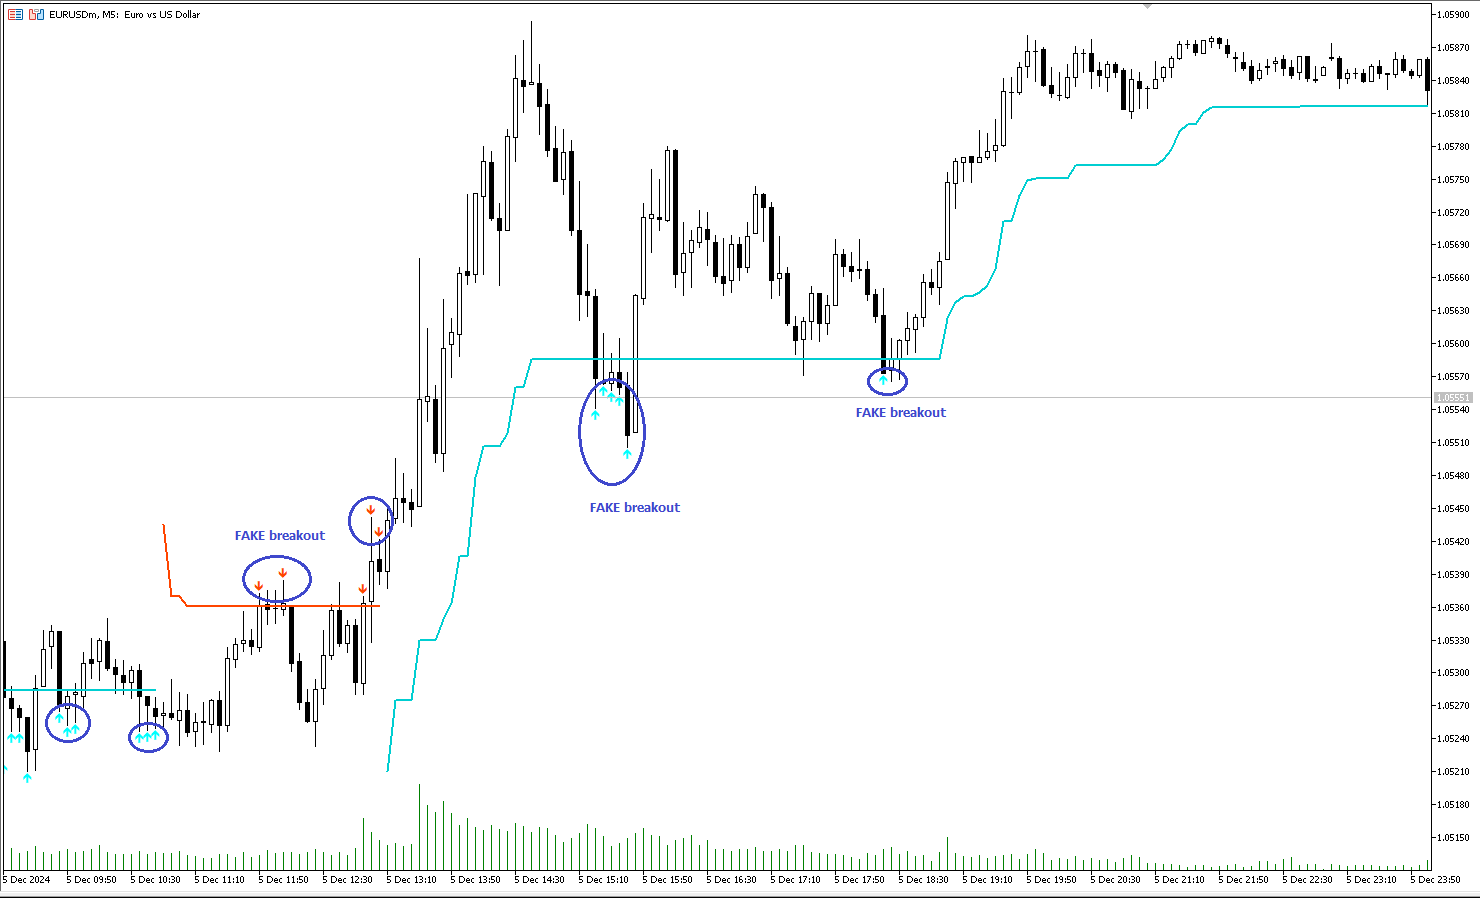
This script is an enhanced version of the classic Supertrend indicator. It incorporates an additional feature that ensures trend reversals are more reliable by introducing a Fakeout Index Limit and a Fakeout ATR Mult. This helps avoid false trend changes that could occur due to short-term price fluctuations or market noise.

In smart money concept, when institute , "big-fish" want to buy, they usually sell first to take sellside liquidity and vice versal. This is why the indicator become importance. You can think about when fake break out happen, it time, big-fisrt manipulate, so this is oppotunity for your buy / sell entry.  

How It Works:

  • The Supertrend indicator uses Average True Range (ATR) and a multiplier to determine the direction of the trend. When the price is above the Supertrend line, it indicates an uptrend; when the price is below the Supertrend line, it signals a downtrend.
  • This version goes a step further by adding the following checks before confirming a trend reversal:
    • The script will monitor if the price moves "Fakeout ATR Mult" ATR away from the Supertrend line after a potential breach. This distance helps ensure that the trend change is significant and not just a minor fluctuation.
    • In addition, the script checks the price action for a specific number of bars, which is controlled by the Fakeout Index Limit. This limit determines how many bars the price must remain below (for a downtrend) or above (for an uptrend) the Supertrend line before the trend is officially reversed.
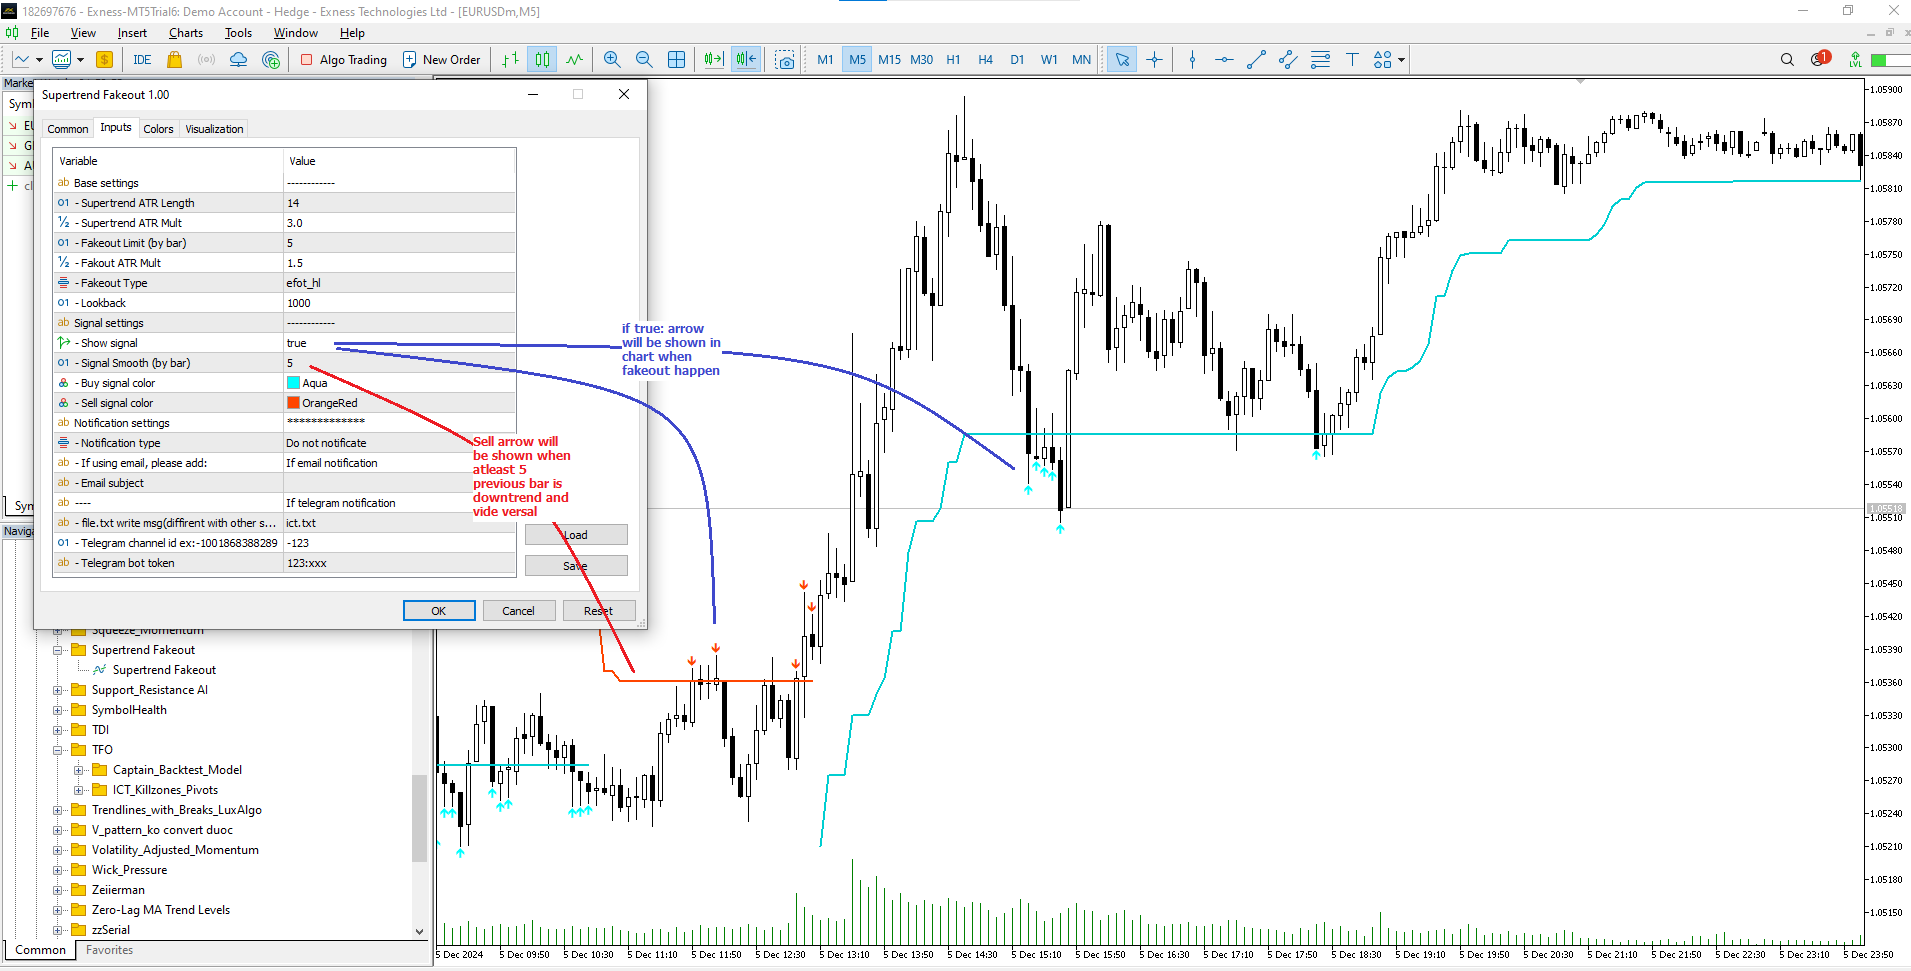
Setting:

+ Supertrend setting

+ Fakeout limit (by candle). This is number of candle that price change direction.

+ Fakeout ATR mult

+ Fakeout type by high, low or close

+ Signal settings: I put arrow as buy/sell signal when fakeout happen. In default this feature was turn off.

+ Notification settings: You have to turn on signal setting also.


Önerilen ürünler
Correlation Matrix Pro - Çoklu Döviz Hedge Tarayıcı Döviz çiftleri arasındaki ilişkileri gerçek zamanlı olarak anlayın! 6 döviz çifti arasındaki istatistiksel ilişkileri aynı anda görselleştirmenize yardımcı olan güçlü bir analiz aracıdır. Portföy yönetimi, risk çeşitlendirmesi ve hedge stratejileri için mükemmeldir. TEMEL ÖZELLİKLER - Logaritmik getiriler kullanan gerçek zamanlı Pearson korelasyonu - Aynı anda 6 döviz çiftini izleme - Otomatik zaman dilimi algılama - Ayarlanabilir geriye bakış
FREE
Hull Moving Average (HMA) for MT5 – Hızlı, Pürüzsüz ve Gecikmesiz Trend Göstergesi Trading seviyenizi bir üst seviyeye taşıyın: Hull Moving Average (HMA) , MetaTrader 5 için ultra hızlı ve neredeyse gecikmesiz bir trend göstergesidir. SMA, EMA veya WMA’dan farklı olarak HMA, piyasa yönüne anında tepki verir ve gürültüyü filtreler; scalping, gün içi veya swing trading için net ve güvenilir sinyaller sağlar. Yüksek performanslı Ağırlıklı Hareketli Ortalama motoru ile oluşturulmuş olup, Alan Hull’u
FREE
PowerZones Premium MT5
Christophe Pa Trouillas
Stratejik Bölge x3, x4, x5 kez dokunuldu    |   TP1/TP2/TP3 puan veya değer olarak   |   Risk/Ödül oranınızın güvenliğini görsel olarak kontrol edin Yeniden çizim yapmayan ve gecikmesiz gösterge - Manuel ve robot ticareti için ideal - Tüm varlıklar ve tüm zaman dilimleri için uygun Sınırlı süreli teklif  daha sonra >> $99  olacak Satın aldıktan sonra önerilen ve kişiselleştirilmiş ayarlar için lütfen benimle iletişime geçin [ Sürüm MT5  -  MT4  | Kazanma oranınızı maksimize etmek için diğer 3 a
Candle Perspective Structure Indicator MT5 is a simple indicator that defines and displays the candlestick structure of the market. This indicator will suit both experienced traders and beginners who find it difficult to follow the structure visually. If you want to see more high-quality products or order the development/conversion of your own products, visit my partners' website: 4xDev Get 10% OFF on manual strategies automation services or indicator development/conversion services at 4xDev
FREE
Hello, This is an easy symbol change panel. This is a full version of Symbol1 2Changer Symbols must be active on your Market Watch list. Parameters: SymbolList - you can add more symbols with a comma(,) ratio - change the size LineNumber - you can set that how many symbols are displayed per line. button_width - modify the button size button_height - modify the button size Thank you.
L'indicatore SMC Venom Model BPR è uno strumento professionale per i trader che operano nell'ambito del concetto di Smart Money (SMC). Identifica automaticamente due modelli chiave sul grafico dei prezzi: FVG   (Fair Value Gap) è una combinazione di tre candele, in cui c'è un gap tra la prima e la terza candela. Forma una zona tra livelli in cui non c'è supporto di volume, il che spesso porta a una correzione dei prezzi. BPR   (Balanced Price Range) è una combinazione di due modelli FVG che for
PathFinder Trend
Sveinn FRIDFINNSSON
5 (1)
For support, visit cc.inni.cc where you will also find our Knowledge library and FAQ. PATHFINDER TREND is a complex, yet easy to manage trend indicator. It has various features that can aid in your decision making and boost your performance accuracy. Patfhinder Trend is a visually comfortable and user friendly tool that you should keep on your trading desk. Key features Signal Detection & Trend Analysis Visually clear and decisive Early indication of signal direction with arrows Confirmed si
FREE
Introducing the   Range Predictor : Your Ultimate Guide to Future Trading Ranges!   Imagine having the power to see into the future of market moves— Range Predictor   brings this dream to life. Designed to deliver real-time,   predictive support and resistance levels , this tool goes beyond standard indicators, offering trend direction insights and precise range   forecasts . Whether you're a day trader or a swing trader, the   Range Predictor   is your all-in-one toolkit for mastering the ma
Range Directional Force Indicator – Designed for You to Optimize! The Range Directional Force Indicator is a cutting-edge tool designed to empower traders by visualizing market dynamics and directional strength. Built to offer insights into market trends and reversals, this indicator is an invaluable asset for traders seeking precision in their strategies. However, it is important to note that this indicator is not optimized, leaving room for you to tailor it to your unique trading preferences.
Indicator MTF Qristalium Arrows is a semi - automatic trading system. It works on all currency pairs.  The indicator uses three rules: 1) we trade only on the trend, 2)"buy when everyone sells and sell when everyone buys", 3) the Price always goes against the crowd.  Indicator MTF Arrows Qristalium filter rules across multiple time frames using the built-in indicators. If the trend matches on the selected time intervals, the indicator will give an arrow to enter the market. Then you make you
R747 BreakLevels is smart indicator that automatically detects Support and Resistance levels on actual market trend. Strength of levels can be easily adjusted by changing parameter LevelsStrength in range of 2 (weak levels) and 50 (strong levels). This indicator is accessible in EA via iCustom functions and is fully customizable by user. There is possibility to send Push notifications and Alerts of newly found levels. Follow this link to get all detailed information: >> LINK << Features Adjust
Fibrillar
Vitalii Zakharuk
It is very easy to use the Fibrillar indicator, since the simplest is to look at the chart and act according to the indications of the colored arrows. The algorithm takes into account the measurement of prices, and this method also focuses on measuring each of the price drops (H / C, H / O, LC, LO) - which gives more detailed information, but also more averaged. When calculating this indicator, logarithmic gains are first calculated at the closing price, which allows you to filter out the tren
Trade history
Andriy Konovalov
5 (2)
The indicator plots charts of profit taken at the Close of candles for closed (or partially closed) long and short positions individually. The indicator allows to filter deals by the current symbol, specified expert ID (magic number) and the presence (absence) of a substring in a deal comment, to set the start time and the periodicity of profit reset (daily, weekly or monthly) to calculate the profit chart. The indicator also displays the floating (not fixed) profit of the opened positions at th
Show Pips for MT5
Roman Podpora
4.52 (27)
Bu bilgi göstergesi her zaman hesaptaki güncel durumdan haberdar olmak isteyenler için faydalı olacaktır. VERSION MT 4 -   More useful indicators Gösterge, puan cinsinden kâr, yüzde ve para birimi gibi verilerin yanı sıra mevcut çiftin spreadini ve mevcut zaman diliminde çubuğun kapanmasına kadar geçen süreyi görüntüler. Bilgi satırını grafiğe yerleştirmek için birkaç seçenek vardır: Fiyatın sağında (fiyatın arkasında); Yorum olarak (grafiğin sol üst köşesinde); Ekranın seçilen köşesinde. Bilgi
FREE
Fibo Channels
Jeffrey Quiatchon
Fibo Daily Channel Indicator The  Indicator is a powerful tool for traders, providing precise daily support and resistance levels based on Fibonacci retracement and extension calculations. This indicator automatically draws key pivot points (PP, R1, R2, S1, S2) as well as additional extension levels (R3, R4, S3, S4), helping traders identify potential reversal and breakout zones with ease. It includes customizable alerts and push notifications, allowing traders to receive updates whenever the pr
Smaart Visual
Kris Van Sebroeck
SMA-ATR-Visual Indicator The SMA-ATR-Visual is a technical analysis indicator designed to assist traders in identifying market trends, measuring volatility, and visualizing potential entry signals on the chart. Main Components Simple Moving Averages (SMAs): The indicator plots two SMAs — a fast SMA (default 9-period) and a slow SMA (default 21-period) — to help detect short and medium term trend direction. ATR-Based Volatility Bands: Upper and lower bands are calculated using the Average True R
FREE
VFI Quantum
Nikita Berdnikov
5 (1)
Introducing VFI (Volume Flow Indicator) – a trading indicator that analyzes the relationship between volume and price movement to identify key trading opportunities. The indicator displays the strength and direction of volume flow, providing clear signals about potential entry and exit points. Signals are formed based on zero line crossovers, crossovers between the VFI line and its exponential moving average (EMA), and when the indicator exits overbought and oversold zones. Attention! This stra
FREE
Description The Institutional Cycle Filter (ICF) is a sophisticated trend-following tool that replaces standard moving averages with a "Signal Dot" system. It is designed to minimize lag while maintaining smoothness, making it highly effective for identifying trend reversals in volatile markets like Gold. How It Works (The Logic) Cosine Weighting: Unlike a Simple Moving Average (SMA) or Exponential Moving Average (EMA), this algorithm uses a Cosine function to calculate weights. This allows the
FREE
https://www.mql5.com/en/users/gedeegi/seller    The GEN indicator is a multifunctional technical analysis tool for the MetaTrader 5 (MT5) platform. It is designed to automatically identify and display key Support and Resistance (S&R) levels and detect False Breakout signals, providing clear and visual trading cues directly on your chart. Its primary goal is to help traders identify potential price reversal points and avoid market traps when the price fails to decisively break through key levels
FREE
Awesome Oscillator by Bill Williams with the ability to fine-tune and replace the averaging algorithms of the indicator, which significantly expands the possibilities of using this oscillator in algorithmic trading and brings it closer in its properties to such an indicator as the MACD. To reduce price noise, the final indicator is processed with an additional Smooth averaging. The indicator has the ability to give alerts, send mail messages and push signals when the direction of movement of th
iExposure Fox Wave – Comprehensive Position Monitoring Indicator iExposure Fox Wave is an advanced MetaTrader indicator designed to provide detailed monitoring of all open trading positions in a clear, tabular format. This tool is perfect for traders who want all essential trade information in one place. Key Features: Symbol: Displays the instruments (currency pairs or other symbols) with open positions. Deals: Number of open trades (transactions) for each symbol. Buy lots & Buy price: Total vol
Support & Resistance Auto Plot Lines Indicator for MT5 – Perfect for Scalping! Make your trading easier with our Support & Resistance Auto Plot Lines indicator for MT5. This powerful tool automatically detects key support and resistance levels on your chart, helping you make better trading decisions with minimal effort. Why Choose This Indicator? Perfect for Scalping – Quickly identify strong price zones for fast, precise entries and exits. Automatic Level Detection – No need to manually dra
Ortalama geri dönüş ticareti için profesyonel ve nicel bir yaklaşım uygulayan benzersiz gösterge. Fiyatın tahmin edilebilir ve ölçülebilir bir şekilde ortalamaya döndüğü ve yön değiştirdiği gerçeğinden yararlanır, bu da nicel olmayan ticaret stratejilerinden büyük ölçüde daha iyi performans gösteren net giriş ve çıkış kurallarına izin verir. [ Installation Guide | Update Guide | Troubleshooting | FAQ | All Products ] Ticaret sinyallerini temizle Ticaret yapmak inanılmaz derecede kolay Özelleşt
TrendDetect
Pavel Gotkevitch
The Trend Detect indicator combines the features of both trend indicators and oscillators. This indicator is a convenient tool for detecting short-term market cycles and identifying overbought and oversold levels. A long position can be opened when the indicator starts leaving the oversold area and breaks the zero level from below. A short position can be opened when the indicator starts leaving the overbought area and breaks the zero level from above. An opposite signal of the indicator can b
DYJ BoS göstergesi, piyasa yapısındaki değişimlerin temel unsurlarını otomatik olarak belirler ve işaretler, bunlar arasında şunlar yer alır: Yapının Kırılması (BoS): Fiyatın önceki bir yapı noktasını kırarak önemli bir hareket yapması durumunda tespit edilir. Olası yükseliş trendi çizgilerini ve düşüş trendi çizgilerini (UP & DN, yani sürekli yeni zirveler ve yeni dipler) işaretler ve fiyat bu çizgileri aştığında kırmızı (AYI) ve yeşil (BOĞA) okları işaretler BoS genellikle fiyatın önceki f
Knowledge of the strength and weakness of each currency is vital for every forex trader. Our   Currency Strength Meter indicator   measures the strength of eight major currencies (USD, EUR, GBP, CHF, JPY, CAD, AUD, NZD) by using the Relative Strength Index indicator, also known as RSI. The Currency Strength Meter indicator shows you, simply and quickly, when a currency is oversold, overbought, or in "normal area". This way, you can identify which currency is the strongest and the weakest. Our
The Riko Trend indicator is a revolutionary trend trading and filtering solution with all the important features of a trend tool built into one tool! The Riko Trend indicator is good for any trader, suitable for any trader for both forex and binary options. You don’t need to configure anything, everything is perfected by time and experience, it works great during a flat and in a trend. The Riko Trend indicator is a technical analysis tool for financial markets that reflects the current price f
Ignition
Dansie Software Limited
Strategy Overview The Ignition EA tries to take advantage of sudden momentum when the Ignition pattern is detected. The final bar in the ignition pattern has a small opening wick, a very little or no closing wick, is large in comparison to recent bars and must start from the lower end of the current range (for a bullish ignition) Quick Testing Use Symbol EURUSD, Timeframe M2, and remove the GBPUSD symbol from the "Symbols" input (stratergy 1 and stratergy 2) Settings The below settings appe
The new update makes this indicator a complete tool for studying, analyzing and operating probabilistic patterns. It includes: On-chart Multi-asset percentage monitor. Configurable martingales. Twenty-one pre-configured patterns, including Mhi patterns and C3. An advanced pattern editor to store up to 5 custom patterns. Backtest mode to test results with loss reports. Trend filter. Hit operational filter. Martingale Cycles option. Various types of strategies and alerts. Confluence between patter
Introducing a cutting-edge trading indicator, specifically designed to predict and signal upcoming spikes in Boom 1000 and Boom 500 markets. This innovative tool provides traders with timely alerts, enabling them to capitalize on market movements with precision. Key Features: Accurate Spike Prediction : The indicator utilizes advanced algorithms to identify potential spike occurrences in Boom 1000 and Boom 500 markets. User-Friendly Signals : The indicator generates clear buy signals, allowing t
Bu ürünün alıcıları ayrıca şunları da satın alıyor
Bu indikatörü satın alırsanız, Profesyonel Trade Manager’ımı  + EA ÜCRETSİZ olarak alacaksınız. Öncelikle, bu Ticaret Sistemi'nin Non-Repainting, Non-Redrawing ve Non-Lagging Göstergesi olduğunu vurgulamak önemlidir, bu da hem manuel hem de robot ticareti için ideal hale getirir. Online kurs, kılavuz ve ön ayarları indir. "Smart Trend Trading System MT5", yeni ve deneyimli tüccarlar için özelleştirilmiş kapsamlı bir ticaret çözümüdür. 10'dan fazla premium göstergeyi birleştiriyor ve 7'den fazla
SuperScalp Pro
Van Minh Nguyen
5 (2)
SuperScalp Pro – Gelişmiş Çoklu Filtreli Scalping Gösterge Sistemi SuperScalp Pro, klasik Supertrend ile çok sayıda akıllı onay filtresini birleştiren gelişmiş bir scalping gösterge sistemidir. Gösterge M1’den H4’e kadar tüm zaman dilimlerinde verimli çalışır ve özellikle XAUUSD, BTCUSD ve ana Forex pariteleri için uygundur. Bağımsız bir sistem olarak kullanılabilir veya mevcut ticaret stratejilerine esnek şekilde entegre edilebilir. Gösterge, hız ve yavaş EMA’lar, trend belirleyen üç EMA, EMA e
ARIPoint
Temirlan Kdyrkhan
ARIPoint is a powerful trading companion designed to generate high-probability entry signals with dynamic TP/SL/DP levels based on volatility. Built-in performance tracking shows win/loss stats, PP1/PP2 hits, and success rates all updated live. Key Features: Buy/Sell signals with adaptive volatility bands Real-time TP/SL/DP levels based on ATR Built-in MA Filter with optional ATR/StdDev volatility Performance stats panel (Success, Profit/Loss, PP1/PP2) Alerts via popup, sound, push, or email Cu
Entry In The Zone and SMC Multi Timeframe is a real-time market analysis tool developed based on Smart Money Concepts (SMC). It is designed to analyze market structure, price direction, reversal points, and key zones across multiple timeframes in a systematic way. The system displays Points of Interest (POI) and real-time No Repaint signals, with instant alerts when price reaches key zones or when signals occur within those zones. It functions as both an Indicator and a Signal System (2-in-1), c
Azimuth Pro
Ottaviano De Cicco
5 (4)
LAUNCH PROMO Azimuth Pro price is initially set at 299$ for the first 100 buyers. Final price will be 499$ . THE DIFFERENCE BETWEEN RETAIL AND INSTITUTIONAL ENTRIES ISN'T THE INDICATOR — IT'S THE LOCATION. Most traders enter at arbitrary price levels, chasing momentum or reacting to lagging signals. Institutions wait for price to reach structured levels where supply and demand actually shift. Azimuth Pro maps these levels automatically: swing-anchored VWAP, multi-timeframe structure lines, an
Divergence Bomber
Ihor Otkydach
4.89 (81)
Bu göstergeyi satın alan herkese aşağıdaki ekstra içerikler ücretsiz olarak sunulmaktadır: Her işlemi otomatik olarak yöneten, Stop Loss ve Take Profit seviyelerini ayarlayan ve işlemleri strateji kurallarına göre kapatan özel yardımcı araç: "Bomber Utility" Göstergenin farklı varlıklar üzerinde kullanılmasına yönelik ayar dosyaları (set dosyaları) Bomber Utility için 3 farklı modda kullanım sunan ayar dosyaları: "Minimum Risk", "Dengeli Risk" ve "Bekle-Gör Stratejisi" Bu ticaret stratejisini hı
Power Candles – Tüm Piyasalar İçin Güce Dayalı Giriş Sinyalleri Power Candles , Stein Investments’ın kanıtlanmış güç analizini doğrudan fiyat grafiğinize taşır. Sadece fiyata tepki vermek yerine, her mum gerçek piyasa gücüne göre renklendirilir. Bu sayede momentum birikimleri, güç hızlanmaları ve net trend geçişleri anında görülebilir. Tüm Piyasalar İçin Tek Mantık Power Candles tüm işlem sembollerinde otomatik olarak çalışır. Gösterge, mevcut sembolün Forex mi yoksa Forex dışı bir piyasa mı old
Atomic Analyst MT5
Issam Kassas
4.07 (28)
Öncelikle belirtmek gerekir ki bu Ticaret Göstergesi Yeniden Çizim Yapmaz, Gecikmez ve Gecikme Göstermez, bu da hem manuel hem de robot ticareti için ideal hale getirir. Kullanıcı kılavuzu: ayarlar, girişler ve strateji. Atom Analisti, Piyasada Daha İyi Bir Avantaj Bulmak İçin Fiyatın Gücünü ve Momentumunu Kullanan PA Fiyat Hareketi Göstergesidir. Gürültüleri ve Yanlış Sinyalleri Kaldırmaya ve Ticaret Potansiyelini Artırmaya Yardımcı Olan Gelişmiş Filtrelerle Donatılmıştır. Birden fazla katmanl
FX Trend NG: Yeni Nesil Çoklu Piyasa Trend Zekâsı Genel Bakış FX Trend NG , çoklu zaman dilimlerinde çalışan profesyonel bir trend analiz ve piyasa izleme aracıdır. Piyasanın yapısını saniyeler içinde anlamanızı sağlar. Birden fazla grafik arasında geçiş yapmak yerine, hangi enstrümanların trendde olduğunu, momentumun nerede zayıfladığını ve hangi zaman dilimlerinin uyumlu olduğunu anında görebilirsiniz. Lansman Teklifi – FX Trend NG sadece $30 (6 Ay) veya $80 Ömür Boyu Lisans ile edinin. Zate
Her gün birçok trader ortak bir zorlukla karşılaşır: fiyat önemli bir seviyeyi kırıyor gibi görünür, işleme girerler ve ardından piyasa tersine dönerek stop loss'larını tetikler. Bu, sahte kırılım (false breakout) olarak bilinir — fiyatın bir destek veya direnç seviyesini kısa süreliğine aşması ve ardından yön değiştirmesi hareketidir. Bu hareketler, gerçek fiyat yönü netleşmeden önce stop loss'ların tetiklenmesine neden olabilir. Teknik analizde bu olgu yaygın olarak "likidite taraması" (liquid
FX Power MT5 NG
Daniel Stein
5 (31)
FX Power: Daha Akıllı Ticaret Kararları için Para Birimlerinin Gücünü Analiz Edin Genel Bakış FX Power , her piyasa koşulunda başlıca para birimlerinin ve altının gerçek gücünü anlamak için vazgeçilmez bir araçtır. Güçlü para birimlerini alıp zayıf olanları satarak, FX Power ticaret kararlarınızı basitleştirir ve yüksek olasılıklı fırsatları ortaya çıkarır. İster trendlere sadık kalın ister Delta'nın aşırı değerlerini kullanarak tersine dönüşleri öngörün, bu araç ticaret tarzınıza mükemmel bir
Top indicator for MT5   providing accurate signals to enter a trade without repainting! It can be applied to any financial assets:   forex, cryptocurrencies, metals, stocks, indices .  Watch  the video  (6:22) with an example of processing only one signal that paid off the indicator! MT4 version is here It will provide pretty accurate trading signals and tell you when it's best to open a trade and close it. Most traders improve their trading results during the first trading week with the help of
" Dynamic Scalper System MT5 " göstergesi, trend dalgaları içinde işlem yapmak için scalping yöntemi için tasarlanmıştır. Başlıca döviz çiftleri ve altın üzerinde test edilmiştir, diğer işlem araçlarıyla uyumluluğu mümkündür. Ek fiyat hareketi desteğiyle trend boyunca pozisyonların kısa vadeli açılması için sinyaller sağlar. Göstergenin prensibi. Büyük oklar trend yönünü belirler. Küçük oklar şeklinde scalping için sinyaller üreten bir algoritma trend dalgaları içinde çalışır. Kırmızı oklar yü
Grabber System MT5
Ihor Otkydach
4.82 (22)
Size mükemmel bir teknik gösterge olan Grabber’ı tanıtıyorum. Bu araç, kullanıma hazır bir “her şey dahil” işlem stratejisi olarak çalışır. Tek bir yazılım kodu içinde güçlü piyasa teknik analiz araçları, işlem sinyalleri (oklar), uyarı işlevleri ve push bildirimleri entegre edilmiştir. Bu göstergeyi satın alan herkes aşağıdaki hediyeleri ücretsiz olarak alır: Açık emirleri otomatik yönetmek için Grabber Yardımcı Aracı Kurulum, yapılandırma ve nasıl işlem yapılacağını adım adım anlatan video kıl
Trend Screener Pro MT5
STE S.S.COMPANY
4.84 (100)
Trend Göstergesi, Trend Alım Satım ve Filtreleme için Çığır Açan Benzersiz Çözüm, Tüm Önemli Trend Özellikleriyle Tek Bir Araç İçinde Yerleştirildi! Forex, emtialar, kripto para birimleri, endeksler ve hisse senetleri gibi tüm sembollerde/araçlarda kullanılabilen %100 yeniden boyamayan çoklu zaman çerçevesi ve Çoklu para birimi göstergesidir. Trend Screener, grafikte noktalarla ok trend sinyalleri sağlayan etkili bir trend trend göstergesidir. Trend analizörü göstergesinde bulunan özellikler: 1.
Göstergemiz, piyasada ilgi gösterilen bölgeleri vurgular ve ardından emir birikim bölgelerini gösterir. Büyük ölçekli bir emir defteri (order book) gibi çalışır. Bu, büyük sermaye için geliştirilmiş bir göstergedir. Performansı olağanüstüdür. Piyasada ne tür bir ilgi olursa olsun, onu görürsünüz . (Bu, tamamen yeniden yazılmış ve otomatikleştirilmiş bir versiyondur – artık manuel analiz gerekmez.) İşlem Hızı (Transaction Speed) , piyasada büyük emirlerin nerede ve ne zaman biriktiğini gösteren v
Smart Stop Indicator – Stop-loss düzeylerini doğrudan grafikte akıllı ve hassas şekilde belirleyin Genel Bakış Smart Stop Indicator, stop-loss seviyesini tahmin ederek veya sezgilere güvenerek değil, net ve sistematik bir şekilde belirlemek isteyen traderlar için özel olarak geliştirilmiştir. Bu araç, klasik price-action mantığını (yükselen tepeler, düşen dipler) modern breakout algılama ile birleştirerek bir sonraki mantıklı stop seviyesini belirler. Trendlerde, yatay piyasalarda veya hızlı k
RelicusRoad Pro: Kantitatif Piyasa İşletim Sistemi ÖMÜR BOYU ERİŞİMDE %70 İNDİRİM (SINIRLI SÜRE) - 2.000+ TRADER'A KATILIN Neden çoğu trader "mükemmel" indikatörlere rağmen başarısız olur? Çünkü tekil kavramları boşlukta trade ederler. Bağlamı olmayan bir sinyal kumardır. Sürekli kazanmak için KONFLÜANS (UYUM) gerekir. RelicusRoad Pro basit bir ok indikatörü değildir. Tam bir Kantitatif Piyasa Ekosistemi dir. Tescilli volatilite modellemesini kullanarak fiyatın ilerlediği "Adil Değer Yolu"nu har
Quantum TrendPulse
Bogdan Ion Puscasu
5 (20)
SuperTrend   ,   RSI   ve   Stochastic'in   gücünü tek bir kapsamlı göstergede birleştirerek işlem potansiyelinizi en üst düzeye çıkaran nihai işlem aracı olan   Quantum TrendPulse'u   tanıtıyoruz. Hassasiyet ve verimlilik arayan yatırımcılar için tasarlanan bu gösterge, piyasa trendlerini, momentum değişimlerini ve en uygun giriş ve çıkış noktalarını güvenle belirlemenize yardımcı olur. Temel Özellikler: SuperTrend Entegrasyonu:   Güncel piyasa trendlerini kolayca takip edin ve karlılık dalgası
Super Signal – Skyblade Edition Profesyonel No-Repaint / Gecikmesiz Trend Sinyal Sistemi, Olağanüstü Kazanma Oranı ile | MT4 / MT5 için 1 dakika, 5 dakika ve 15 dakika gibi daha düşük zaman dilimlerinde en iyi şekilde çalışır. Temel Özellikler: Super Signal – Skyblade Edition, özellikle trend bazlı işlemler için geliştirilmiş akıllı bir sinyal sistemidir. Yalnızca güçlü, yönlü ve gerçek momentum destekli piyasa hareketlerini tespit etmek amacıyla çok katmanlı bir filtreleme yapısı kullanır.
Bill Williams Advanced
Siarhei Vashchylka
5 (10)
Bill Williams Advanced is designed for automatic chart analysis using Bill Williams' "Profitunity" system. The indicator analyzes four timeframes at once. Manual (Be sure to read before purchasing) Advantages 1. Analyzes the chart using Bill Williams' "Profitunity" system. Signals are displayed in a table in the corner of the screen and on the price chart. 2. Finds all known AO and AC signals, as well as zone signals. Equipped with a trend filter based on the Alligator. 3. Finds "Divergence Bar
TPSproTREND PrO MT5
Roman Podpora
4.74 (19)
TPSproTrend PRO, piyasanın yön değiştirdiği anı belirler ve hareketin başlangıcında bir giriş noktası oluşturur. Piyasaya, fiyat hareketi henüz yeni başladığı anda girersiniz, hareket gerçekleştikten sonra değil.   Gösterge       Sinyalleri yeniden çizmez ve giriş noktalarını, Zarar Durdurma ve Kar Al seviyelerini otomatik olarak göstererek alım satımı net, görsel ve yapılandırılmış hale getirir. RUSÇA TALİMATLAR   -   MT4 SÜRÜMÜ Başlıca avantajlar Yeniden çizim yapılmadan sinyaller.   Tüm sinya
Support And Resistance Screener, MetaTrader için tek bir gösterge içinde birden fazla araç sağlayan tek bir Düzey göstergesindedir. Kullanılabilir araçlar şunlardır: 1. Piyasa Yapısı Eleme Aracı. 2. Geri Çekilme Bölgesi Boğa. 3. Geri Çekilme Bölgesi Ayı. 4. Günlük Pivot Noktaları 5. haftalık Pivot Noktaları 6. aylık Pivot Puanları 7. Harmonik Modele ve hacme dayalı Güçlü Destek ve Direnç. 8. Banka Seviyesi Bölgeleri. SINIRLI SÜRELİ TEKLİF : YG Destek ve Direnç Göstergesi sadece 50 $ ve ömür boyu
IX Power MT5
Daniel Stein
4.92 (12)
IX Power: Endeksler, Emtialar, Kripto Paralar ve Forex Piyasaları için İçgörüler Genel Bakış IX Power , endeksler, emtialar, kripto paralar ve forex sembollerinin gücünü analiz etmek için tasarlanmış çok yönlü bir araçtır. FX Power , tüm kullanılabilir döviz çiftlerinin verilerini kullanarak döviz çiftleri için maksimum doğruluk sağlarken, IX Power yalnızca temel sembolün piyasa verilerine odaklanır. Bu, IX Power 'ı forex dışındaki piyasalar için ideal ve daha basit forex analizleri için güven
FX Levels MT5
Daniel Stein
5 (13)
FX Levels: Tüm Piyasalar İçin Son Derece Hassas Destek ve Direnç Hızlı Bakış Döviz kurları, endeksler, hisseler veya emtialar gibi herhangi bir piyasada güvenilir destek ve direnç seviyeleri belirlemek mi istiyorsunuz? FX Levels geleneksel “Lighthouse” yöntemini ileri düzey bir dinamik yaklaşımla birleştirerek neredeyse evrensel bir doğruluk sağlar. Gerçek broker deneyimimize ve otomatik günlük güncellemeler ile gerçek zamanlı güncellemelerin birleşimine dayalı olarak, FX Levels size dönüş nok
TREND ÇİZGİLERİ PRO       Piyasanın gerçek yön değiştirdiği noktayı anlamaya yardımcı olur. Gösterge, gerçek trend dönüşlerini ve büyük oyuncuların piyasaya yeniden girdiği noktaları gösterir. Anlıyorsun   BOS hatları   Daha yüksek zaman dilimlerindeki trend değişiklikleri ve önemli seviyeler, karmaşık ayarlar veya gereksiz gürültü olmadan gösterilir. Sinyaller yeniden çizilmez ve çubuk kapandıktan sonra grafikte kalır. MT4 SÜRÜMÜ Göstergenin gösterdiği şey: Gerçek değişimler   trend (BOS çizg
Bu gösterge paneli, seçilen semboller için mevcut en son   harmonik kalıpları   gösterir, böylece zamandan tasarruf edersiniz ve daha verimli olursunuz /   MT4 sürümü . Ücretsiz Gösterge:   Basic Harmonic Pattern Gösterge sütunları Symbol :   seçilen semboller görünecektir Trend:   yükseliş veya düşüş Pattern :   desen türü (gartley, kelebek, yarasa, yengeç, köpekbalığı, cypher veya ABCD) Entry :   giriş fiyatı SL:   zararı durdur fiyatı TP1:   1. kar alma fiyatı TP2:   2. kar alma fiyatı TP
Weis Wave with Alert MT5
Trade The Volume Waves Single Member P.C.
4.94 (17)
Rental/Lifetime Package Options and Privileges  Rent Monthly Six Months   Yearly/Lifetime Weis Wave with Speed with Alert+Speed Index x x x Manual  x x x Quick Set up Video x x x Blog x x x Lifetime Updates x x x Setup and Training Material x x Discord Access Channel "The SI traders"          x Rectangle Break Alert Tool      x How to trade with it:    http://www.tradethevolumewaves.com   ** If you purchase please contact me to setup your  : Training Room and  complete manual access.  Wei
Dark Support Resistance  is an Indicator for intraday trading. This Indicator is programmed to identify  Support and Resistance Lines , providing a high level of accuracy and reliability. Key benefits Easily visible lines Only the most important levels will be displayed Automated adjustment for each timeframe and instrument Easy to use even for beginners Never repaints, never backpaints, Not Lag 100% compatible with Expert Advisor development All types of alerts available: Pop-up, Email, Push
Öncelikle, bu Ticaret Aracının Non-Repainting, Non-Redrawing ve Non-Lagging Gösterge olduğunu vurgulamakta fayda var, bu da onu profesyonel ticaret için ideal hale getiriyor. Çevrimiçi kurs, kullanıcı kılavuzu ve demo. Akıllı Fiyat Hareketi Kavramları Göstergesi, hem yeni hem de deneyimli tüccarlar için çok güçlü bir araçtır. İleri ticaret fikirlerini, Inner Circle Trader Analizi ve Smart Money Concepts Ticaret Stratejileri gibi 20'den fazla kullanışlı göstergeyi bir araya getirerek bir araya
Yazarın diğer ürünleri
The indicator returning pivot point based trendlines with highlighted breakouts . Trendline caculated by pivot point and other clue are ATR, Stdev. The indicator also includes integrated alerts for  trendlines  breakouts and foward message to Telegram channel or group if you want. Settings ·          Lookback bar: Default 200 is number of bar caculate when init indicator. ·          Length:  Pivot points  period ·          Slope Calculation Method: Determines how this lope is calculated. We supp
ICT Concepts
Minh Truong Pham
5 (2)
The ICT Concepts indicator regroups core concepts highlighted by trader and educator "The Inner Circle Trader" (ICT) into an all-in-one toolkit. Features include Market Structure (MSS & BOS), Order Blocks, Imbalances, Buyside/Sellside Liquidity, Displacements, ICT Killzones, and New Week/Day Opening Gaps. It’s one kind of Smart money concepts. USAGE: Please read this document  !    DETAILS Market Structure Market structure labels are constructed from price breaking a prior extreme point. T
This all-in-one indicator displays real-time market structure (internal & swing BOS / CHoCH), order blocks, premium & discount zones, equal highs & lows, and much more...allowing traders to automatically mark up their charts with widely used price action methodologies. Following the release of our Fair Value Gap script, we received numerous requests from our community to release more features in the same category. "Smart Money Concepts" (SMC) is a fairly new yet widely used term amongst price a
The Hull  Butterfly  Oscillator (HBO) is an oscillator constructed from the difference between a regular  Hull Moving Average  (  HMA  ) and another with coefficients flipped horizontally . Levels are obtained from cumulative means of the absolute value of the oscillator. These are used to return dots indicating potential reversal points . This indicator draw line in separate window, plus blue dot (for buy signal) when hull oscillator is peak and red when sell signal. It  also includes integrate
This indicator provides the ability to recognize the SMC pattern, essentially a condensed version of the Wyckoff model. Once the pattern is confirmed by RTO, it represents a significant investment opportunity.    There are numerous indicators related to SMC beyond the market, but this is the first indicator to leverage patterns to identify specific actions of BigBoy to  navigate the market. Upgrade 2024-03-08: Add TP by RR feature. The SMC (Smart Money Concept)   pattern   is a market analysis m
Detect divergence (classic, hidden) price and all oscillator indicator include: RSI, CCI, MACD, OSMA, Stochastic, Momentum, Awesome Oscillator (AO), Accelerator Oscillator (AC), Williams Percent Range (WPR), Relative Vigor Index (RVI), Rate of Change (ROC). Confirm reversal with dochian channel for to improve signal quality. Divergence is when the price of an asset is moving in the opposite direction of a technical   indicator , such as an oscillator, or is moving contrary to other data. Diverge
This is a Forex Scalping Trading Sytem based on the Bollinger Bands.  Pairs:Major Time frame: 1M or higher. Spread max:0,0001.  Indicators (just suggestion) Bollinger bands (20, 2); ADX (14 period); RSI   (7 period ). Y ou should only trade this system between 2am to 5am EST, 8am to 12am EST and 7.30pm to 10pm EST. Do not scalp 30 minutes before a orange or red news  report and not for a hour afterwards.   Setup: is for price to move above the lower or lower Bollinger Bands, RSI raise above the
FREE
The SuperTrend AI indicator is a novel take on bridging the gap between the K-means clustering machine learning method & technical indicators. In this case, we apply K-Means clustering to the famous SuperTrend indicator.   USAGE Users can interpret the SuperTrend AI trailing stop similarly to the regular SuperTrend indicator. Using higher minimum/maximum factors will return longer-term signals. (image 1) The displayed performance metrics displayed on each signal allow for a deeper interpretat
This is addition of  Effective SV squeeze momentum  that add bolliger band and Keltner channel to chart window.  Squeeze momentum introduced by “John Carter”, the squeeze indicator for MT5 represents a volatility-based tool. Regardless, we can also consider the squeeze indicator as a momentum indicator, as many traders use it to identify the direction and strength of price moves. In fact, the Tradingview  squeeze indicator shows when a financial instrument is willing to change from a trending ma
FREE
The concept of Harmonic Patterns was established by H.M. Gartley in 1932. Gartley wrote about a 5-point (XABCD) pattern (known as Gartley) in his book Profits in the Stock Market. This indicator scan and alert when 4th point (C) is complete and predict where D should be.  In traditional, Gartley pattern include BAT pattern, Gartley pattern, butterfly pattern, crab pattern, deep crab pattern, shark pattern. Each pattern has its own set of fibonacci. In this indicator, we add more extended patter
The indicator show Higher timeframe candles for ICT technical analisys Higher time frames reduce the 'noise' inherent in lower time frames, providing a clearer, more accurate picture of the market's movements. By examining higher time frames, you can better identify trends, reversals, and key areas of support and resistance. The Higher Time Frame Candles indicator overlays higher time frame data directly onto your current chart. You can easily specify the higher time frame candles you'd li
All about Smart Money Concepts Strategy: Market struture: internal or swing BOS, CHoCH; Orderblock; Liquity equal; Fair Value Gap with Consequent encroachment, Balanced price range; Level with Previous month, week, day level or in day level (PMH, PWH, PDH, HOD); BuySell Stops Liquidity (BSL, SSL); Liquidity Void Long Wicks; Premium and Discount; Candle pattern ... "Smart Money Concepts" ( SMC ) is a fairly new yet widely used term amongst price action traders looking to more accurately navigate
The indicator   returning pivot point based trendlines with highlighted breakouts . Trendline caculated by pivot point and other clue are ATR, Stdev.   The indicator also includes integrated alerts for  trendlines  breakouts   and foward message to Telegram channel or group if you want. Settings ·            Lookback bar: Default 200 is number of bar caculate when init indicator. ·            Length:  Pivot points  period ·            Slope Calculation Method: Determines how this lope is calcula
This all-in-one indicator displays real-time market structure (internal & swing BOS / CHoCH), order blocks, premium & discount zones, equal highs & lows, and much more...allowing traders to automatically mark up their charts with widely used price action methodologies. Following the release of our Fair Value Gap script, we received numerous requests from our community to release more features in the same category. //------------------------------------// Version 1.x has missing functions + PDAr
The Breaker Blocks with Signals indicator aims to highlight a complete methodology based on breaker blocks. Breakout signals between the price and breaker blocks are highlighted and premium/discount swing levels are included to provide potential take profit/stop loss levels. This script also includes alerts for each signal highlighted.   SETTINGS   Breaker Blocks Length: Sensitivity of the detected swings used to construct breaker blocks. Higher values will return longer term break
The ICT Concepts indicator regroups core concepts highlighted by trader and educator "The Inner Circle Trader" (ICT) into an all-in-one toolkit. Features include Market Structure (MSS & BOS), Order Blocks, Imbalances, Buyside/Sellside Liquidity, Displacements, ICT Killzones, and New Week/Day Opening Gaps. It’s one kind of Smart money concepts.   USAGE:   Please read this   document  !      DETAILS Market Structure Market structure labels are constructed from price breaking a prior extreme
The FollowLine indicator is a trend following indicator. The blue/red lines are activated when the price closes above the upper Bollinger band or below the lower one. Once the trigger of the trend direction is made, the FollowLine will be placed at High or Low (depending of the trend). An ATR filter can be selected to place the line at a more distance level than the normal mode settled at candles Highs/Lows. Some features: + Trend detech + Reversal signal + Alert teminar / mobile app
The ICT Silver Bullet indicator is inspired from the lectures of "The Inner Circle Trader" (ICT) and highlights the Silver Bullet (SB) window which is a specific 1-hour interval where a Fair Value Gap (FVG) pattern can be formed. A detail document about ICT Silver Bullet here . There are 3 different Silver Bullet windows (New York local time): The London Open Silver Bullet (3 AM — 4 AM ~ 03:00 — 04:00) The AM Session Silver Bullet (10 AM — 11 AM ~ 10:00 — 11:00) The PM Session Silver Bullet (2
This indicator shows when user set sessions are active and returns various tools + metrics using the closing price within active sessions as an input. Users have the option to change up to 4 session times. The indicator will increasingly lack accuracy when the chart timeframe is higher than 1 hour. Settings Sessions Enable Session: Allows to enable or disable all associated elements with a specific user set session. Session Time: Opening and closing times of the user set session in the  
The liquidity swings indicator highlights swing areas with existent trading activity. The number of times price revisited a swing area is highlighted by a zone delimiting the swing areas. Additionally, the accumulated volume within swing areas is highlighted by labels on the chart. An option to filter out swing areas with volume/counts not reaching a user-set threshold is also included. This indicator by its very nature is not real-time and is meant for descriptive analysis alongside other com
OVERVIEW A Lorentzian Distance Classifier (LDC) is a Machine Learning classification algorithm capable of categorizing historical data from a multi-dimensional feature space. This indicator demonstrates how Lorentzian Classification can also be used to predict the direction of future price movements when used as the distance metric for a novel implementation of an Approximate Nearest Neighbors (ANN) algorithm. This indicator provide signal as buffer, so very easy for create EA from this indi
This script automatically calculates and updates ICT's daily IPDA look back time intervals and their respective discount / equilibrium / premium, so you don't have to :) IPDA stands for Interbank Price Delivery Algorithm. Said algorithm appears to be referencing the past 20, 40, and 60 days intervals as points of reference to define ranges and related PD arrays. Intraday traders can find most value in the 20 Day Look Back box, by observing imbalances and points of interest. Longer term traders c
An Implied Fair Value Gap (IFVG) is a three candles imbalance formation conceptualized by ICT that is based on detecting a larger candle body & then measuring the average between the two adjacent candle shadows. This indicator automatically detects this imbalance formation on your charts and can be extended by a user set number of bars. The IFVG average can also be extended until a new respective IFVG is detected, serving as a support/resistance line. Alerts for the detection of bullish/be
Consolidation is when price is moving inside a clear trading range. When prices are consolidated it shows the market maker placing orders on both sides of the market. This is mainly due to manipulate the un informed money. This indicator automatically identifies consolidation zones and plots them on the chart. The method of determining consolidation zones is based on pivot points and ATR, ensuring precise identification. The indicator also sends alert notifications to users when a new consolida
This indicator presents an alternative approach to identify Market Structure. The logic used is derived from learning material created by   DaveTeaches (on X) Upgrade v1.10: add option to put protected high/low value to buffer (figure 11, 12) When quantifying Market Structure, it is common to use fractal highs and lows to identify "significant" swing pivots. When price closes through these pivots, we may identify a Market Structure Shift (MSS) for reversals or a Break of Structure (BOS) for co
Created by imjesstwoone and mickey1984, this trade model attempts to capture the expansion from the 10:00-14:00 EST 4h candle using just 3 simple steps. All of the information presented in this description has been outlined by its creators, all I did was translate it to MQL4. All core settings of the trade model may be edited so that users can test several variations, however this description will cover its default, intended behavior using NQ 5m as an example. Step 1 is to identify our Price Ra
The Buyside & Sellside Liquidity indicator aims to detect & highlight the first and arguably most important concept within the ICT trading methodology,   Liquidity   levels. SETTINGS Liquidity Levels Detection Length: Lookback period Margin: Sets margin/sensitivity for a liquidity level detection Liquidity Zones Buyside Liquidity Zones: Enables display of the buyside liquidity zones. Margin: Sets margin/sensitivity for the liquidity zone boundaries. Color: Color option for buysid
The   Liquidation Estimates (Real-Time)   experimental indicator attempts to highlight real-time long and short liquidations on all timeframes. Here with liquidations, we refer to the process of forcibly closing a trader's position in the market. By analyzing liquidation data, traders can gauge market sentiment, identify potential support and resistance levels, identify potential trend reversals, and make informed decisions about entry and exit points. USAGE (Img 1)    Liquidation refers
The   ICT Unicorn Model   indicator highlights the presence of "unicorn" patterns on the user's chart which is derived from the lectures of   "The Inner Circle Trader" (ICT) . Detected patterns are followed by targets with a distance controlled by the user.   USAGE (image 2) At its core, the ICT Unicorn Model relies on two popular concepts, Fair Value Gaps and Breaker Blocks. This combination highlights a future area of support/resistance. A   Bullish Unicorn Pattern   consists out of:
The Inversion Fair Value Gaps (IFVG) indicator is based on the inversion FVG concept by ICT and provides support and resistance zones based on mitigated Fair Value Gaps (FVGs). Image 1   USAGE Once mitigation of an FVG occurs, we detect the zone as an "Inverted FVG". This would now be looked upon for potential support or resistance. Mitigation occurs when the price closes above or below the FVG area in the opposite direction of its bias. (Image 2) Inverted Bullish FVGs Turn into Potenti
Filtrele:
İnceleme yok
İncelemeye yanıt