ICT Immediate Rebalance Toolkit for MT5
- Göstergeler
- Sürüm: 1.0
- Etkinleştirmeler: 5

The ICT Immediate Rebalance, although frequently overlooked, emerges as one of ICT's most influential concepts, particularly when considered within a specific context. The toolkit integrates commonly used price action tools to be utilized in conjunction with the Immediate Rebalance patterns, enriching the capacity to discern context for improved trading decisions.
The ICT Immediate Rebalance Toolkit encompasses the following Price Action components:
- ICT Immediate Rebalance
- Buyside/Sellside Liquidity
- Order Blocks & Breaker Blocks
- Liquidity Voids
- ICT Macros
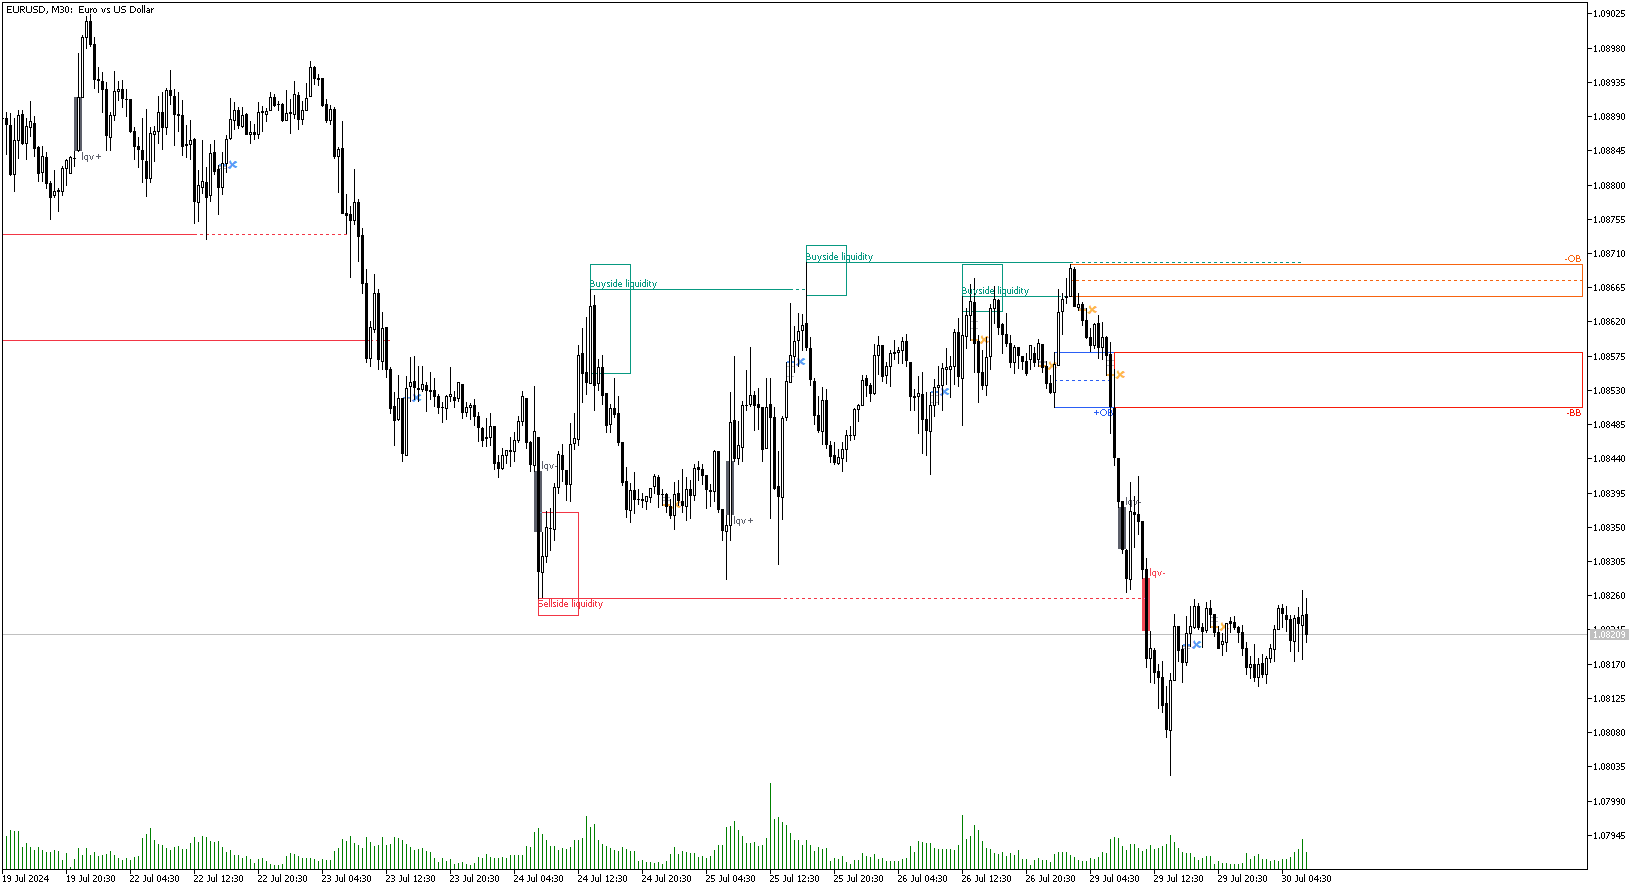
🔶 USAGE
Figure 1
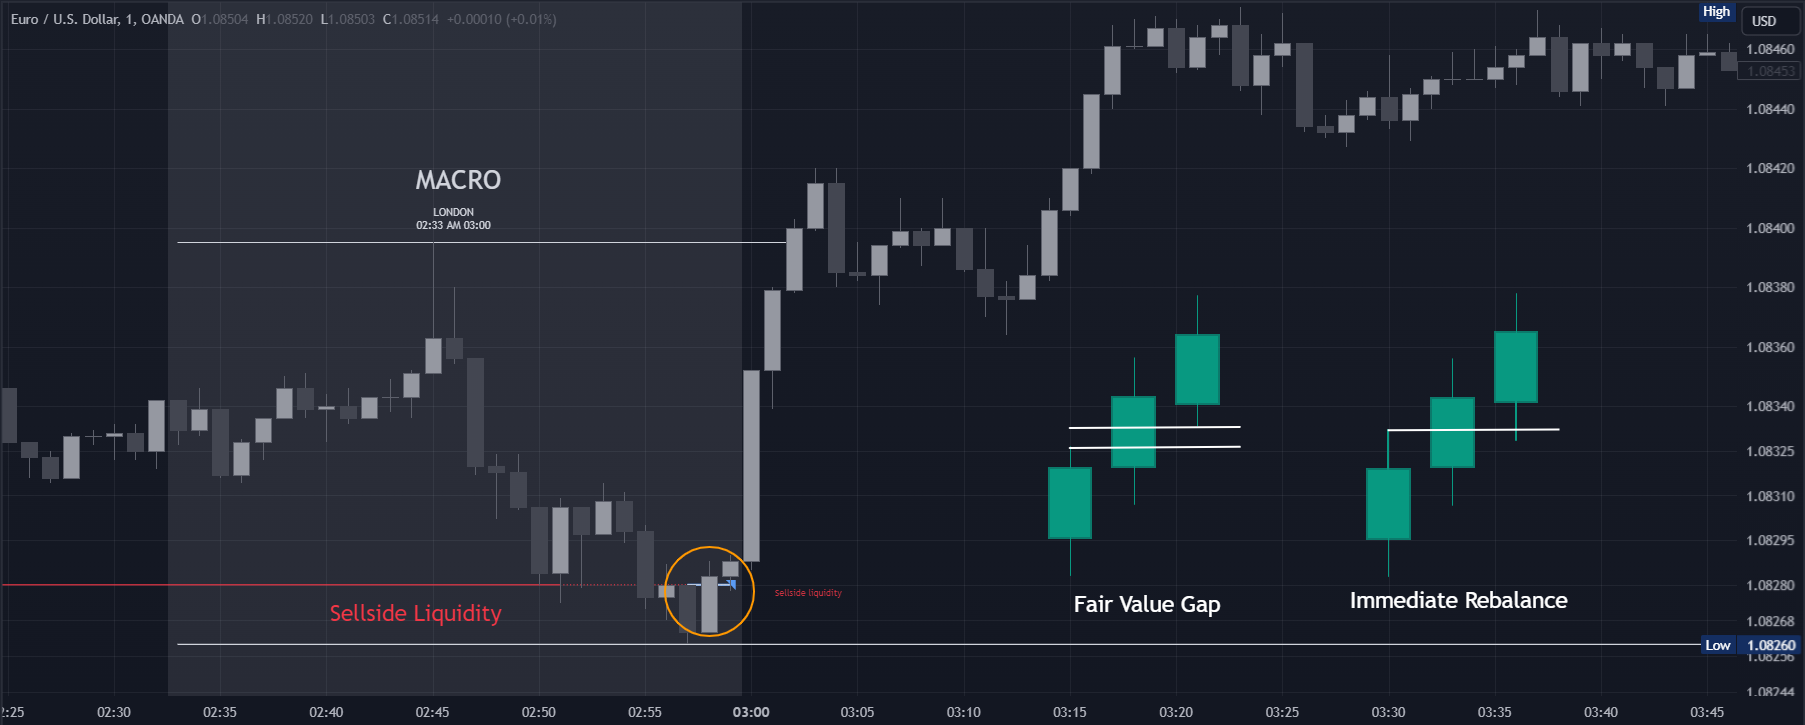
🔹 ICT Immediate Rebalance
What is an Immediate Rebalance?
Immediate rebalances, a concept taught by ICT, hold significant importance in decision-making. To comprehend the concept of immediate rebalance, it's essential to grasp the notion of the fair value gap. A fair value gap arises from market inefficiencies or imbalances, whereas an immediate rebalance leaves no gap, no inefficiencies, or no imbalances that the price would need to return to.
Figure 2
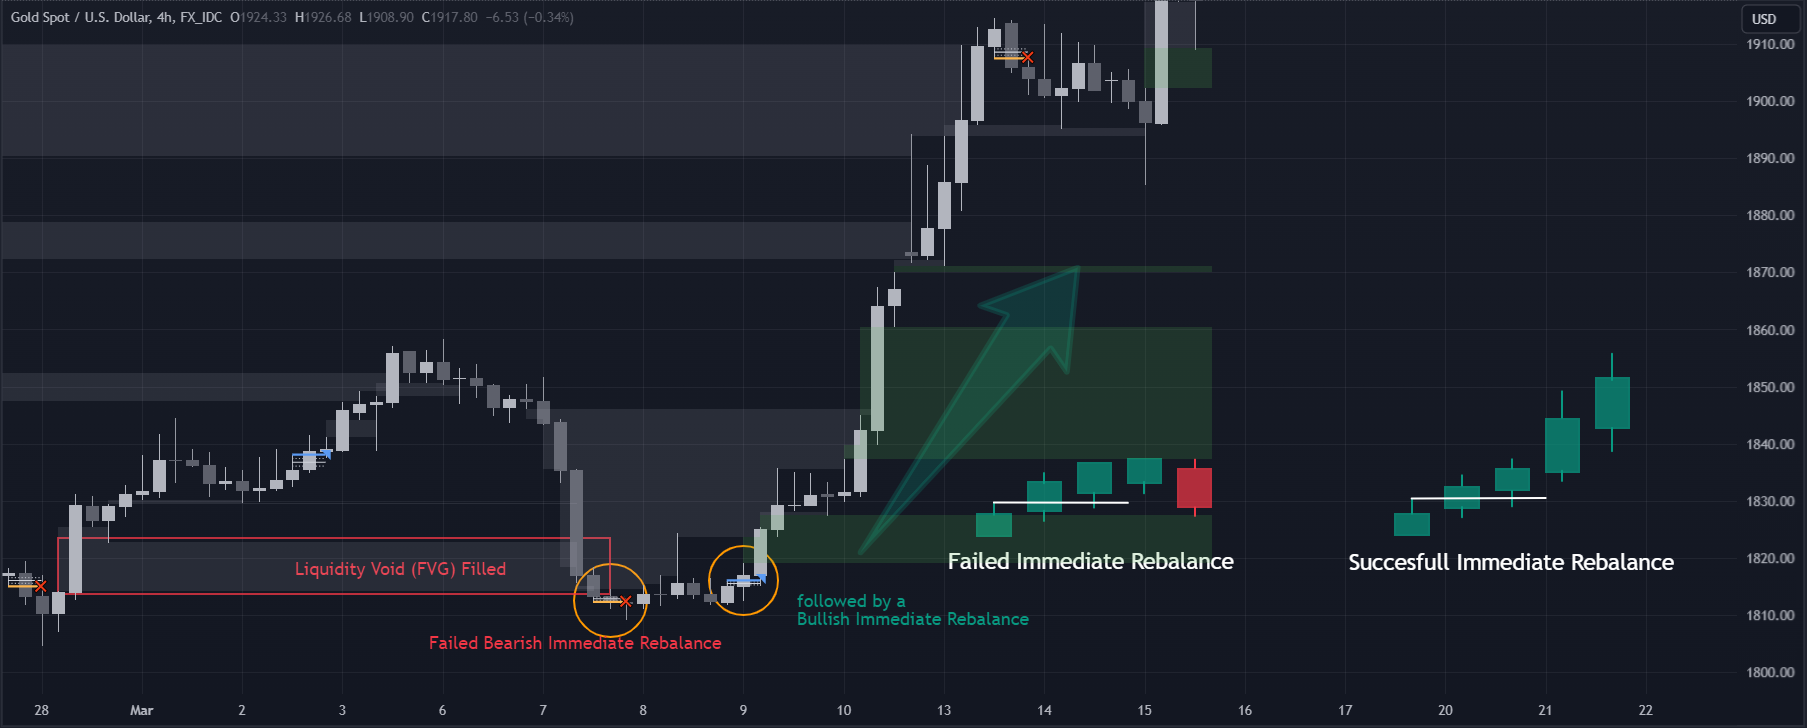
Rule of Thumb
After an immediate rebalance, the expectation is for two extension candles to follow; otherwise, the immediate rebalance is considered failed. It's important to highlight that both failed and successful immediate rebalances, when considered within a context, are significant signatures in trading.
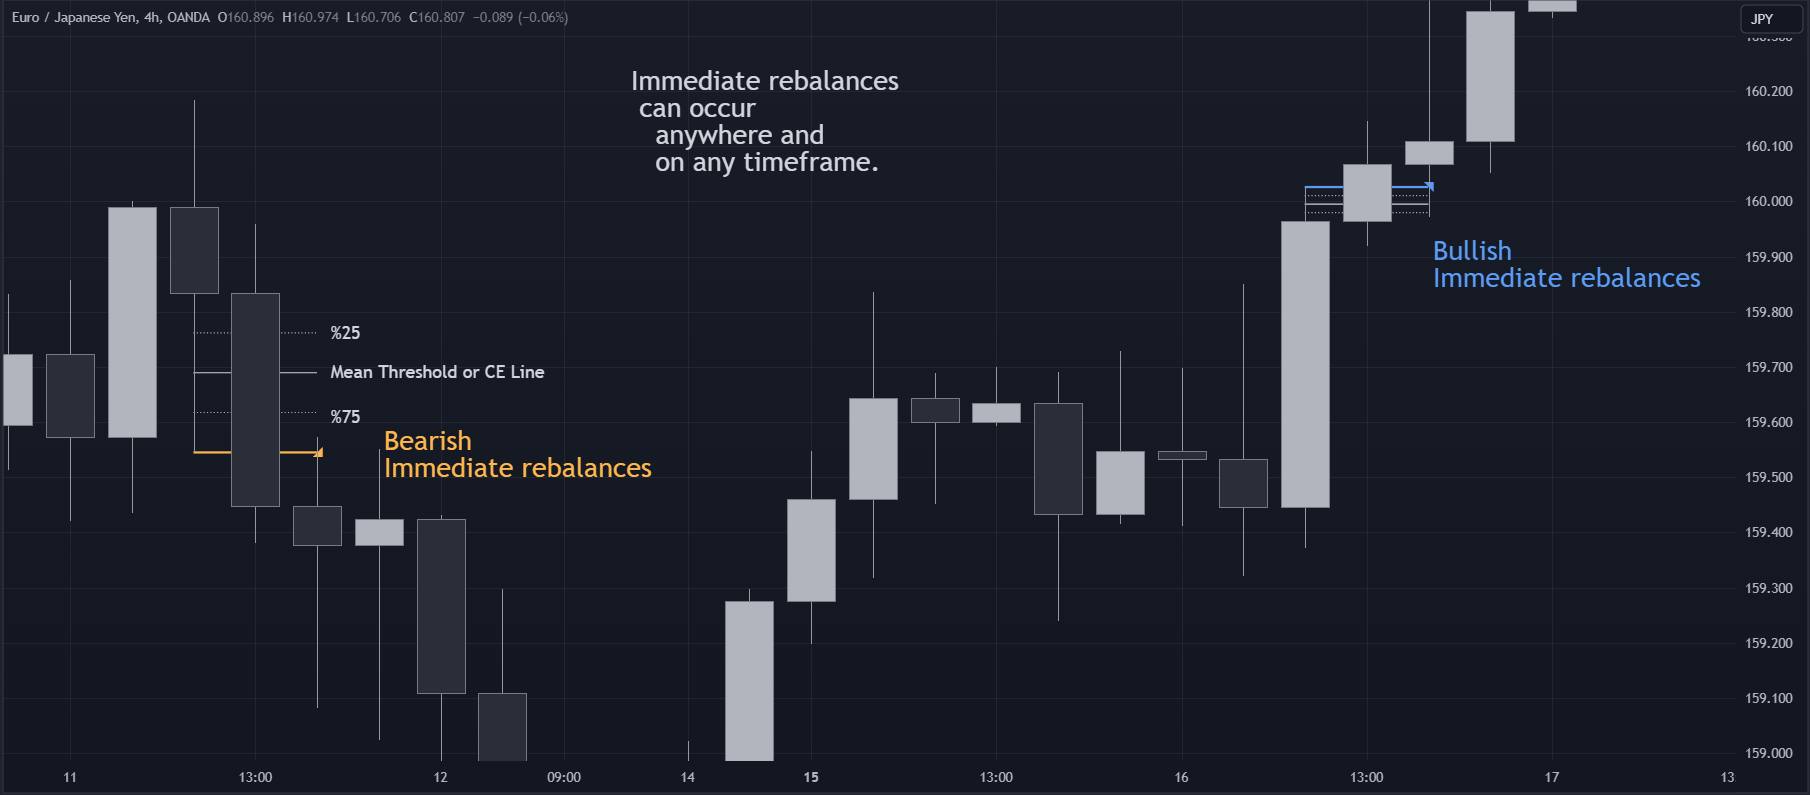
Figure 3
Immediate rebalances can occur anywhere and in any timeframe.
Figure 4
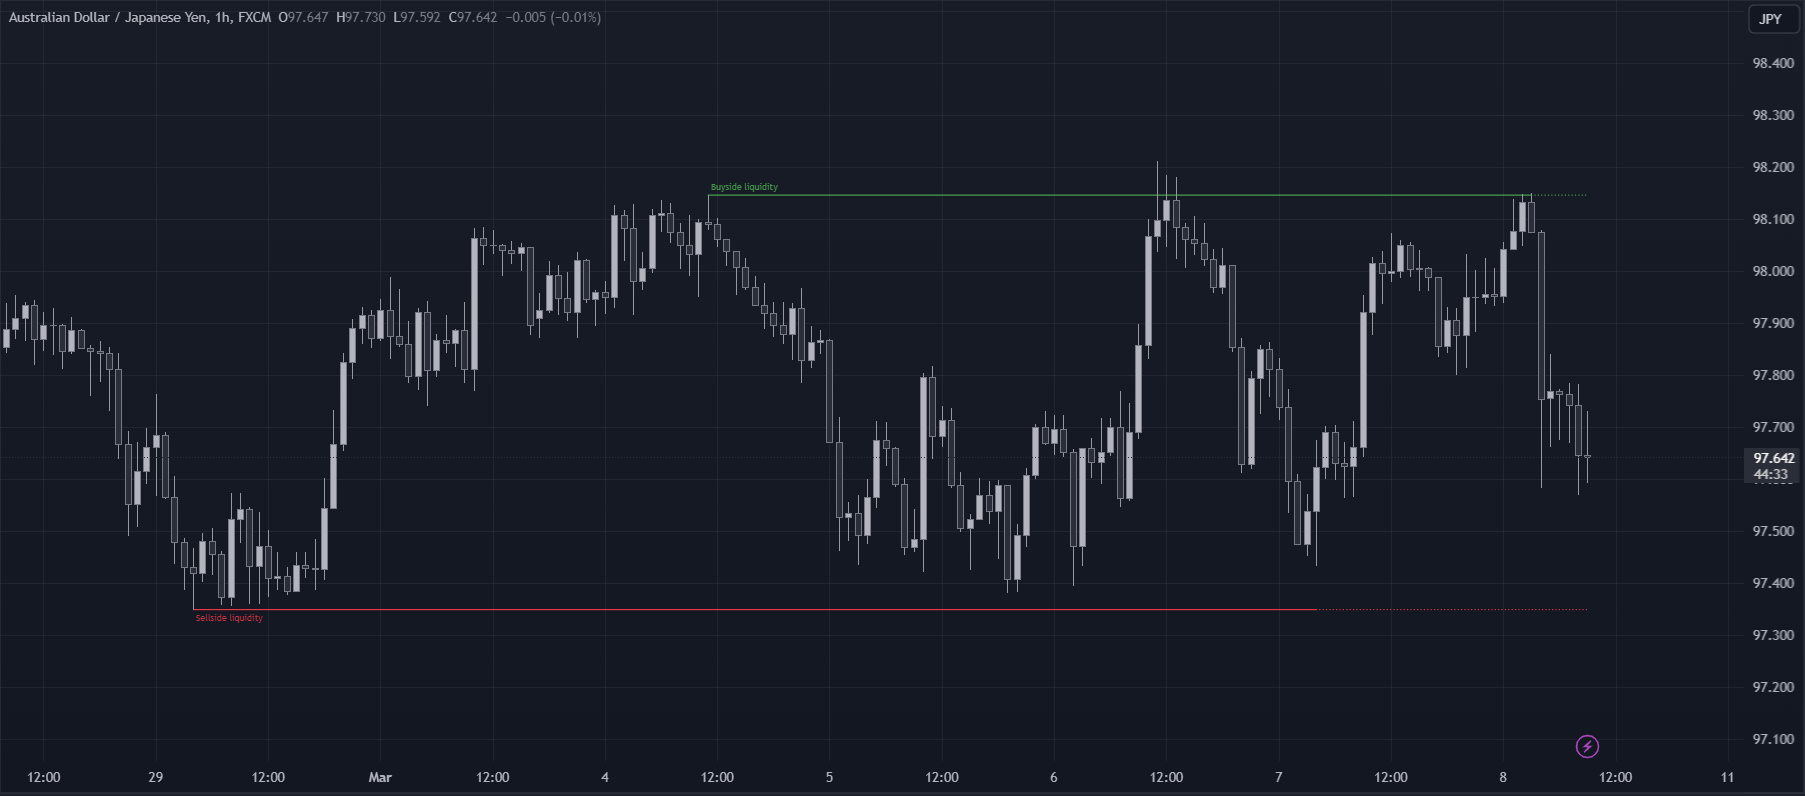
🔹 Buyside/Sellside Liquidity
In the context of Inner Circle Trader's teachings, liquidity primarily refers to the presence of stop losses or pending orders, that indicate concentrations of buy or sell orders at specific price levels. Institutional traders, like banks and large financial entities, frequently aim for these liquidity levels or pools to accumulate or distribute their positions.
Buyside liquidity denotes a chart level where short sellers typically position their stops, while Sellside liquidity indicates a level where long-biased traders usually place their stops. These zones often serve as support or resistance levels, presenting potential trading opportunities.
Figure 5
The presentation applied here is the multi-timeframe.
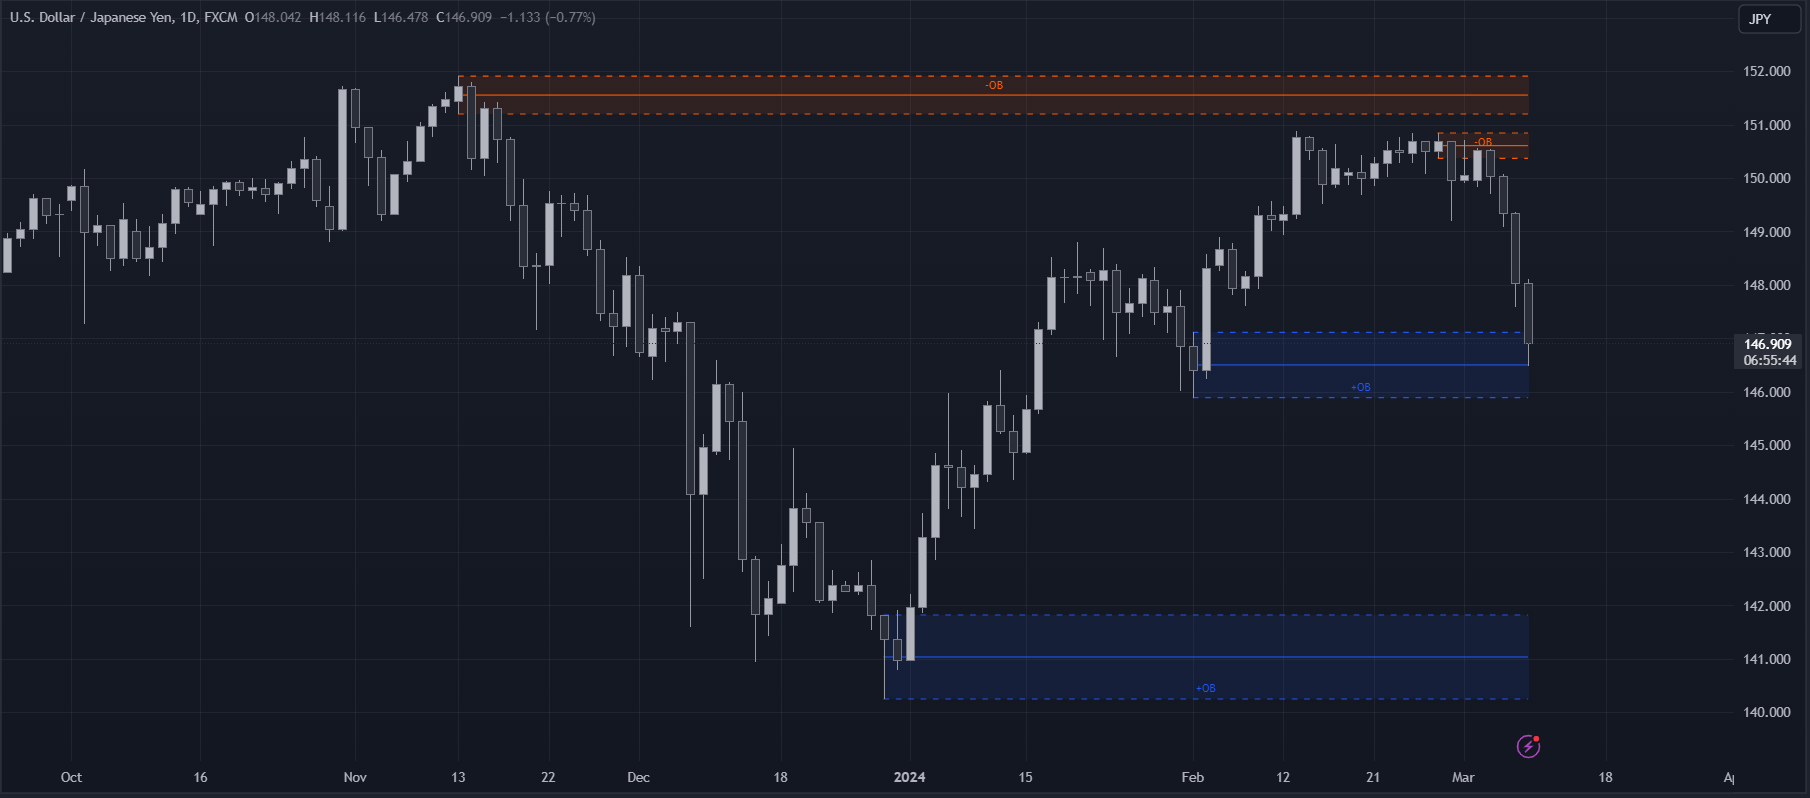
🔹 Order Blocks & Breaker Blocks
Order Blocks and Breaker Blocks hold significant importance in technical analysis and play a crucial role in shaping market behavior.
Order blocks are fundamental elements of price action analysis used by traders to identify key levels in the market where significant buying or selling activity has occurred. These blocks represent areas on a price chart where institutional traders, banks, or large market participants have placed substantial buy or sell orders, leading to a temporary imbalance in supply and demand.
Figure 6
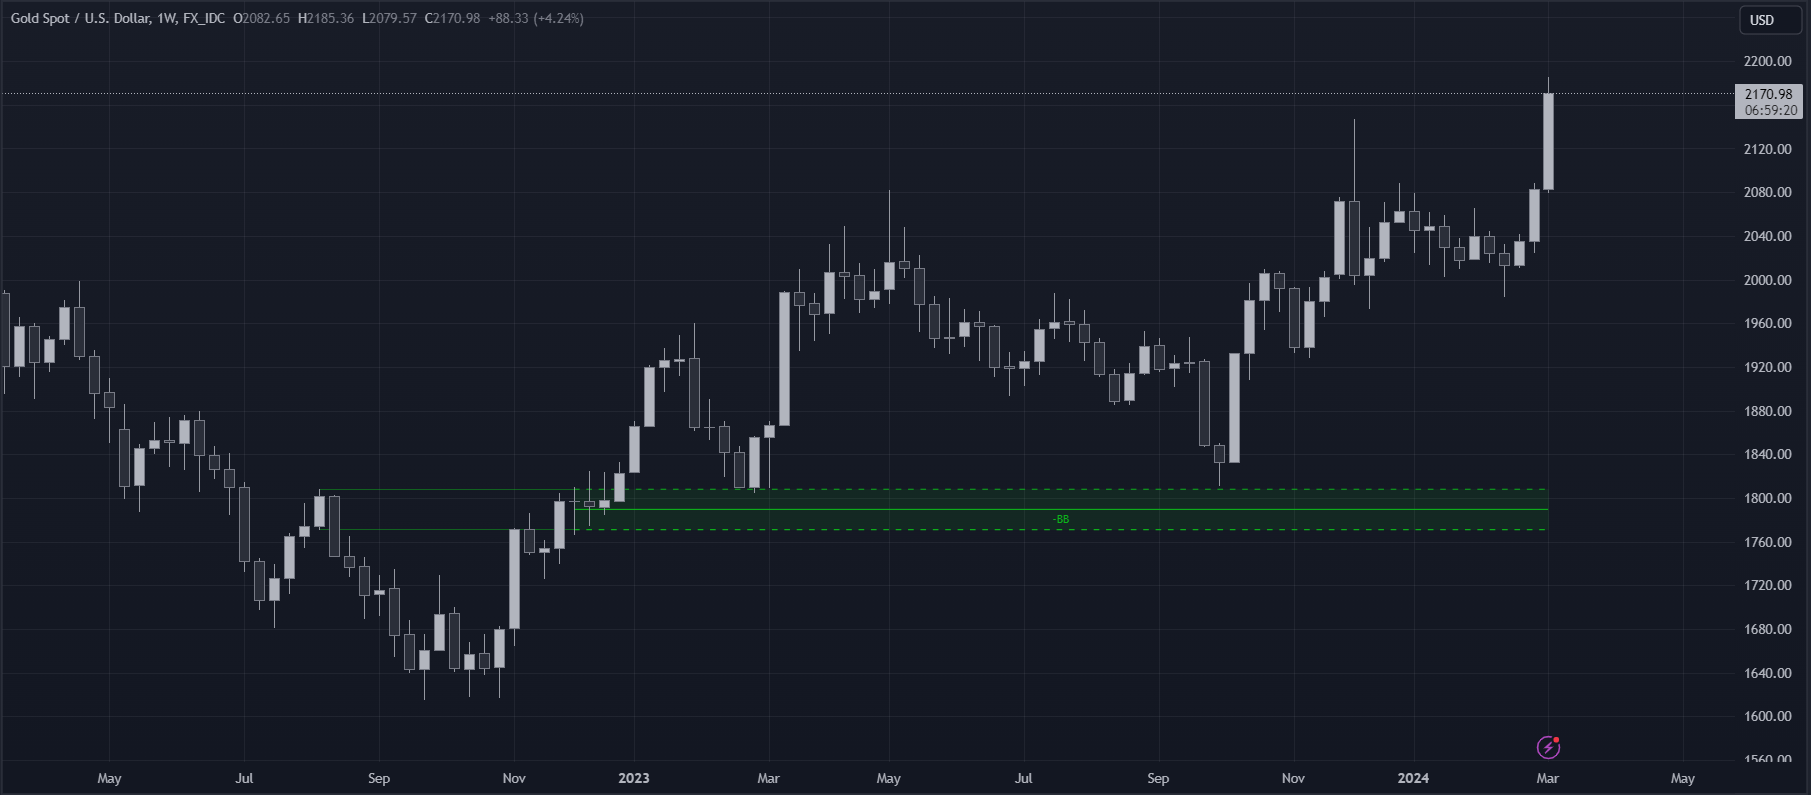
Breaker blocks, also known as liquidity clusters or pools, complement order blocks by identifying zones where liquidity is concentrated on the price chart. These areas, formed from mitigated order blocks, often act as significant barriers to price movement, potentially leading to price stalls or reversals in the future.
Figure 7
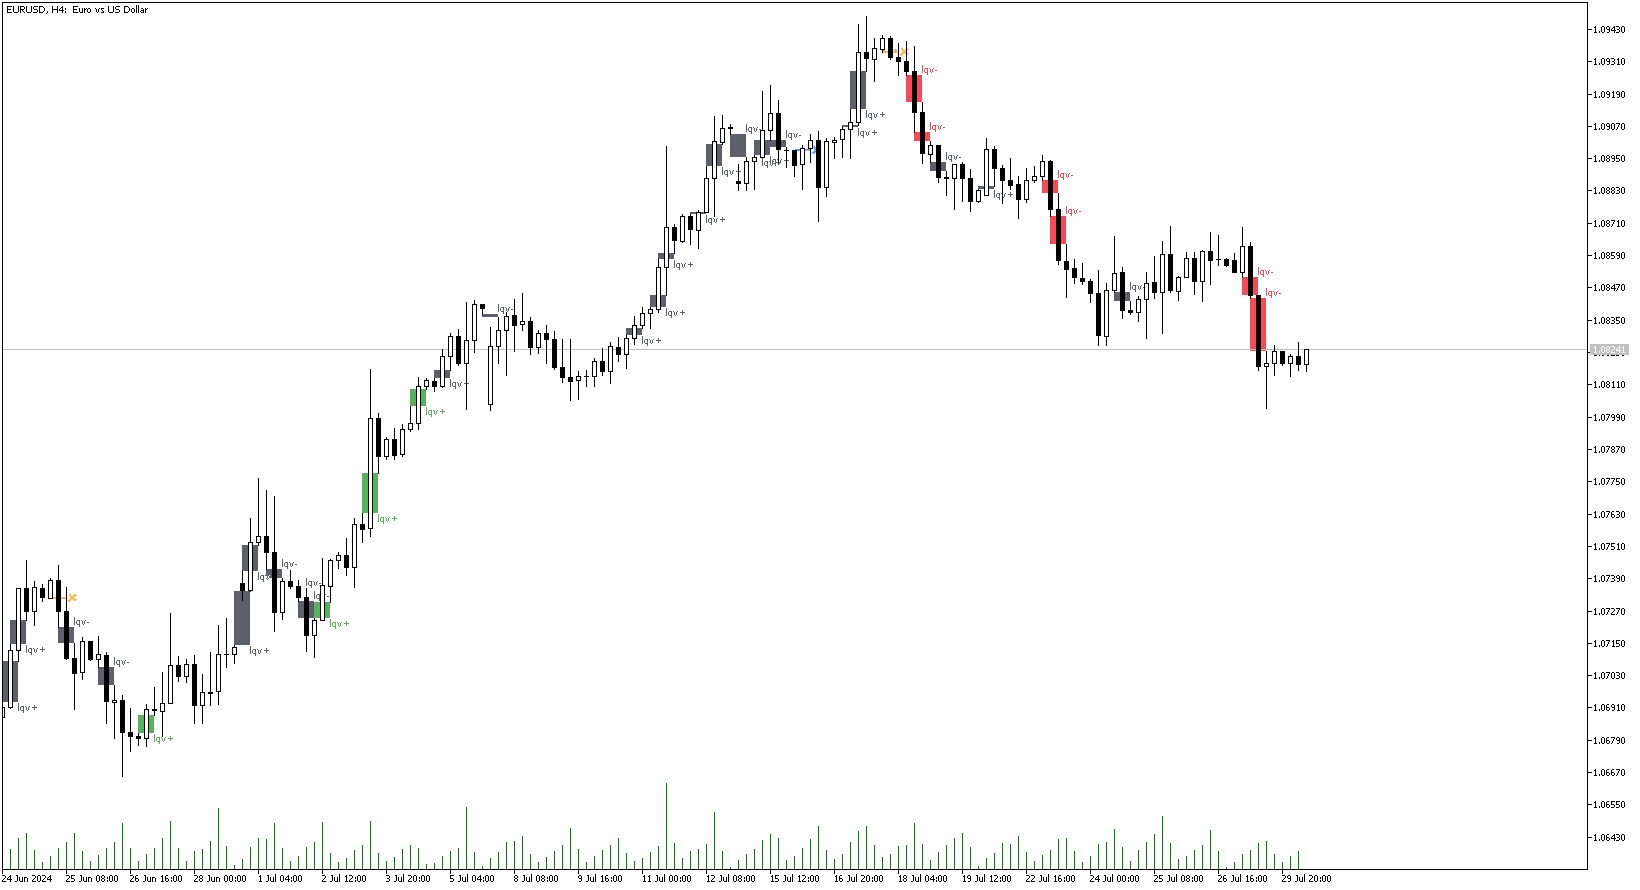
🔹 Liquidity Voids
Liquidity voids are sudden price changes when the price jumps from one level to another. Liquidity voids will appear as a single or a group of candles that are all positioned in the same direction. These candles typically have large real bodies and very short wicks, suggesting very little disagreement between buyers and sellers.
Figure 8
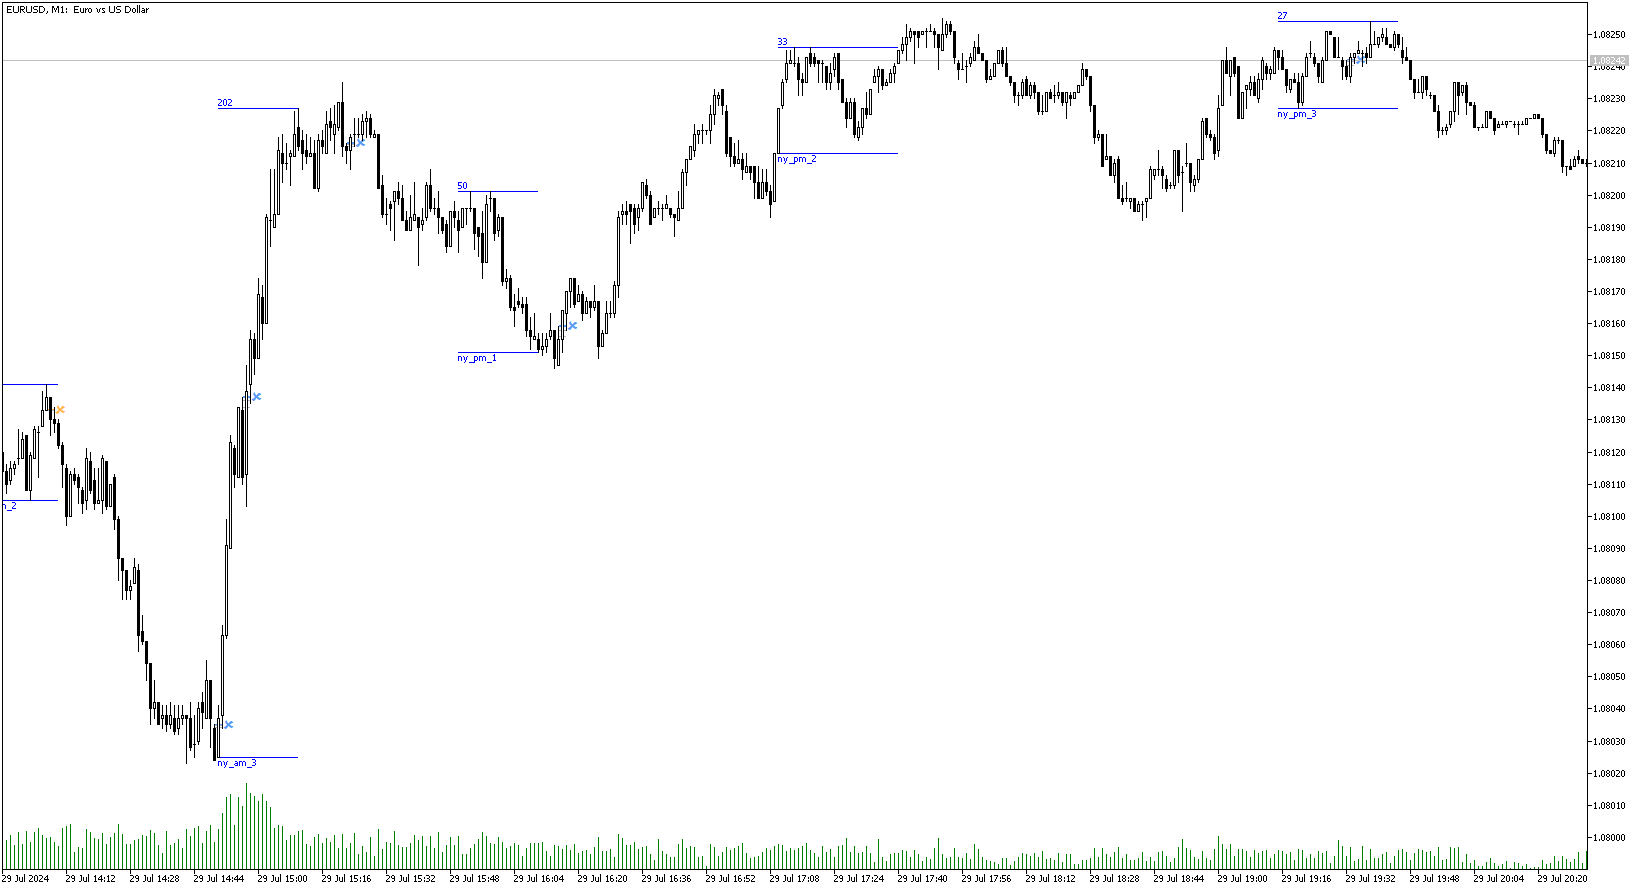
🔹 ICT Macros
In the context of ICT's teachings, a macro is a small program or set of instructions that unfolds within an algorithm, which influences price movements in the market. These macros operate at specific times and can be related to price runs from one level to another or certain market behaviors during specific time intervals. They help traders anticipate market movements and potential setups during specific time intervals.
Figure 9
🔶 SETTINGS🔹 Immediate Rebalances
- Immediate Rebalances: toggles the visibility of the detected immediate rebalance patterns.
- Bullish, and Bearish Immediate Rebalances: color customization options.
- Wicks 75%, %50, and %25: color customization options of the wick price levels for the detected immediate rebalance.
- Ignore Price Gaps: ignores price gaps during calculation.
- Confirmation (Bars): specifies the number of bars required to confirm the validation of the detected immediate rebalance.
- Immediate Rebalance Icon: allows customization of the size of the icon used to represent the immediate rebalance.
🔹 Buyside/Sellside Liquidity
- Buyside/Sellside Liquidity: toggles the visibility of the buy-side/sell-side liquidity levels.
- Timeframe: this option is to identify liquidity levels from higher timeframes. If a timeframe lower than the chart's timeframe is selected, calculations will be based on the chart's timeframe.
- Detection Length: lookback period used for the detection.
- Margin: sets margin/sensitivity for the liquidity levels.
- Buyside/Sellside Liquidity Color: color customization option for buy-side/sell-side liquidity levels.
- Visible Liquidity Levels: allows customization of the visible buy-side/sell-side liquidity levels.
🔹 Order Blocks & Breaker Blocks
- Order Blocks: toggles the visibility of the order blocks.
- Breaker Blocks: toggles the visibility of the breaker blocks.
- Swing Detection Length: lookback period used for the detection of the swing points used to create order blocks & breaker blocks.
- Mitigation Price: allows users to select between the closing price or the wick of the candle.
- Use Candle Body in Detection: allows users to use candle bodies as order block areas instead of the full candle range.
- Remove Mitigated Order Blocks & Breaker Blocks: toggles the visibility of the mitigated order blocks & breaker blocks.
- Order Blocks: Bullish, Bearish Color: color customization option for order blocks.
- Breaker Blocks: Bullish, Bearish Color: color customization option for breaker blocks.
- Visible Order & Breaker Blocks: allows customization of the visible order & breaker blocks.
- Show Order Blocks & Breaker Blocks Labels: toggles the visibility of the order blocks & breaker blocks labels.
🔹 Liquidity Voids
- Liquidity Voids: toggles the visibility of the liquidity voids.
- Liquidity Voids Width Filter: filtering threshold while detecting liquidity voids.
- Ignore Price Gaps: ignores price gaps during calculation.
- Remove Mitigated Liquidity Voids: remove mitigated liquidity voids.
- Bullish, Bearish, and Mitigated Liquidity Voids: color customization option..
- Liquidity Void Labels: toggles the visibility of the liquidity voids labels.
🔹 ICT Macros
- London and New York (AM, Launch, and PM): toggles the visibility of specific macros, allowing users to customize macro colors.
- Macro Top/Bottom Lines, Extend: toggles the visibility of the macro's pivot high/low lines and allows users to extend the pivot lines.
- Macro Labels: toggles the visibility of the macro labels.