Fan sayfamıza katılın
Öyleyse bir link gönderin -
başkalarının da faydalanmasını sağlayın
- Görüntülemeler:
- 143
- Derecelendirme:
- Yayınlandı:
-
Bu koda dayalı bir robota veya göstergeye mi ihtiyacınız var? Freelance üzerinden sipariş edin Freelance'e git
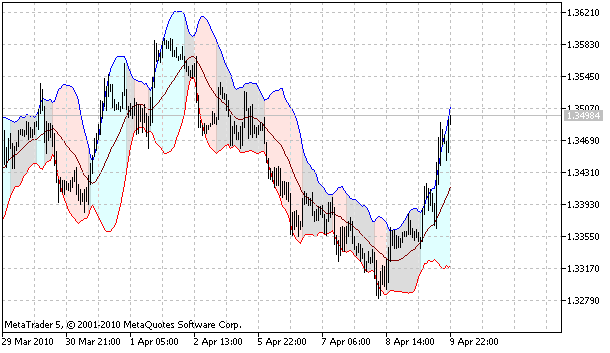
Gösterge boyalı (doldurulmuş)Bollinger Bantları ® ( BB) çizer.
Fiyat üst sınırı geçerse (yukarı trendin başlangıcı olarak kabul edilir), bantlar mavi renkle, aşağı ise (aşağı trendin başlangıcı olarak kabul edilir) - pembe renkle doldurulur.
Trend üzerindeki merkezi çizginin geçilmesi düzlüğün başlangıcı anlamına gelir - gri ile doldurulmuştur.

- BBPeriod - BB periyodu;
- BBDeviation - BB genişliği;
- BBPrice - BB fiyatı.
MetaQuotes Ltd tarafından Rusçadan çevrilmiştir.
Orijinal kod: https://www.mql5.com/ru/code/98
 iMovment
Hareket göstergesi, hareketin yönüne ve büyüklüğüne bağlı olarak farklı renk ve tonlarda çubuklar görüntüler.
 Üçgen Arbitraj
Bu Uzman Danışman (EA) üç döviz çifti arasında üçgen bir arbitraj stratejisi uygular: EURUSD, USDJPY ve EURJPY
 XmlParser
msxml standart kütüphanesini kullanan basit bir XML ayrıştırıcı.
 SignalAI - Indicator
Bu Gösterge Alış veya Satış Sinyalini gösterir