당사 팬 페이지에 가입하십시오
- 조회수:
- 13927
- 평가:
- 게시됨:
- 2010.04.12 11:18
- 업데이트됨:
- 2016.11.22 07:32
-
이 코드를 기반으로 한 로봇이나 지표가 필요하신가요? 프리랜스로 주문하세요 프리랜스로 이동
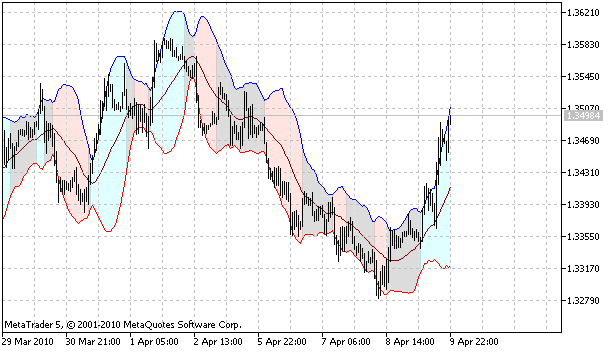
The indicator plots the Bollinger Bands ®, filled with different colors depending on the trend direction.
If the price crosses the upper bound (upward trend), the Bollinger Bands fills with blue color, if it crosses the lower bound (downward trend), the Bands filled with pink color.
If the price crosses the middle line, it's considered as a flat, and the Bands filled with grey color.
Input parameters:
- BBPeriod - Bollinger Bands period;
- BBDeviation - Bollinger Bands width (in deviations);
- BBPrice - Bollinger Bands applied price.
MetaQuotes Ltd에서 러시아어로 번역함.
원본 코드: https://www.mql5.com/ru/code/98

The indicator plots the candles with different colors depending on the trend direction and price movement.

This indicator draws pivot points, resistances and supports.

A simple XML-parser, based on the msxml library.

The ZeroLag MACD indicator shows the histogram with color of the previous bar.