Unisciti alla nostra fan page
- Visualizzazioni:
- 121
- Valutazioni:
- Pubblicato:
-
Hai bisogno di un robot o indicatore basato su questo codice? Ordinalo su Freelance Vai a Freelance
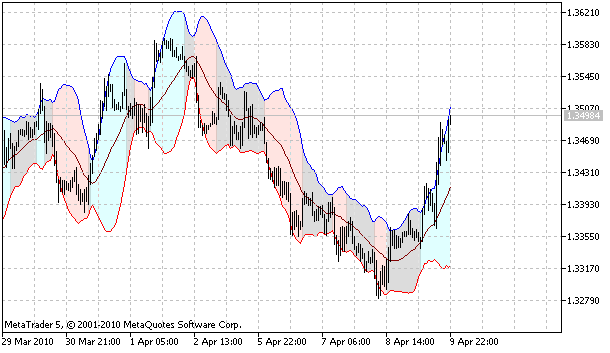
L'indicatore disegna leBande di Bollinger ®(BB) dipinte (riempite).
Se il prezzo supera il limite superiore (considerato come l'inizio della tendenza al rialzo), le bande sono riempite di colore blu, mentre se scende (considerato come l'inizio della tendenza al ribasso) - di colore rosa.
L'attraversamento della linea centrale del trend significa l'inizio di una fase piatta - riempita in grigio.

- BBPeriod - Periodo BB;
- BBDeviation - ampiezza del BB;
- BBPrice - prezzo BB.
Tradotto dal russo da MetaQuotes Ltd.
Codice originale https://www.mql5.com/ru/code/98
 iMovment
L'indicatore di movimento visualizza barre di diversi colori e sfumature a seconda della direzione e dell'entità del movimento.
 Trend Zigzag (on ma cross)
Uno zigzag statico che collega le intersezioni di un crossover della media mobile
 XmlParser
Un semplice parser XML che utilizza la libreria standard msxml.
 SignalAI - Indicator
Questo indicatore mostra un segnale di acquisto o di vendita