Kimimaki Onyx

KIMIMAKI ONYX — PRECISION MOMENTUM INDICATOR

Master Momentum Entry. for MT5 x TradingView

One Indicator. Multiple Market Conditions. A More Structured Approach to Trading.

KIMIMAKI ONYX is an advanced semi-automatic trading indicator designed to help traders analyze market movements, identify potential entry opportunities, and make more structured trading decisions.

Whether you are a scalper, day trader, swing trader, or long-term trader, KIMIMAKI ONYX provides a comprehensive set of signals and analytical tools to support your trading approach across different timeframes and market conditions.

Instead of relying on a single signal, ONYX combines multiple layers of market information to help you evaluate momentum shifts, trend continuation, breakouts, and potential reversal opportunities.


WHY KIMIMAKI ONYX?

Multi-Level BUY & SELL Signals

Identify potential trading opportunities through B1–B5 BUY and S1–S5 SELL signals. Multiple signal levels provide additional information to help you evaluate market conditions rather than relying on a single entry indication.

Momentum & Re-Entry Opportunities

RB (Re-Buy) and RS (Re-Sell) signals help you monitor potential continuation opportunities as price movements develop.

Breakout Detection

Monitor potential breakout movements through SBB, SBO, FBB, and FBS signals. These tools help you observe important price breaks and evaluate potential opportunities when market structure changes.

Divergence Analysis

Bullish and bearish divergence signals help you identify potential differences between price movement and momentum, providing additional context when evaluating possible market reversals.

ATR-Based Confirmation

ATR UP and ATR DOWN signals provide additional directional context through ATR trailing-stop logic, helping you assess market movement alongside other indicator signals.

Advanced Chart Information

The integrated Chart Table displays relevant information such as active BUY/SELL status, entry references, running points, and Take It levels. The Cross Tracker panel also provides K/D values and NEXT threshold information to support your analysis.


DESIGNED FOR DIFFERENT TRADING STYLES

KIMIMAKI ONYX is designed to support different trading approaches, depending on your strategy, timeframe, and risk management.

Scalping: Analyze short-term price movements and evaluate potential entry opportunities.

Day Trading: Monitor intraday momentum, breakouts, and changing market conditions.

Swing Trading: Evaluate potential continuation and reversal opportunities across larger price movements.

Long-Term Trading: Use higher timeframes to study broader market direction and potential trading setups.

KIMIMAKI ONYX can be used to analyze various markets, including forex, gold, indices, and cryptocurrency, depending on your charting platform and data availability. You can adapt your analysis to different timeframes, although signal behavior and effectiveness may vary between markets and market conditions.

MORE THAN JUST BUY & SELL SIGNALS

KIMIMAKI ONYX is designed to help you approach trading with greater structure and clarity. Rather than encouraging you to enter every signal blindly, it provides multiple layers of information that you can evaluate before making a decision. Combine its signals, confirmations, market context, and your own trading rules to develop a more disciplined trading approach. The indicator assists your analysis. You remain in control of your trades.

KIMIMAKI ONYX is a semi-automatic trading indicator, not an automatic trading bot. It does not execute trades for you. You analyze the information, decide whether an opportunity fits your strategy, and execute manually.

TRADE WITH STRUCTURE. ANALYZE WITH PRECISION.

If you are looking for an indicator that combines multiple signal types, momentum analysis, breakout monitoring, divergence, and ATR-based directional context in one system, KIMIMAKI ONYX is built to support your trading workflow.


KIMIMAKI ONYX

TRADING INDICATOR — USER GUIDE

GUIDE TO UNDERSTANDING THE KIMIMAKI ONYX SYSTEM

1. Introducing KIMIMAKI ONYX

KIMIMAKI ONYX is a semi-automatic trading indicator designed to help traders read price movements through

various signals, scores, and additional confirmations.

The system helps users identify potential BUY, SELL, breakout, re-entry, divergence, and ATR-based directional

changes. Rather than looking at candlesticks alone, traders receive additional information to support their market

analysis.

2. B1–B5 Signals — BUY

B1, B2, B3, B4, and B5 are the BUY signal group.

These signals appear when the indicator detects conditions that meet its BUY criteria. The number following the letter

B represents the signal score generated by the system.

• B1–B2: BUY signals with an initial-level score.

• B3: BUY signal with a mid-level score.

• B4–B5: BUY signals with higher scores.

The score helps traders distinguish between signal assessments based on the indicator’s calculations. For a more

complete view of a potential opportunity, traders can also consider price direction and other available confirmations.

3. S1–S5 Signals — SELL

S1, S2, S3, S4, and S5 are the SELL signal group.

These signals appear when the indicator detects conditions that meet its SELL criteria.

• S1–S2: SELL signals with an initial-level score.

• S3: SELL signal with a mid-level score.

• S4–S5: SELL signals with higher scores.

SELL signals help traders identify potential downward movement. In addition to the score, users can examine

confirmations and price direction to better understand market conditions.

4. RB Signal — Re-Buy

RB is a signal associated with a potential opportunity to BUY again.

It helps traders watch for a possible continuation of upward movement based on the conditions detected by the

system.

5. RS Signal — Re-Sell

RS is a signal associated with a potential opportunity to SELL again.

It helps traders watch for a possible continuation of downward movement based on the conditions detected by the

system.

RB and RS provide additional information for assessing subsequent opportunities, rather than focusing only on the

initial BUY or SELL signal.

6. SBB and SBO Signals — Breakout

SBB and SBO relate to price-level breakouts detected by the system.

• SBB: marks a break below a level according to the indicator’s logic.

KIMIMAKI ONYX — Trading Indicator User Guide Page 2

• SBO: marks a break above a level according to the indicator’s logic.

Breakout information helps traders notice when price moves beyond a particular level. Traders can compare it with

price direction and other signals that appear.

7. FBB and FBS Signals — Fractal Break

FBB and FBS relate to fractal patterns and price-level breakouts.

These signals can help traders observe changes in price structure and potential movement after a particular level has

been breached.

FBB or FBS may also be used as additional confirmation when evaluating other signals. Consider whether the

signal’s direction and position align with the opportunity being analyzed.

8. DIV BUY Signal — Bullish Divergence

DIV BUY indicates bullish divergence: price forms a lower low while the comparison indicator forms a higher low.

This condition may suggest that downward momentum is weakening and that potential upward movement deserves

attention.

9. DIV SELL Signal — Bearish Divergence

DIV SELL indicates bearish divergence: price forms a higher high while the comparison indicator forms a lower high.

This condition may suggest that upward momentum is weakening and that potential downward movement deserves

attention.

Divergence helps traders observe differences between price movement and indicator momentum as additional

information for analysis.

10. ATR UP and ATR DOWN Signals

ATR is part of the system that helps determine direction using ATR trailing-stop logic.

• ATR UP: indicates an upward direction based on the indicator’s ATR conditions.

• ATR DOWN: indicates a downward direction based on the indicator’s ATR conditions.

ATR information can be used to compare market direction with other BUY or SELL signals.

Under certain confirmation rules, SELL signals with scores S3, S4, or S5 may wait for the next ATR DOWN signal as

confirmation. In these conditions, the system considers not only the initial SELL signal but also waits for an additional

indication according to its predefined rules.

11. Understanding Scores and Signal Combinations

One important point when using KIMIMAKI ONYX is that analysis should not focus on the score alone.

The score is one piece of information provided by the system. A lower-scoring signal may still be worth analyzing

when supported by other relevant confirmations.

For example, a trader may see a BUY signal with a relatively low score. If an FBB or ATR UP signal subsequently

appears in the same direction and aligns with price conditions, that combination may provide an additional reason to

consider the BUY opportunity.

Similarly, a SELL opportunity can be analyzed alongside FBS or ATR DOWN when the confirmations fit market

conditions.

The core principle is to read the relationships between signals, rather than viewing each label in isolation.

Pay attention to:

• The direction of the primary signal: BUY or SELL.

• The score displayed by the indicator.

• Additional confirmations such as FBB, FBS, and ATR.

KIMIMAKI ONYX — Trading Indicator User Guide Page 3

• Market conditions and the direction of price movement.

By understanding these relationships, users can learn to interpret the system in a more structured way.

12. How to Use KIMIMAKI ONYX

KIMIMAKI ONYX is a semi-automatic indicator. The system provides information through signals and visual displays,

while the trader remains responsible for the final analysis and manual trade execution.

The workflow is as follows:

First, observe the signals appearing on the chart.

Second, identify the type of signal and the direction of the potential opportunity it indicates.

Third, review the score and any available additional confirmations.

Fourth, assess whether the signals align with current price movement.

Fifth, use this information as one input before making a trading decision.

13. UNDERSTANDING THE CHART TABLE AND INDICATOR TABLE

In addition to displaying various signals, KIMIMAKI ONYX includes information panels that help users monitor system

conditions more conveniently.

There are two areas to understand: the information displayed on the chart and the information panel in the indicator

area.

A. CHART TABLE — INFORMATION ON THE CHART

The Chart Table is an information panel displayed in the chart area. Its purpose is to help users monitor

active-position information and price movement progress based on the system’s logic.

1. BUY or SELL Status

This panel helps show the direction of the position currently recorded by the system: BUY or SELL. The active signal

name may be displayed—for example, B3, S4, RB, RS, SBB, or SBO—depending on the signal detected.

This information helps users identify which signal is being used as the reference for the system’s active status.

2. Entry Information

The system records the price when the active signal status is updated. This information serves as the reference price

for calculating subsequent price movement within the system.

3. Running Points

This section shows the change in price from the reference price of the active position, displayed in points.

A positive value indicates that price has moved in the direction of the recorded position, while a negative value

indicates movement against that position.

4. Take It

The Take It section shows the target-point levels used in the system display. Users can view point progress and the

levels reached according to the indicator’s calculations.

In short, the chart panel displays the signal status, reference price, point movement, and Take It level information in

one place.

B. INDICATOR TABLE — KIMIMAKI ONYX INFORMATION PANEL

In the indicator area, KIMIMAKI ONYX displays an information panel with a dark design and platinum accents. This

panel provides additional information about indicator conditions and guidance for reading system movement.

KIMIMAKI ONYX — Trading Indicator User Guide Page 4

1. KIMIMAKI ONYX Header

The top of the panel displays the KIMIMAKI ONYX identity. This header identifies the indicator’s information panel.

2. Indicator Condition Information

The panel uses the indicator’s internal information to show conditions related to price movement and signals.

This information helps users understand the indicator’s state without having to examine each calculation component

separately.

3. Cross Tracker

Cross Tracker helps users monitor the position of indicator-line crossings and progress toward the next potential

crossing.

It includes information such as K and D values, the K value needed to reach a certain threshold, and the distance

from the last crossing measured in candles.

This feature helps users understand the indicator’s position relative to the conditions required by the system before a

crossing occurs.

4. NEXT Information

The NEXT section provides guidance on the next threshold being monitored by Cross Tracker.

This information helps users see how close the indicator value is to the crossing condition being monitored.

5. Visual Display and Status

The panel uses visual elements such as colors, dots, lines, and level-based indicators to make information easier to

read.

Changes in the display help users distinguish key information, currently active statuses, and conditions that are still

waiting for further development.

C. HOW TO READ BOTH PANELS

To understand KIMIMAKI ONYX more easily, use each panel according to its purpose.

First, observe the signals appearing on the chart.

Second, check the chart panel to understand the active signal status, reference price, Running Points, and Take It.

Third, review the indicator panel and Cross Tracker to understand the K and D values and progress toward the next

crossing.

Fourth, connect this information with the BUY, SELL, FBB, FBS, and ATR signals available in the system.

By understanding both panels, users can interpret KIMIMAKI ONYX’s information more systematically, from the

signals on the chart to the underlying indicator conditions.

With this workflow, KIMIMAKI ONYX helps traders read the market in a more structured way instead of relying only

on direct candlestick observation.

DISCLAIMER

KIMIMAKI ONYX is a trading analysis tool. Scores and signal combinations are intended to help evaluate

opportunities; they do not guarantee any particular trading outcome. Every trading decision remains the user’s

responsibility.

Рекомендуем также
[b]Titan Pro V7 Institutional Dashboard[/b] is an advanced quantitative HUD terminal engineered for MetaTrader 5, designed for institutional market analysis, quantitative prop-firm verification, and disciplined intraday execution. Unlike conventional single-formula indicators that suffer from lag and market regime shifts, Titan Pro V7 synthesizes a multi-strategy quantitative consensus model combining Trend Momentum, Volatility Breakout, Intraday VWAP, and Smart Money Concepts (SMC) into a sin
Представляем революционный индикатор MT5, DARWIN Assistant   - ваши врата в мир успешной торговли! Разработанный с точностью и опытом, DARWIN Assistant   работает по специальной стратегии, которая использует мощь передовых технических индикаторов - RSI, Stochastics, CCI и Trends - на всех временных интервалах. Приготовьтесь к экстраординарному торговому опыту, поскольку этот передовой индикатор предлагает вам самые точные сигналы для входа, позволяя вам ориентироваться на рынках с непревзойденн
Простыми словами Это индикатор, который объединяет двух экспертов — RSI и MACD — в одну систему. Вместо того чтобы смотреть на два разных графика и гадать, он сам принимает решение: когда оба индикатора согласны, он рисует стрелку (покупка или продажа). Главное: стрелки не перерисовываются . Появилась — значит, останется на месте. Можно спокойно тестировать и торговать вживую. В чём суть «комбо» Обычно трейдеры смотрят на RSI (силу движения) и MACD (направление тренда) по отдельности. Здесь они
HAWK 4.0 — ИНДИКАТОР СИГНАЛОВ ЗОЛОТА Самый точный сигнальный индикатор для торговли XAUUSD (Золото). Основан на ATR полосах + Pivot детекции. Сигналы появляются только в точках реального разворота цены. Не перерисовывает. Без задержки. Без шума. ЧТО ВЫ ПОЛУЧАЕТЕ → Чёткие стрелки BUY / SELL → Авто уровни TP1 / TP2 / TP3 → Авто уровень SL → Встроенный фильтр времени (UTC) → Статистика успешности в реальном времени → Полная система оповещений
Volume Arrow Signal Product Description Volume Arrow Signal is a smart trading indicator designed to help traders identify potential buy and sell opportunities using price action, volume behavior, and directional arrow signals. The indicator places clear arrows directly on the chart, making it easy to spot possible market reversals, trend continuations, and entry opportunities without spending hours analyzing charts manually. Whether you are trading Gold (XAUUSD) , Forex pairs, Indices, or Crypt
SMC Institutional Suite v3.7 Professional Smart Money Concept Indicator for MetaTrader 5 What is New in Version 3.7 - Visual Stability Update This release focuses entirely on one goal: making every zone, label, and line on your chart rock-solid stable. There is no more flickering, no more zones disappearing on a new candle, and no more duplicate drawings. Order Block (OB) zones no longer flicker or disappear. Once drawn, they stay permanently on the chart. Equal Highs and Equal Lows (EQH / EQL)
RBreaker Gold Indicators — это краткосрочная внутридневная торговая стратегия для фьючерсов на золото, которая сочетает в себе два подхода: трендовое следование и внутридневные развороты. Она позволяет не только получать прибыль при трендовом движении, но и своевременно фиксировать прибыль при развороте рынка, открывая позиции в новом направлении. Данная стратегия на протяжении 15 лет подряд входила в десятку самых прибыльных торговых стратегий по версии американского журнала Futures Truth. Она
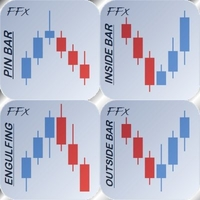
Индикатор FFx Patterns Alerter дает торговые рекомендации по входу в рынок, по уровням TP 1, TP 2 и SL на основе любого из выбранных паттернов (PinBar, Engulfing, InsideBar, OutsideBar) Предлагаются следующие варианты: Для работы с несколькими парами можно запускать несколько экземпляров индикатора на одном графике. Рекомендации по входу - количество пипсов, которые будут добавлены после пробоя для входа в рынок 3 различных варианта расчета SL - по пипсам, с использованием множителя ATR или по м
Limitless MT5  - это универсальный индикатор который подойдет каждому как начинающему так и опытному трейдеру работает на всех валютных парах криптовалютах сыре акциях Limitless MT5 - уже настроен и не требует дополнительной настройки   А теперь главное Почему  Limitless MT5 ? 1 полное отсутствие перерисовки  2 два года тестирования лучшими специалистами в трейдинге 3 точность правильных сигналов превышает 80% 4 хорошо показал себя в торговле во время выхода новостей Правила торговли  1 сигнал н
7FIGURES TREND — MT5 Trend & Signal Indicator See the trend. Read the market. Trade with greater clarity. 7FIGURES TREND is a professional MetaTrader 5 trend and signal indicator designed for traders who want a cleaner and simpler view of market direction without filling their charts with unnecessary technical information. The indicator performs its analysis in the background and presents the trader with clear information directly on the chart. WHAT 7FIGURES TREND SHOWS The system identifies the
QuantXMarketScanner is a multi assets indicator for MT5 - Mathematical model based on 7 custom moving averages indicators  - Adaptable on Currencies, Stocks and Crypto - Automatic setup, self optimized About QuantXsystem Products: –         Simple installation & integration into MT5   –         Unlimited License after purchase (for one user) –         Automatic pattern recognition to identify the best timing and price levels. –         Trading indicators are displayed directly and automaticall
SYSTEM INTRODUCTION:   The Binary Options Momentum System Is Specifically Designed For Binary Options Trading. Unlike Other Systems And Indicators That Were Adopted From Other Trading Environments For Binary Options. Little Wonder Why Many Of Such Systems Fail To Make Money . Many End Up Loosing Money For Their Users.  A Very Important Fact That Must Be Noted Is The Fact That Application Of Martingale Is not Required. Thus Making It Safer For Traders Usage And Profitability. A Trader Can Use Fi
Engulfing with EMAs Indicator Unlock the power of advanced candlestick pattern detection with the Engulfing with EMAs Indicator , a cutting-edge tool designed for MetaTrader 5. This futuristic indicator combines the precision of engulfing pattern analysis with the trend-following strength of Exponential Moving Averages (EMA 21 and EMA 50), empowering traders to identify high-probability setups across all currency pairs and timeframes. Key Features: Comprehensive Engulfing Detection : Detects b
Инструментарий для заработка и исследований. Техническая часть советника построена полностью на движке  Trading engine 4.010 , написанного господином Карпутовым , который любезно предоставляет доступ к своим работам. В основе ядра  торговых сигналов и стратегии лежит авторский алгоритм формирования паттернов прогнозирования цены. Применим к любому инструменту! Дополнен системой управления на основе МА "Девятихвостый Лис" , актуализации и подстройки сигнала максимально точно под рынок, инструм
ZigZag SMC Premium MT5
Kallebe Lins De Oliveira Santos
If you are looking for precision in identifying strategic tops and bottoms, the ZigZag SMC/SMT Indicator for MT5 is the tool that will contribute to your technical analysis. Developed based on the advanced concepts of Smart Money Concepts (SMC) and Smart Money Trap (SMT), it offers an insight into market behavior, helping you make decisions. What will you find in this indicator? Automatic identification of strategic tops and bottoms Based on institutional strategies Ideal for analyzing liqu
Уникальные и эффективные концепции этого индикатора основаны на теории разрывов справедливой стоимости (FAIR VALUE GAPS), разработанной и созданной Арджо, одним из лучших наставников. Я же добавил к объяснениям аспекты разработки. Серия видеороликов будет включать оригинальные ссылки на YouTube для полного и исчерпывающего объяснения, а также скриншоты работающей системы MT4/MT5. Все опубликованные системы будут доступны отдельно для MT4 и MT5, чтобы соответствовать всем платформам и запросам п
The latest most requested Binary Options arrow indicator in the Garuda Signals product line is now on MT5! Binary options signal based on multiple time frame cross over analysis. Gets confirmation from the most consistent signals known to man; Ichimoku, SMA, Bollinger Bands; and also uses the 1 Hour time frame as trend confirmation , so you don't have to open up multiple chart and waste time. - Can be used for all time frames up to 1 hour, but is most POWERFUL for 1 and 5 min options. - Place yo
MarketMagnet
Kelly Adediran Raymond
Готовы ли вы выйти на новый уровень в своем торговом путешествии? Не ищите ничего, кроме MarketMagnet, этого новаторского индикатора, разработанного, чтобы стимулировать ваш торговый успех с волнением и точностью. Основанный на слиянии Momentum и CCI (индекс товарного канала), MarketMagnet предоставляет трейдерам окончательный инструмент для определения направления и цен входа для широкого спектра рекомендуемых валютных пар и инструментов. Если вы новичок, трейдер среднего уровня, у которого ес
Institutional Volatility Bands Pro MTF The Institutional Volatility Bands Pro MTF is a professional econometric indicator built for individual retail traders, institutional operators, prop firm traders, and quantitative analysts across all financial markets (Futures, Spot, and Options). Unlike traditional indicators (such as Bollinger Bands or ATR) that suffer from lag and continuous dynamic repainting, this tool utilizes advanced econometric models to project 100% static, zero-repaint horizon
Multi-Timeframe Heiken Ashi (Smoothed with Dashboard) Professional Market Structure Visualization with Weighted Confluence Scoring Transform your trading with crystal-clear multi-timeframe analysis. This indicator combines smoothed Heiken Ashi candles with an intelligent weighted scoring system to give you unprecedented clarity in any market condition. YOUR TRADING QUESTIONS – ANSWERED INSTANTLY: 1. What's the REAL trend direction? Dashboard Reveals:   Higher timeframe (MN1, W1, D1, H4) trend a
RAD CRITICAL LEVES RAD indicator tracks “Relevant Volume” in real time, identifying accumulation and distribution processes, projecting them in the chart as SUPPORT or RESISTANCE zones. Natural   support   and resistance levels are generated by Volume Accumulation and Distribution processes. As these processes evolve, levels at which the relevant volume in the market place is positioned, become difficult areas to cross upwards or downwards. By using this information, traders can identify very s
Cycle Projection Pro is a cyclical analysis indicator for MetaTrader 5, designed for the Daily timeframe. It identifies and projects recurring price cycles forward in time, helping you estimate when — not how much — the market may be approaching a turning point. How it works The indicator sums six harmonic cycles with explicit periods — Weekly, Biweekly, Monthly, Quarterly, Semiannual, Annual — each independently adjustable and can be turned on or off. Their combination produces a composite wav
Manyal trading system, CovEchoTrend Robot, focuses on reliability and flexibility. By employing statistical analysis methods to study the relationships between the base indicator and market patterns, the system enables a deeper understanding of market processes. Intelligent pattern analysis: The application of statistical data processing helps identify key trend reversal points more accurately, signaling significant market shifts. Informed decision-making is based on the intersection of indicato

STRICTLY FOR BOOM INDEX ONLY!!!!! Here I bring the Maximum Trend Arrows OT1.0 MT5 indicator. This indicator is made up of a combination of different trend indicators for entries and exits, for entries an orange arrow will paint on the chart below the current market and a red flag for closing of trades and it produces buy arrows only. When the orange arrow appears, it will appear along with it's sound to notify you. The 1H timeframe is recommended, don't use it anywhere else than on the 1H timefr
# binary oprion killer Indicator - Binary Options Best Companion ## **Overview** The ** binary oprion killer Indicator Indicator** is a precision-crafted, non-repainting tool designed exclusively for binary options traders who demand accuracy and reliability. This indicator combines the powerful ADX momentum oscillator with a moving average filter to deliver crystal-clear entry signals at the perfect moment. ## **Why Binary Options Traders Love It** **Perfect Entry Timing:** Signals app
Naked Forex Kangaroo Tail Indicator Kangaroo Tail Indicator is a pattern recognition indicator for Forex, Stocks, Indices, Futures, Commodities and Cryptos. The Kangaroo Tail is a multi-bar pattern. The Kangaroo Tail pattern is very effective and is very simple to trade. The strategy that comes with the Kangaroo Tail is based on price action. The indicator does what it was designed for: displaying Kangaroo Tail patterns.   Don't expect to follow the up and down arrows and make money . Tradin
MGH-MagicLine — Тренд и мультитаймфреймовая дивергенция в одном инструменте MagicLine объединяет определение тренда и анализ дивергенции в одном индикаторе — это усовершенствованная альтернатива одновременному использованию MultiStoch и MultiMACD, с более чистым выводом и меньшей задержкой. Это инструмент подтверждения и анализа . Он не даёт точек входа, Take Profit или Stop Loss. Вместо этого он добавляет мощный и гибкий слой подтверждения, который подходит практически к любой трендовой страте
Индикатор Shved Supply and Demand Cluster Profile является  частью экосистемы анализа рынка Shved Market Analysis System (SMAS). Определяет области максимальной плотности и совпадения зон спроса и предложения, обеспечивая более глубокое понимание рынка как часть единой экосистемы SMAS. Shved Supply and Demand Cluster Profile — это революционный многофункциональный инструмент визуализации рыночных объемов и плотности зон спроса и предложения, созданный профессиональным трейдером для трейдеров.
PatternScope — Multi-Pattern Recognition for MT5 PatternScope is a multi-pattern recognition indicator for MetaTrader 5. It scans price action for classic chart patterns, confirms breakouts, and draws clear   Entry, Stop Loss and Take Profit   levels. A compact dashboard shows the latest pattern, bias and Risk:Reward. Patterns:   Double Top/Bottom, Triple Top/Bottom, Head and Shoulders (and inverted), Bullish & Bearish Flag, Pennant, Rising & Falling Wedge, Triangle, Rectangle, Cup and Handle —
WanaScalper
Isaac Wanasolo
1 (1)
A scalping indicator based on mathematical patterns, which on average gives signals with relatively small SL, and also occasionally helps to catch big moves in the markets (more information in the video) This indicator has three main types of notifications: The first type warns of a possible/upcoming signal on the next bar The second type indicates the presence of a ready signal to enter the market/open a position The third type is for SL and TP levels - you will be notified every time price re
С этим продуктом покупают
ARICoin is a powerful trading companion designed to generate high-probability entry signals with dynamic TP/SL/DP levels based on volatility. Built-in performance tracking shows win/loss stats, PP1/PP2 hits, and success rates all updated live. Key Features: Buy/Sell signals with adaptive volatility bands Real-time TP/SL/DP levels based on ATR Built-in MA Filter with optional ATR/StdDev volatility Performance stats panel (Success, Profit/Loss, PP1/PP2) Alerts via popup, sound, push, or email Cust
Boba Analysis Suite
Trade Ready Solutions LLC
5 (2)
Boba Analysis Suite Boba Analysis Suite — аналитический индикатор для MetaTrader 5. Он объединяет структуру рынка, значимые ценовые зоны и общий рыночный контекст в одном представлении на графике. Индикатор разработан на основе практического опыта трейдера и наставника по трейдингу. Он помогает выстроить последовательный процесс анализа: оценивать направление рынка, определять важные уровни и рассматривать несколько таймфреймов в совокупности. Анализ с учётом контекста Значение отдельных сигнало
ScalpPoint is a powerful trading companion designed to generate high-probability entry signals with dynamic TP/SL/DP levels based on volatility. Built-in performance tracking shows win/loss stats, PP1/PP2 hits, and success rates — all updated live. Key Features: Buy/Sell signals with adaptive volatility bands Real-time TP/SL/DP levels based on ATR Built-in MA Filter with optional ATR/StdDev volatility Performance stats panel (Success, Profit/Loss, PP1/PP2) Alerts via popup, sound, push, or emai

AriFocus - Non-Repainting Buy/Sell Signals AriFocus - one clear signal. AriFocus marks buy and sell signals directly on the chart and suggests a stop-loss level for each one. Every signal is confirmed on bar close and never repaints. - Buy/sell arrows, confirmed on bar close - Suggested stop-loss level for every signal - Trend band and candle coloring to show direction at a glance - 10 ready-made presets, or your own settings (14 calculation methods) - Pop-up, push and email alerts with entr
ARIPoint
Temirlan Kdyrkhan
1 (4)
ARIBot is a powerful trading companion designed to generate high-probability entry signals with dynamic TP/SL/DP levels based on volatility. Built-in performance tracking shows win/loss stats, PP1/PP2 hits, and success rates — all updated live. Key Features: Buy/Sell signals with adaptive volatility bands Real-time TP/SL/DP levels based on ATR Built-in MA Filter with optional ATR/StdDev volatility Performance stats panel (Success, Profit/Loss, PP1/PP2) Alerts via popup, sound, push, or email Cus
OmniSync Projection
Antonio-alin Teculescu
5 (1)
Chronos Fractal Engine is an innovative price projection indicator for MetaTrader 5, designed to transform your technical analysis by intelligently identifying and projecting historical price patterns. Built upon an advanced correlation algorithm and the fractal principles of the market, this powerful tool visualizes potential future price movements, giving you a unique edge in your trading decisions. What is Chronos Fractal Engine? At its core, the Chronos Fractal Engine employs a sophisticat
Индикатор предназначен для того, чтобы вовремя закрывать позиции по рынку. Например: досрочно фиксировать прибыль, если цена не достигла TakeProfit, а рынок разворачивается. Индикатор анализирует импульс, а не тренд. О тренде никакой информации он не дает. Индикатор хорошо подходит для поиска дивергенции. Индикатор Ershov 38 Parrots динамически подстраивается под рынок и выявляет импульсы движения цены средней и высокой амплитуды. На мелкие скачки цены почти не реагирует.  Принципиальное отличи
MERAVITH SCANNER — это профессиональный индикатор финансовых рынков для MetaTrader 5, который объединяет несколько аналитических инструментов в единую интегрированную систему. Он выполняет все расчёты автоматически, используя собственную методологию средневзвешенной цены по объёму (VWAP), полностью исключая субъективную интерпретацию. Индикатор работает на всех классах активов (Forex, акции, индексы, товары, криптовалюты) и на всех таймфреймах от M1 до Monthly. Базовый принцип заключается в том,
note: this indicator is for METATRADER4, if you want the version for METATRADER5 this is the link:  https://www.mql5.com/it/market/product/108106 TRENDMAESTRO ver 2.5 TRENDMAESTRO recognizes a new TREND from the start, he never makes mistakes. The certainty of identifying a new TREND is priceless. DESCRIPTION TRENDMAESTRO identifies a new TREND in the bud, this indicator examines the volatility, volumes and momentum to identify the moment in which there is an explosion of one or more of these da
Cycles Plotter Индикатор настраиваемых циклов со скользящими средними и датой начала Cycles Plotter — это продвинутый технический индикатор, который строит два полностью настраиваемых синусоидальных цикла только на основе ввода пользователя. Он не генерирует циклы автоматически: все циклы рассчитываются исключительно на основе параметров, установленных пользователем, предоставляя трейдерам визуальный инструмент для изучения ценовых колебаний и потенциальных изменений тренда, без создания автомат
AriX
Temirlan Kdyrkhan
1 (4)
AriX Indicator for MT5 A powerful trend-following and signal-evaluation tool AriX is a custom MT5 indicator that combines Moving Averages and ATR-based risk/reward logic to generate clear buy/sell signals. It visualizes dynamic SL/TP levels, evaluates past trade outcomes, and displays win/loss statistics in a clean on-chart panel. Key features include: Buy/Sell signals based on MA crossovers ATR-based SL/TP1/TP2/TP3 levels with visual lines and labels Signal outcome tracking with real-time stat
Title:FX-AIEA Supply and Demand Zone Indicator (MT5) — Technical Overview Version: 2.51 | Platform: MetaTrader 5 Introduction Supply and demand zones are considered a core manifestation of institutional order flow, providing a more direct reflection of buying and selling pressure than traditional support/resistance levels. This indicator attempts to automate the identification of high-probability supply and demand zones using an adaptive ZigZag algorithm, reducing the subjectivity and time asso
ORB Seeker MT5
Marcela Goncalves De Oliveira
Специальная цена для ограничения доступности и поддержания дефицита товара! Всего за 599 долларов! После покупки свяжитесь со мной, чтобы получить бонусный советник ORB Seeker EA и файлы с персонально оптимизированным набором функций. С уверенностью фиксируйте чистые вспышки активности во время сеансов! ORB Seeker MT5 — это профессиональный индикатор пробоя диапазона открытия (ORB), созданный для трейдеров, которым важны точность, простота, гибкость и понятная структура графика. Программа авто
KenKem Master Volume Profiler - Brief Introduction A Display-only volume-profile cockpit for XAUUSD, BTCUSD and other liquid symbols. Draws profile structure, multi-timeframe flow, EMA trend and study-only setup markers. Places no orders. Not a signal service.  It maps where the market has actually traded and reads recent order flow, so you can see structure and lean at a glance.  What it shows: Master and local volume profiles (POC and value-area high/low) - the price shelves that matter. A liv
VTrende Pro
Andrii Diachenko
5 (1)
VTrende Pro - МТФ индикатор для трендовой торговли с панелью индикации для МТ5 !!! - Подробное описание на русском языке под видео (на Youtube) - !!! Хотя сигналы индикатора VTrende Pro можно использовать, как сигналы полноценной торговой системы, рекомендуется применять их в связке с ТС Билла Вильямса. VTrende Pro - это расширенная версия индикатора VTrende . Отличие Pro версии от VTrende: - Временные зоны - Сигнал V - сигнал 1-2 волн Основная задача индикатора - определить точки изменения н
MasterTrend Indicator for MT5 A powerful trend-following and signal-evaluation tool MasterTrend   is a custom MT5 indicator that combines Moving Averages and ATR-based risk/reward logic to generate clear buy/sell signals. It visualizes dynamic SL/TP levels, evaluates past trade outcomes, and displays win/loss statistics in a clean on-chart panel. Key features include: Buy/Sell signals based on MA crossovers ATR-based SL/TP1/TP2/TP3 levels with visual lines and labels Signal outcome tracking wit
SMC Sweep Fvg MT5 — рынок глазами умных денег, прямо на вашем графике Вы наверняка знаете это чувство: цена срывает ваш стоп, разворачивается — и уходит именно туда, куда вы и думали. Вы были правы по направлению. Вы ошиблись только во входе. Этот индикатор создан ровно для того, чтобы такое случалось реже. Он берёт на себя самую тяжёлую часть анализа — разметку графика — и оставляет вам главное: решение. Что вы увидите на графике Структуру рынка — реальные структурные максимумы и минимумы с
MATADOR GOLD XAUUSD M5 Scalp Signals for MT5 MATADOR GOLD is a decision-support indicator for MetaTrader 5, designed for traders who analyze short-term Gold movement on the M5 timeframe. The indicator does not open, close, or manage trades automatically. It provides buy and sell signal guidance so the user can make their own trading decisions according to their risk plan, broker conditions, and trade management rules. Main purpose MATADOR GOLD is built to help traders avoid noisy signal flow and
PrimeScalping is a powerful trading companion designed to generate high-probability entry signals with dynamic TP/SL/DP levels based on volatility. Built-in performance tracking shows win/loss stats, PP1/PP2 hits, and success rates — all updated live. Key Features: Buy/Sell signals with adaptive volatility bands Real-time TP/SL/DP levels based on ATR Built-in MA Filter with optional ATR/StdDev volatility Performance stats panel (Success, Profit/Loss, PP1/PP2) Alerts via popup, sound, push, or e

Робот с видео приложен во вкладке "Обсуждение" , он работает одним ордером и только по сигналам для оценки эффективности индикатора. Pan PrizMA CD Phase является опцией, построенной на базе индикатора Pan PrizMA . Подробнее . Усреднение полиномом второй-четвертой степени повышает гладкость линий, добавляет инерцию и соответственно ритмичность. Экстраполяция функцией синусоиды около константы позволяет регулировать запаздывание или опережение. Значение фазы - параметра состояния волны (близко по
Классификатор силы тренда. Показания на истории не меняет. Изменяется классификация только незакрытого бара. По идее подобен полной системе ASCTrend, сигнальный модуль которой, точнее его аппроксимация в несколько "урезанном" виде, есть в свободном доступе, а также в терминале как сигнальный индикатор SilverTrend . Точной копией системы ASCTrend не является. Работает на всех инструментах и всех временных диапазонах. Индикатор использует несколько некоррелируемых между собой алгоритмов для класси
FFx Universal Strength Meter PRO - это больше, чем простой измеритель силы. Вместо того, чтобы ограничивать расчет ценой, его значения могут быть основаны на любом из 19 встроенных режимов измерения силы + 9 таймфреймов. С FFx USM вы сможете задавать любой период для любой комбинации таймфреймов. Например, вы можете установить панель на последние 10 свечей на M15-H1-H4… Полная гибкость! Простая интерпретация... Это дает отличное представление о том, какие валюты слабые и сильные, поэтому вы смож
Индикатор FFx Universal MTF Alerter показывает все тайфреймы (от M1 до месячного) на одном графике, отображая статус выбранного индикатора на каждом из них. 9 индикаторов (MACD-RSI-Stochastic-MA-ADX-Ichimoku-Candles-CCI-PSAR). Каждый из них можно несколько раз применять на одном графике с различными настройками. Простая интерпретация. Сделки на покупку подтверждаются, когда большинство таймфреймов показывается зеленым цветом. А сделки на продажу подтверждаются, когда большинство таймфреймов пока
FFx Watcher PRO - панель для отображения на одном графике текущего направления стандартных индикаторов (до 15 одновременно) на нескольких таймфреймах (до 21). Панель работает в двух режимах: Режим Watcher: Мульти-индикаторный Пользователь может выбрать до 15 индикаторов для отображения Пользователь может выбрать до 21 таймфрейма для отображения Режим Watcher: Мультивалютный Пользователь может выбрать любое количество символов Пользователь может выбрать до 21 таймфрейма для отображения В этом реж
Версия для MetaTrader 4 доступна здесь : https://www.mql5.com/ru/market/product/24881 FFx Basket Scanner ищет до пяти индикаторов среди 16 доступных на всех парах и таймфреймах. Таким образом вы можете ясно увидеть торговли по каким валютам следует избегать, а на каких сосредоточить внимание. Когда валюта переходит в экстремальную зону (например, 20/80%), вы можете торговать всей корзиной с большей уверенностью. Другая область применения индикатора – определение сильных и слабых валют для поиск
Версия для MetaTrader 4 доступна здесь: https://www.mql5.com/ru/market/product/25793 FFx Pivot SR Suite PRO - это полный набор инструментов для построения уровней поддержки и сопротивления. Поддержка и сопротивление - самые используемые уровни во всех видах торговли. Их можно использовать для поиска разворотов тренда, установки уровней тейк-профита и стоп-лосса и т.д. Индикатор можно полностью настроить непосредственно с графика Выбор из 4 периодов для расчетов: 4-часовой, дневной, недельный и
Premium level - это уникальный индикатор с точностью правильных прогнозов  более 80%!  Данный индикатор тестировался более двух месяцев лучшими Специалистами в области Трейдинга!  Индикатор авторский такого вы больше не где не найдете!  По скриншотах можете сами увидеть точностью данного инструмента!  1 отлично подходит для торговли бинарными опционами со временем экспирации на 1 свечу. 2 работает на всех валютных парах, акциях, сырье, криптовалютах Инструкция: Как только появляется красная стре
ClassicSBA
Umri Azkia Zulkarnaen
this indicator very simple and easy if you understand and agree with setup and rule basic teknical sba you can cek in link : please cek my youtube channel for detail chanel : an for detail info  contact me  basicly setup buy (long) for this indicator is Magenta- blue and green candle or magenta - green  and green candlestik and for setup sell (short) is Black - yellow - and red candle or black - red  and red candlestik
Индикатор Coefficient Of Determination (COD) представляет собой значение коэффициента детерминации или квадрат коэффициента корреляции между зависимой переменной — ценой и объясняющей переменной — тиковым объемом. Что это дает нам на практике? COD отлично распознает кульминацию трендовых движений, что позволяет подбирать оптимальные точки и ловить развороты рынка. Как использовать индикатор: Наиболее популярная торговая стратегия строится совместно с трендовым индикатором Moving Average (MA), пе
Recommended TimeFrame >= H1. 100% Non Repainted at any moment.  Use it carefully, only with Trend Direction. Trading Usage: 2 Variants: as Range System or as BreakOut System (Both Only With Trend Direction)::: (Always use StopLoss for minimise Risk); [1] as Range System: (Recommended) in UP TREND:  - BUY in Blue Line , then if price goes down by 50 points (on H1) open Second BUY.   Close in any Profit you wish: TrailingStop(45 points) or Close when Price touches upper Gold Line. in DOWN TREND
Фильтр:
Нет отзывов
Ответ на отзыв