Quant Volatility Bands
- Индикаторы
-
Leonardo Marins Cordeiro
 I currently work as a Data Scientist in the credit division of one of the largest financial institutions in Latin America. In my day-to-day role, I build Machine Learning models, time-series algorithms, and data architectures using Python and SQL.
 - Версия: 2.10
- Активации: 10
Institutional Volatility Bands Pro MTF
The Institutional Volatility Bands Pro MTF is a professional econometric indicator built for individual retail traders, institutional operators, prop firm traders, and quantitative analysts across all financial markets (Futures, Spot, and Options).
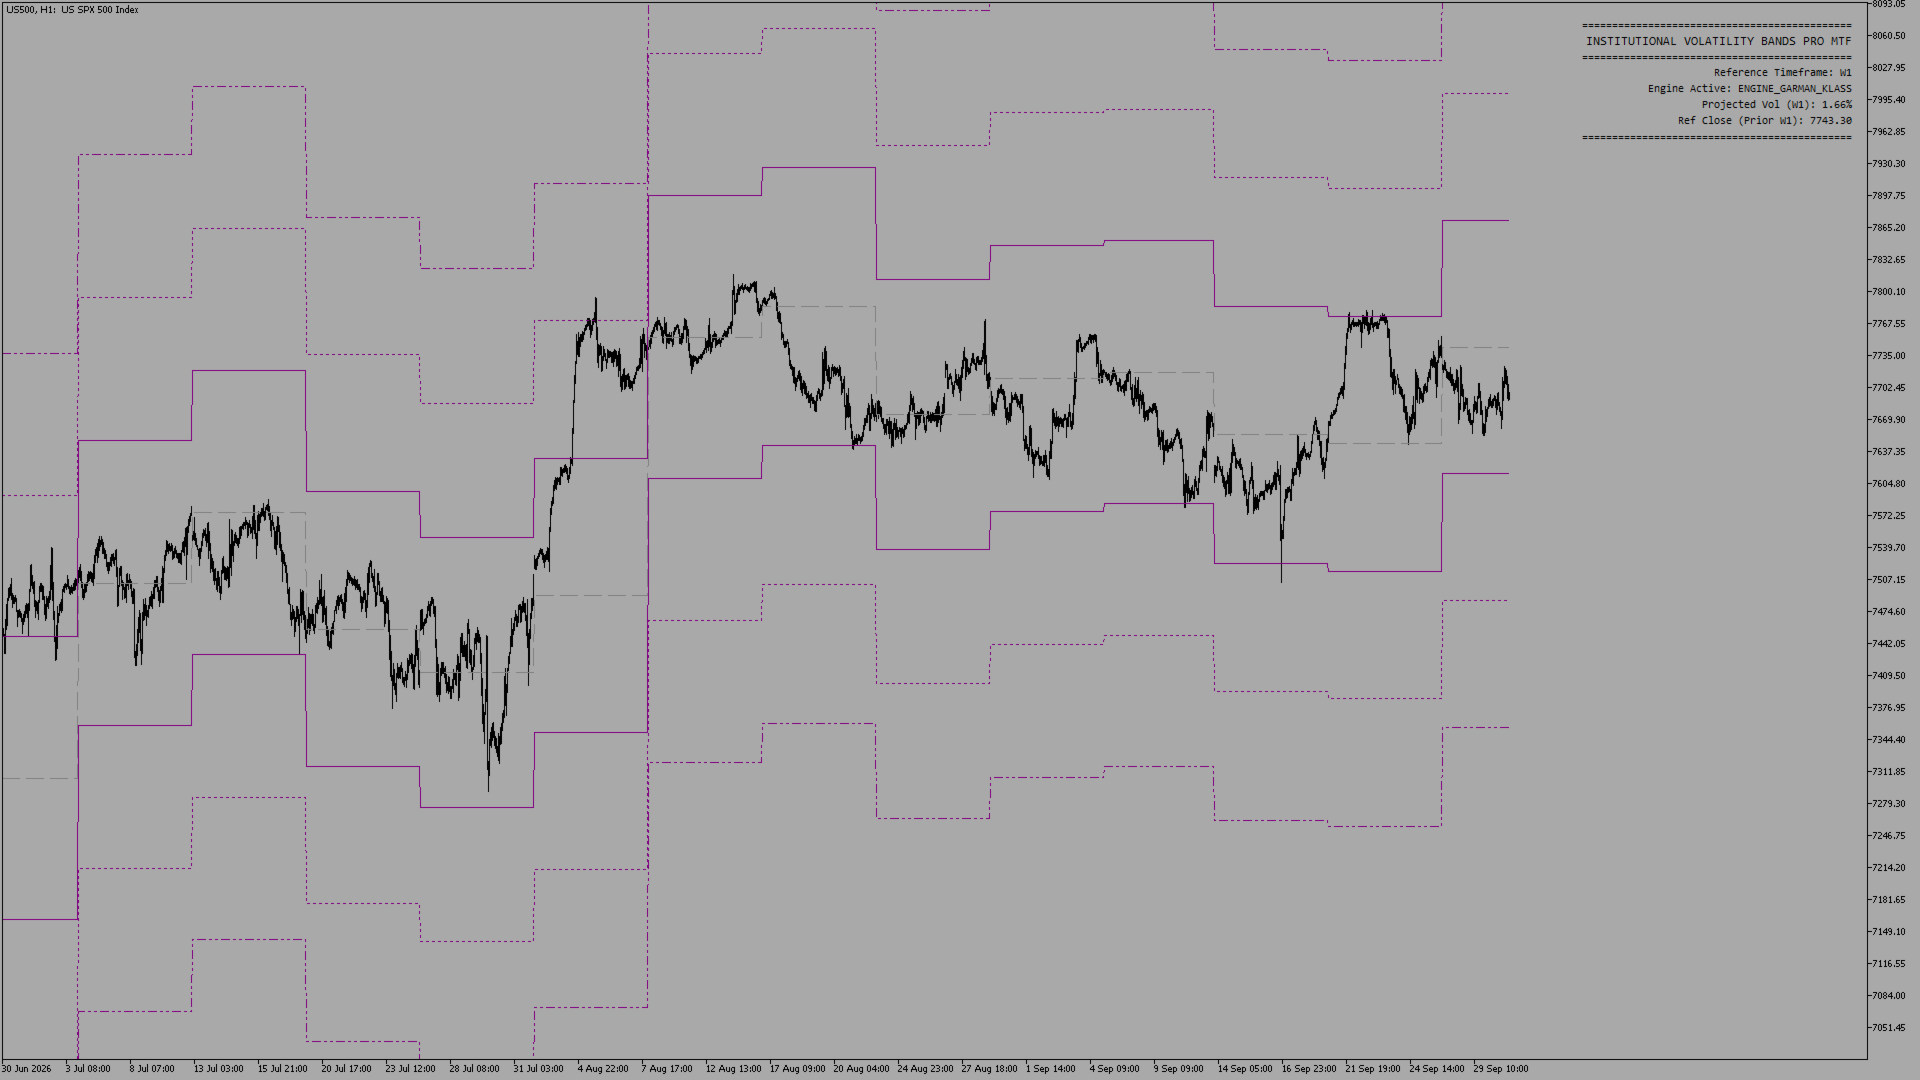
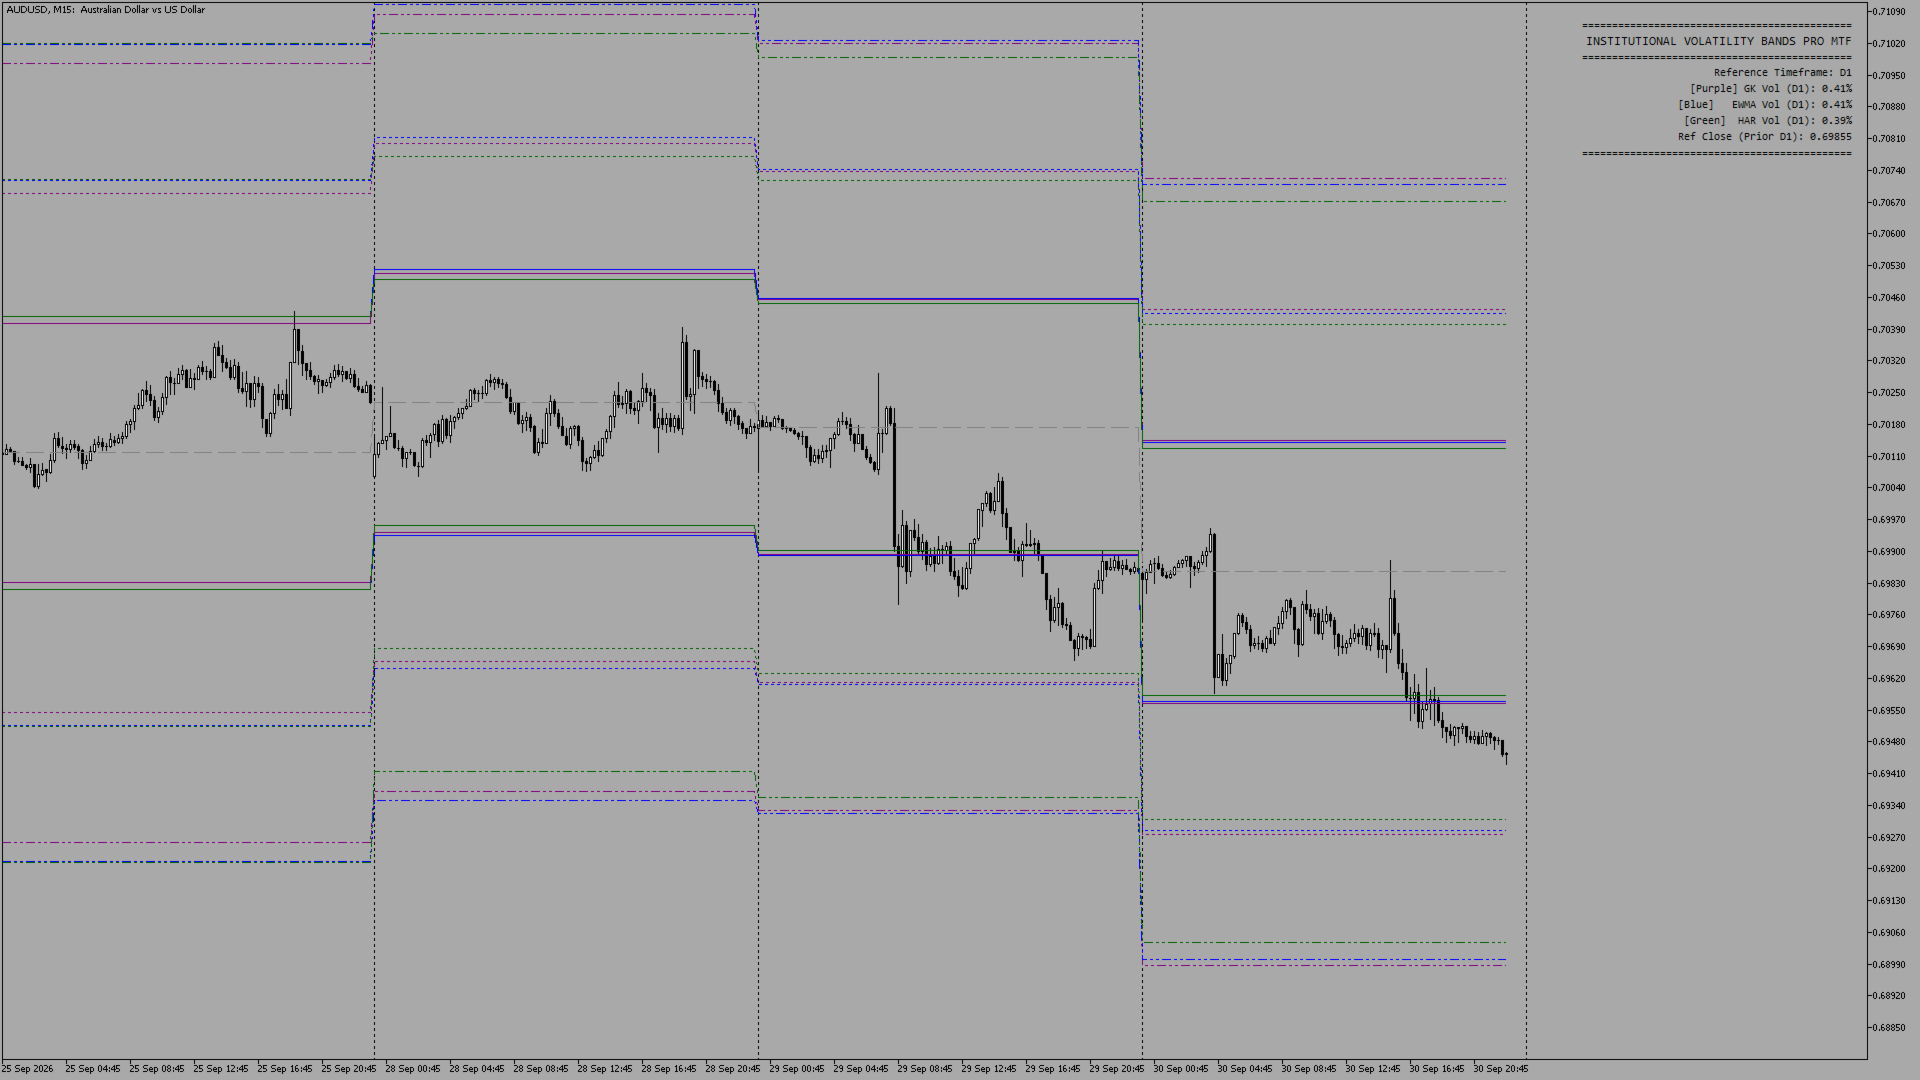
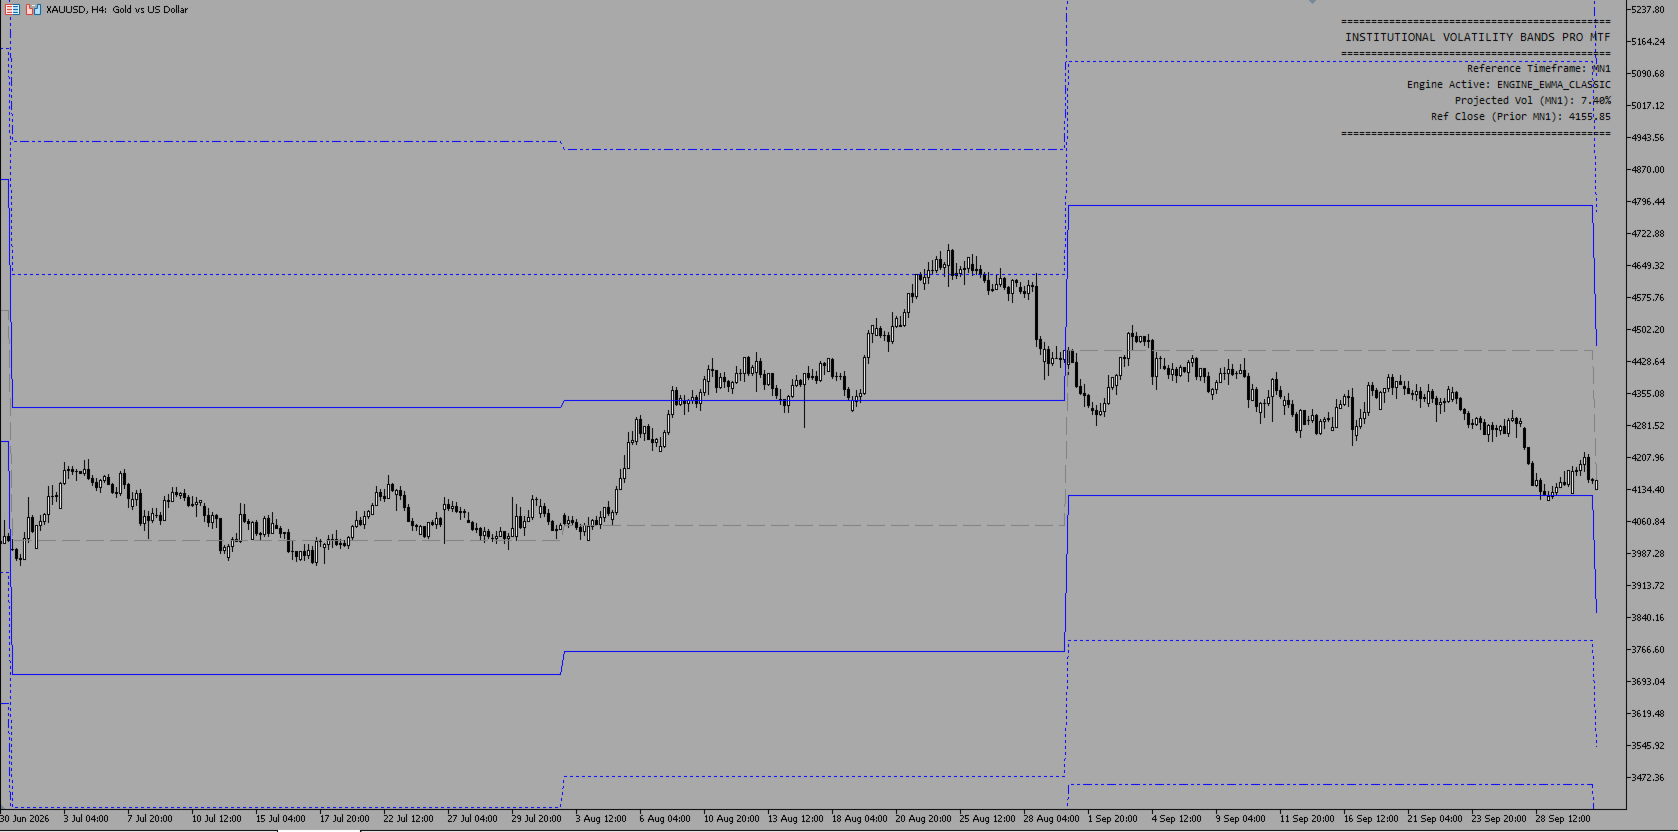
Unlike traditional indicators (such as Bollinger Bands or ATR) that suffer from lag and continuous dynamic repainting, this tool utilizes advanced econometric models to project 100% static, zero-repaint horizontal step-bands derived from prior completed timeframe statistics (D1, W1, or MN1).
Universal Multi-Asset Compatibility:
Thanks to the underlying relative variance and logarithmic return calculations, the methodology is 100% asset-agnostic. The indicator automatically scales and adapts seamlessly across any financial market:
• Forex & Currencies: Major, minor, and exotic pairs (EURUSD, GBPUSD, USDJPY, etc.).
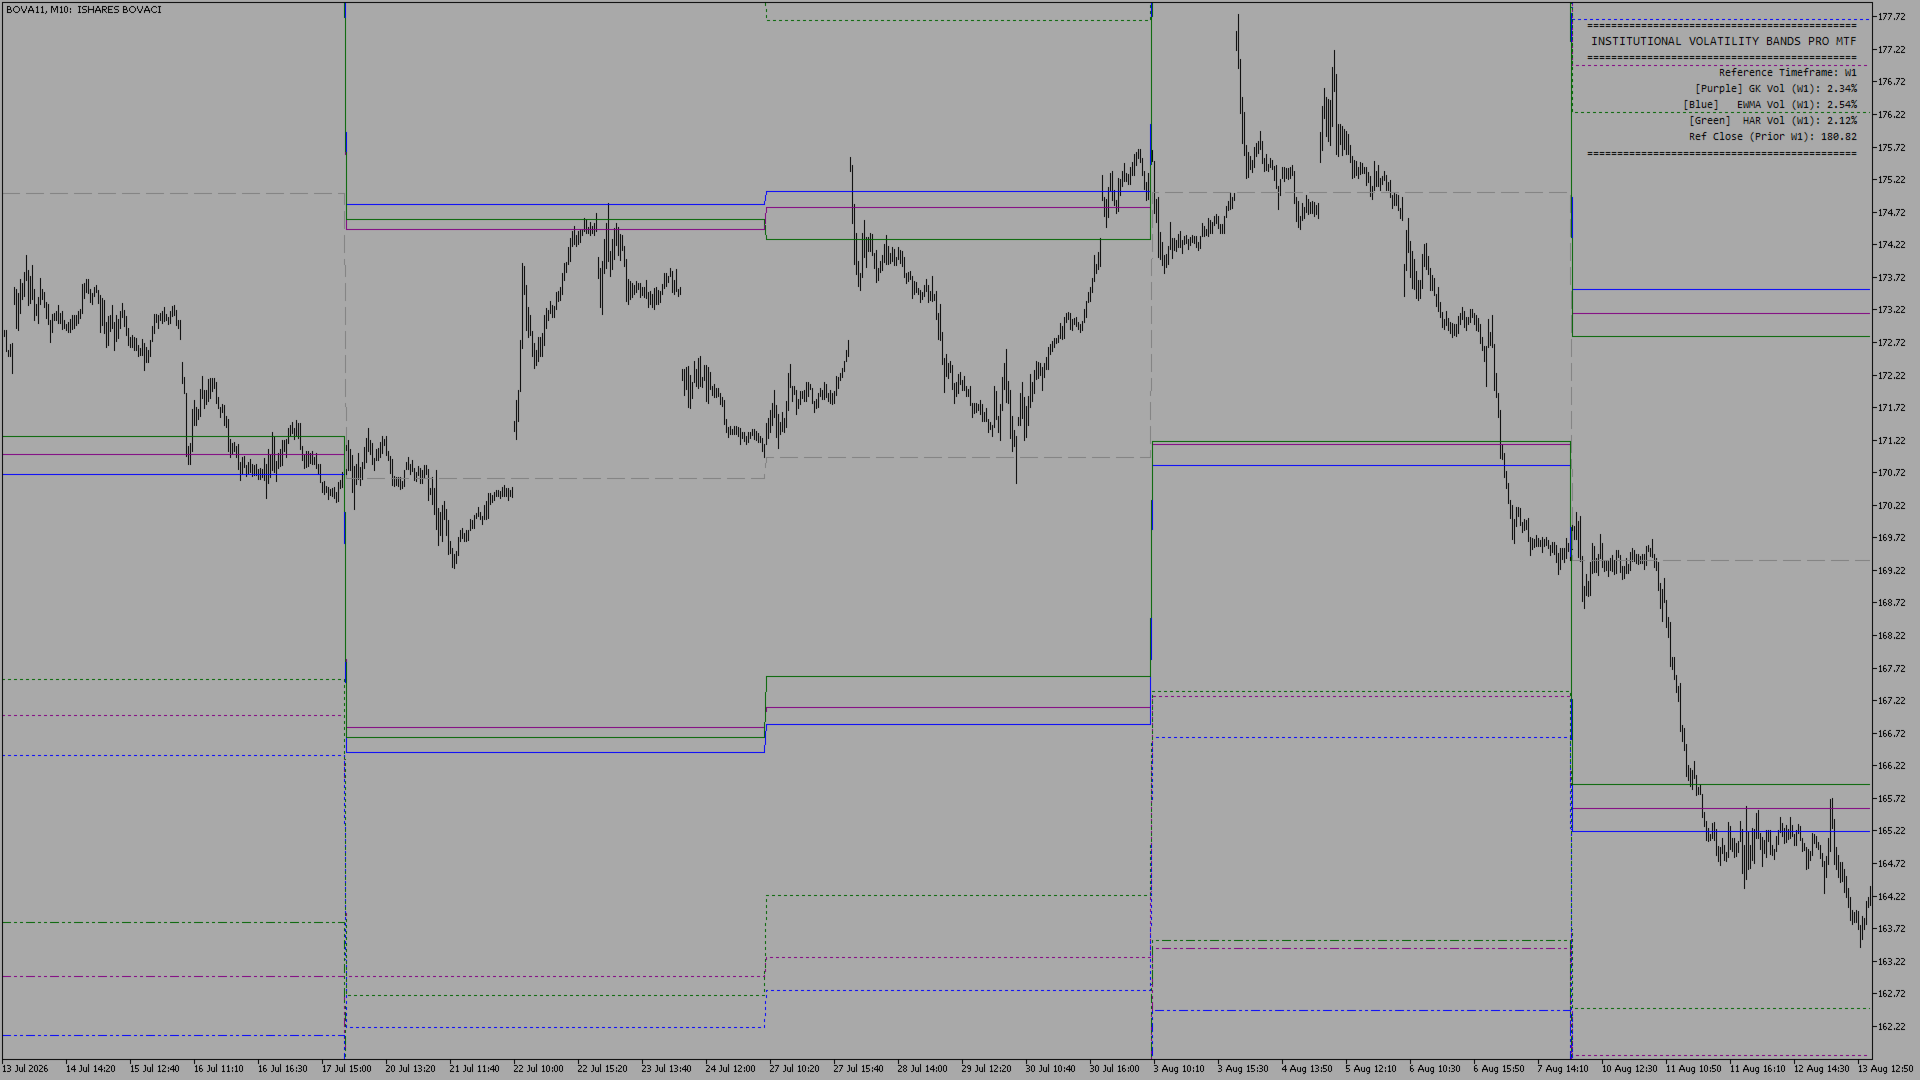
• Equities & Stocks: US Stocks (NYSE/NASDAQ), European, and Latin American Equities (B3).
• Global Indices: S&P 500, Nasdaq 100, Dow Jones, DAX 40, FTSE, and Nikkei.
• Commodities: Gold (XAUUSD), Silver, Crude Oil (WTI/Brent), and Agricultural Markets.
• Crypto Assets: Bitcoin (BTCUSD), Ethereum, and altcoins across all liquidity regimes.
Key Econometric Engines Included:
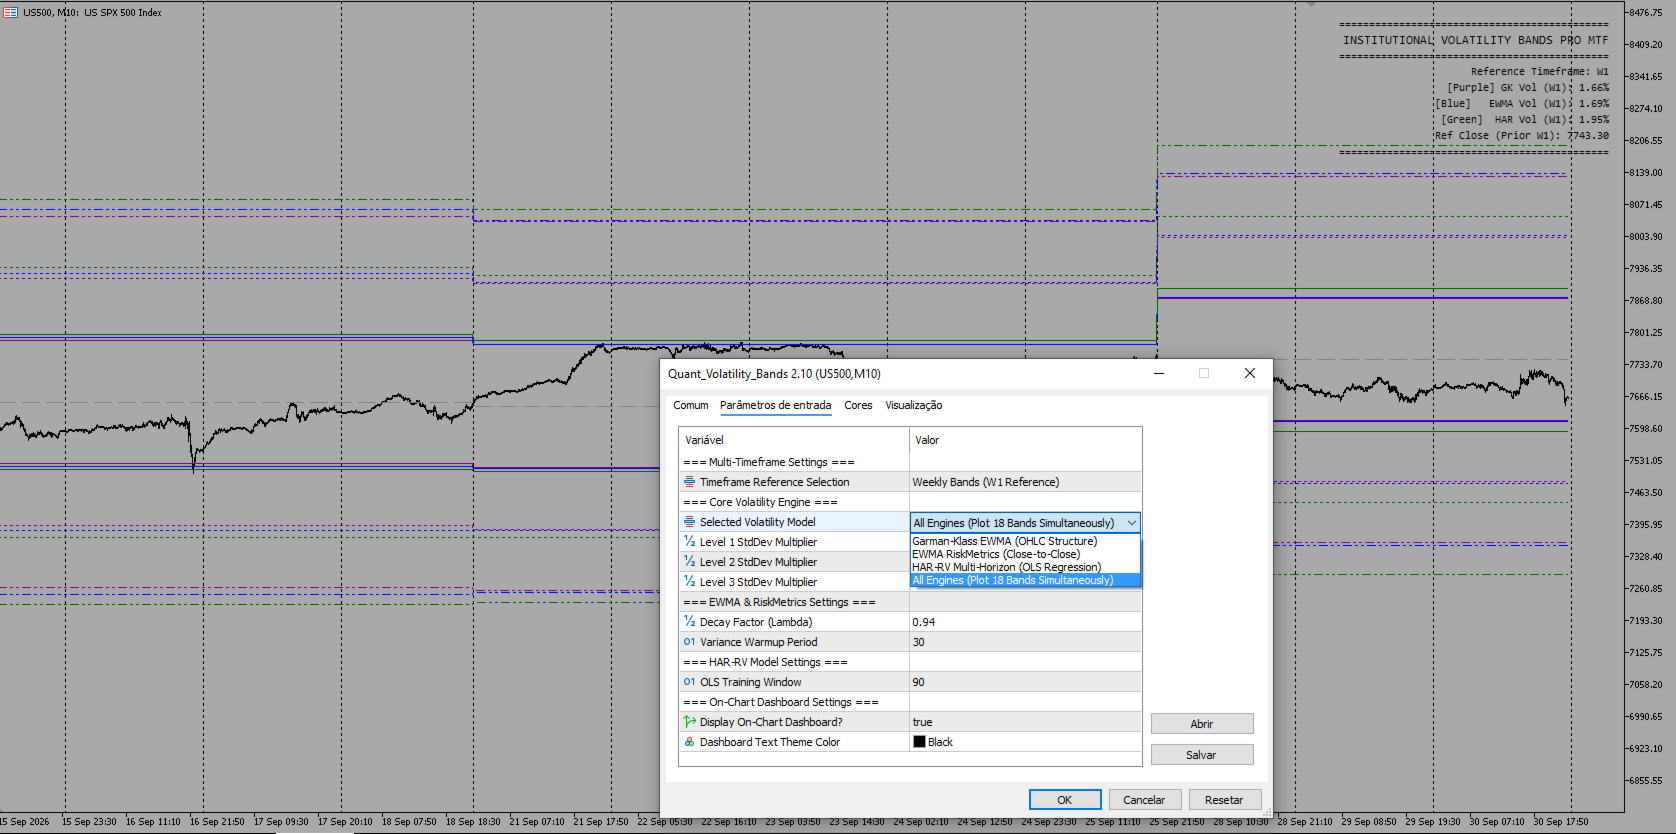
• Garman-Klass EWMA: Uses Open, High, Low, and Close structural prices for ultra-precise intra-bar variance estimation.
• EWMA / RiskMetrics Classic: Exponentially Weighted Moving Average applied to Close-to-Close log returns.
• HAR-RV (Heterogeneous Autoregressive) OLS: Multi-horizon volatility model capturing Daily, Weekly, and Monthly persistence via Ordinary Least Squares regression.
Macro-to-Micro Confluence & Intraday Execution:
• Multi-Timeframe Volatility Clusters: Identify high-probability trade setups by analyzing the confluence of Weekly (W1) and Monthly (MN1) bands directly on lower intraday charts (M5, M15, H1).
• Institutional Reversal Zones: When intraday price action collides with overlapping macro resistance or support levels (e.g., Weekly 2SD overlapping Monthly 1SD), it creates an econometrically backed confluence zone ideal for high-reward intraday scalping and trend reversals.
• Top-Down Structural Alignment: Trade with macro statistical context without leaving your intraday execution chart or losing historical alignment.
Econometric Support & Resistance, Target Definition & Options Trading:
Statistical volatility projection creates mathematically objective boundaries that act as econometrically calculated Support and Resistance levels:
• Dynamic Target & Stop-Loss Placement: Use 1SD, 2SD, and 3SD bands to establish precise, non-subjective Take Profit targets and logical Stop Loss levels based on actual market variance rather than arbitrary fixed pips or points.
• Price Exhaustion & Reversal Zones: Identify key structural levels where price extension reaches statistical limits, highlighting high-probability inflection points and pause zones.
• Naked Options (Out-right Call/Put Options): Locate statistically optimal entry zones where price extension implies a high probability of directional momentum or mean-reversion.
• Options Structures & Spreads: Use static expected move levels to define precise strike selection for Vertical Spreads (Bull/Bear Trades), Iron Condors, Straddles, Strangles, and Calendar Spreads.
• Probability Boundaries: Easily visualize expected price ranges for the current day, week, or month, helping you sell premium outside expected statistical deviation or buy options during favorable volatility compression points.
Core Features:
• Zero-Repaint Technology: All projected levels remain static for the entire duration of the active timeframe.
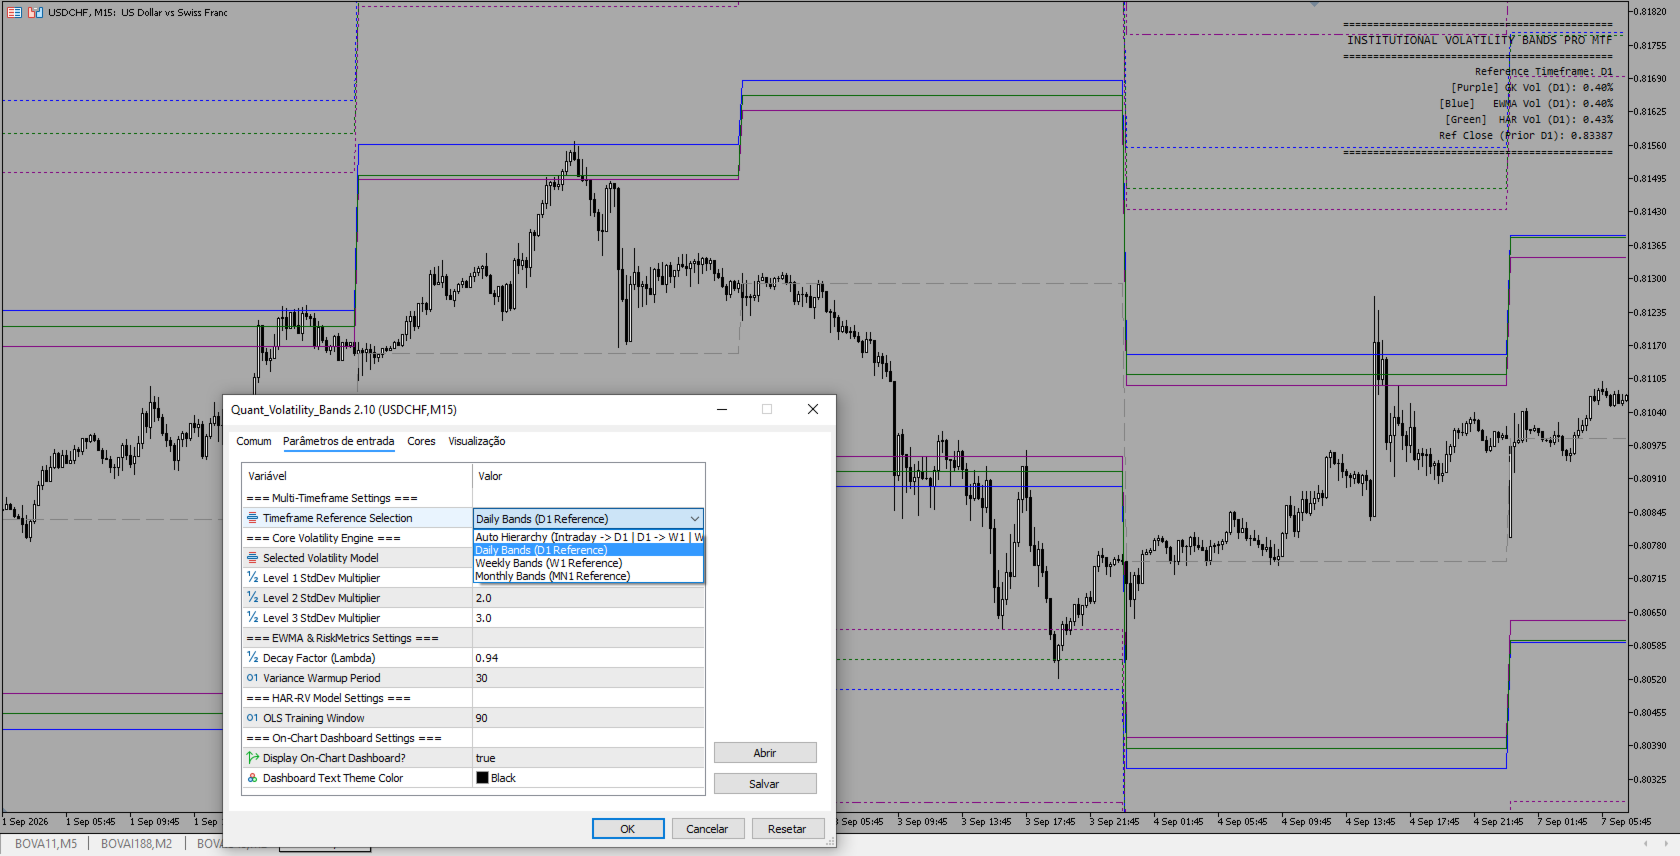
• Adaptive Multi-Timeframe (MTF): Seamlessly overlay Weekly (W1) or Monthly (MN1) volatility boundaries directly onto lower intraday charts (M5, M15, H1).
• Automatic & Manual Modes: Automatic hierarchy routing (D1 -> W1 -> MN1) or manual timeframe lock.
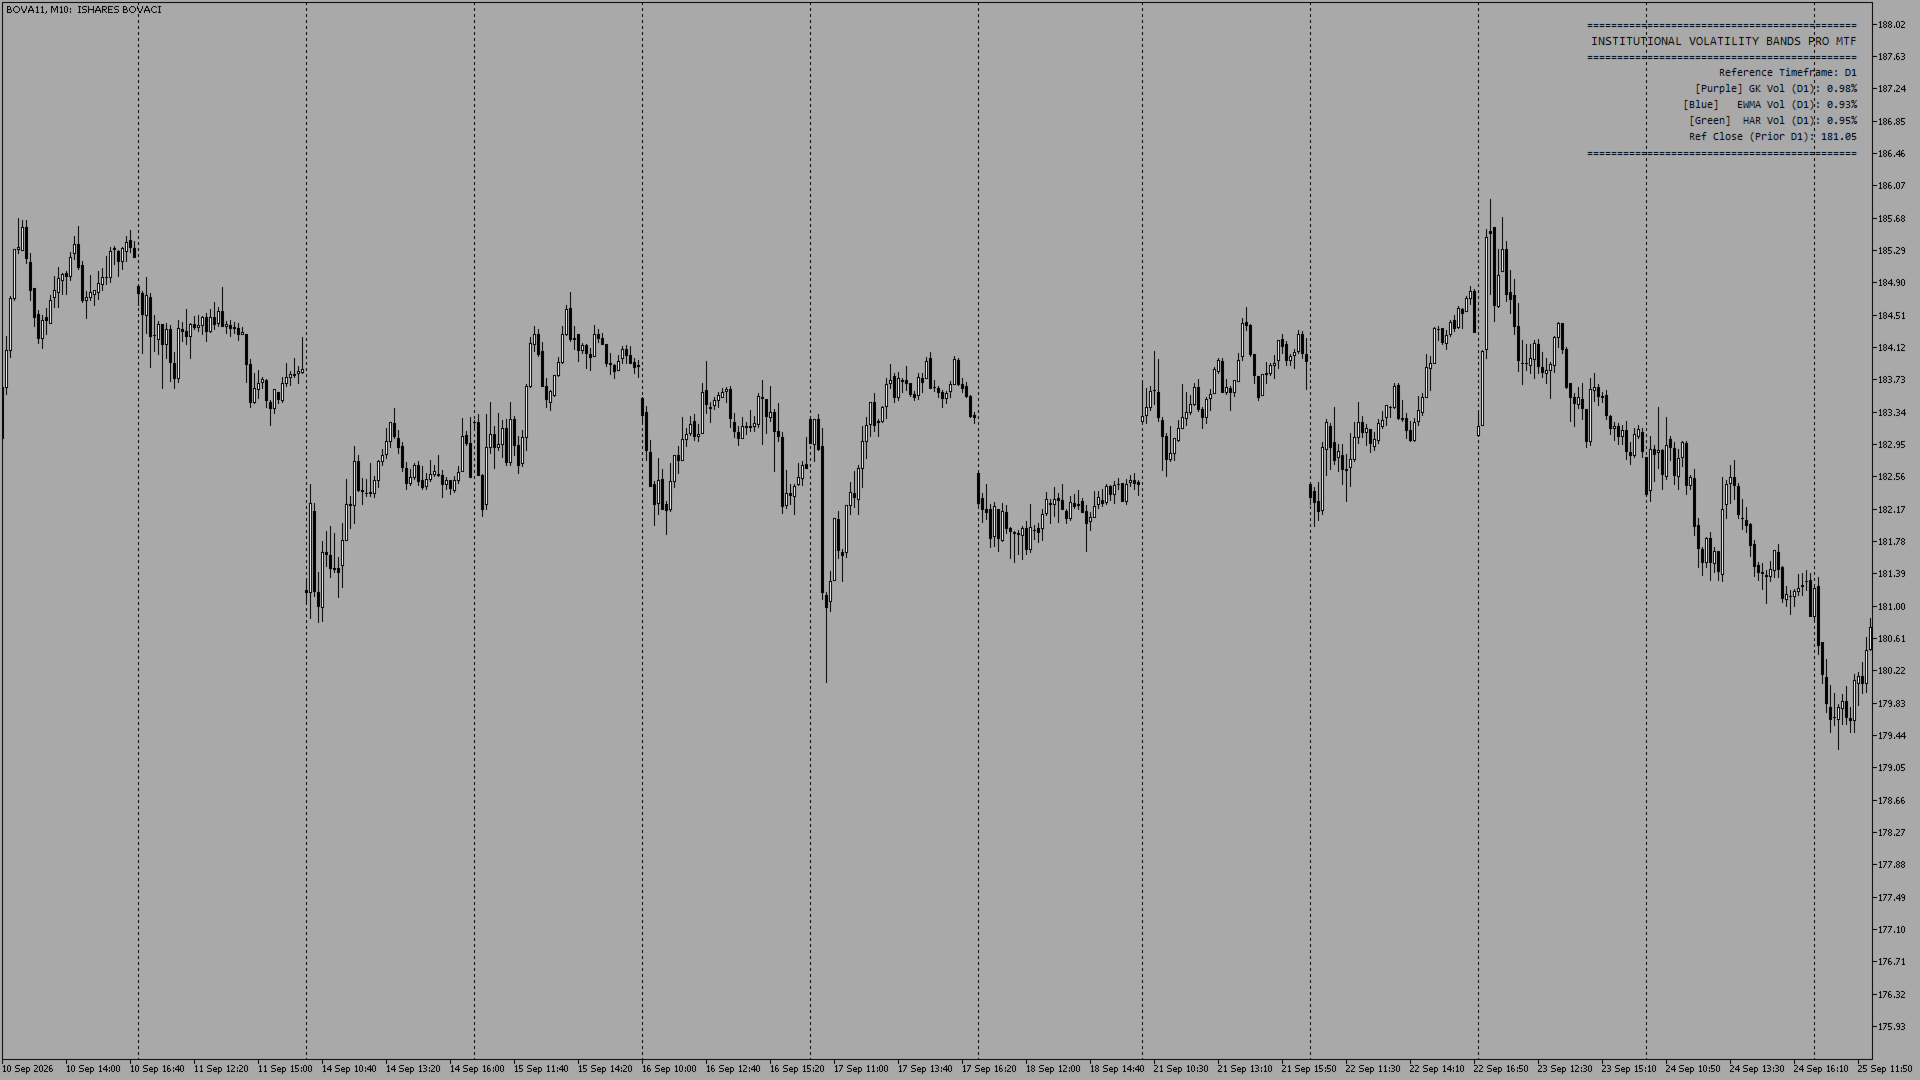
• On-Chart Professional Dashboard: Clean, customizable interface displaying active model volatility metrics and reference close values.
• High Efficiency Code: Low CPU memory footprint optimized for multi-chart trading and strategy validation.