MA Cross Indicator MT5
- Индикаторы
- Eda Kaya
- Версия: 2.2
- Обновлено: 4 августа 2025
MA Cross Indicator MetaTrader 5
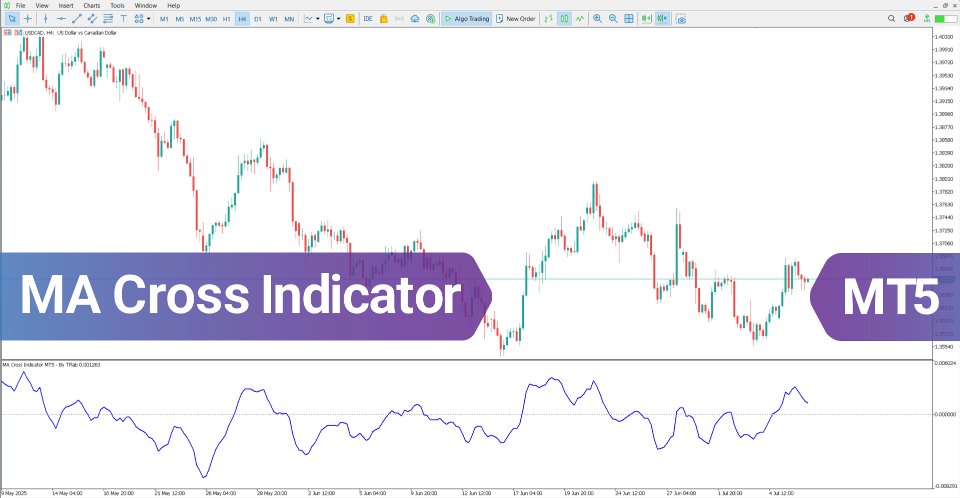
The MA Cross Indicator functions as a linear oscillator, based on the crossover of two moving averages with different time periods. In addition to indicating the prevailing market trend direction, this indicator is highly effective in identifying potential trend reversal points.
The crossover between these two lines serves as a key signal for trade entries and exits.
«Indicator Installation & User Guide»
MT5 Indicator Installation | MA Cross Indicator MetaTrader 4 | ALL Products By TradingFinderLab | Best MT5 Indicator: Refined Order Block Indicator for MT5 | Best MT5 Utility: Trade Assistant Expert TF MT5 | TP & SL Tool: Risk Reward Ratio Calculator RRR MT5 | Prop Firm Protector: Prop Draw Down Protector Expert Advisor MT5 | Money Management: Easy Trade Manager MT5 A Cross Indicator Table
The specifications of the MA Cross Indicator are summarized below:
| Category | Momentum – Oscillator – Currency Strength |
| Platform | MetaTrader 5 |
| Skill Level | Beginner |
| Indicator Type | Continuation – Reversal |
| Timeframe | Multi Time Frame |
| Trading Style | Intraday Trading |
| Trading Market | All Markets |
MA Cross Indicator Overview
The MA Cross Indicator represents the market trend through a blue linear oscillator that fluctuates around a zero line. This blue oscillator shifts its position based on the relative movement of the fast and slow moving averages. When the oscillator crosses above or below the zero axis, it signals the beginning of an uptrend or downtrend, respectively.
This makes the MA Cross oscillator a reliable tool for interpreting both the direction of the trend and possible reversal points.
It is built upon two Simple Moving Averages (SMA):
• Fast SMA: calculated from the last 4 candles
• Slow SMA: calculated from the previous 14 candles
Indicator in an Uptrend
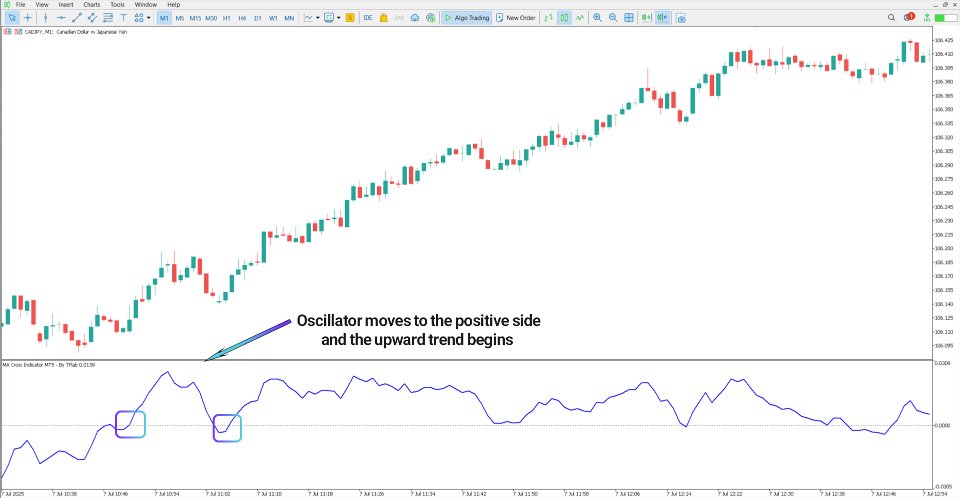
The chart below illustrates the CAD/JPY currency pair on a 1-minute timeframe. When the 4-period fast-moving average crosses above the 14-period slow-moving average, the oscillator line rises above the zero axis. This bullish crossover marks the start of an uptrend, reflecting increased buying momentum and indicating a potential buy entry zone.
Indicator in a Downtrend
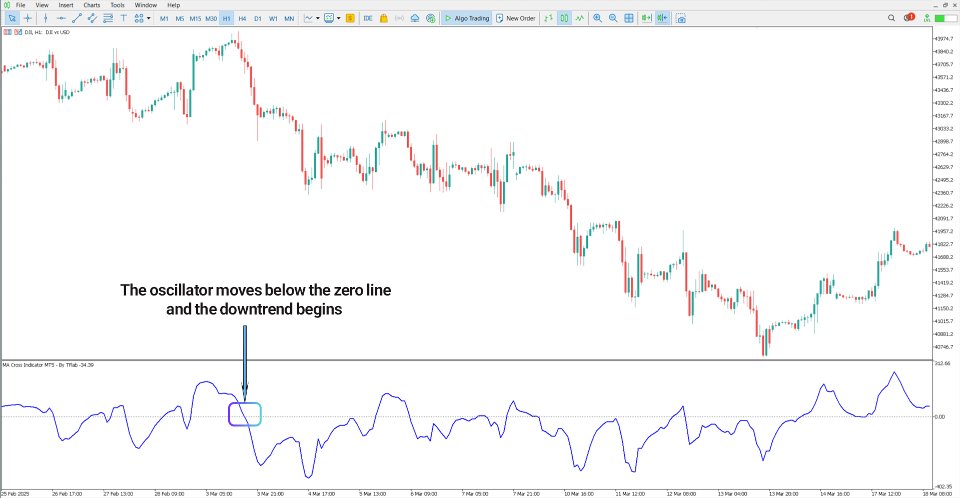
The image below shows the Dow Jones Index (DJI) on a 1-hour chart. When the 4-period fast-moving average crosses below the 14-period slow-moving average, the crossover suggests the beginning of a downtrend. In this scenario, the oscillator drops below zero, identifying a potential sell entry zone.
MA Cross Indicator Settings
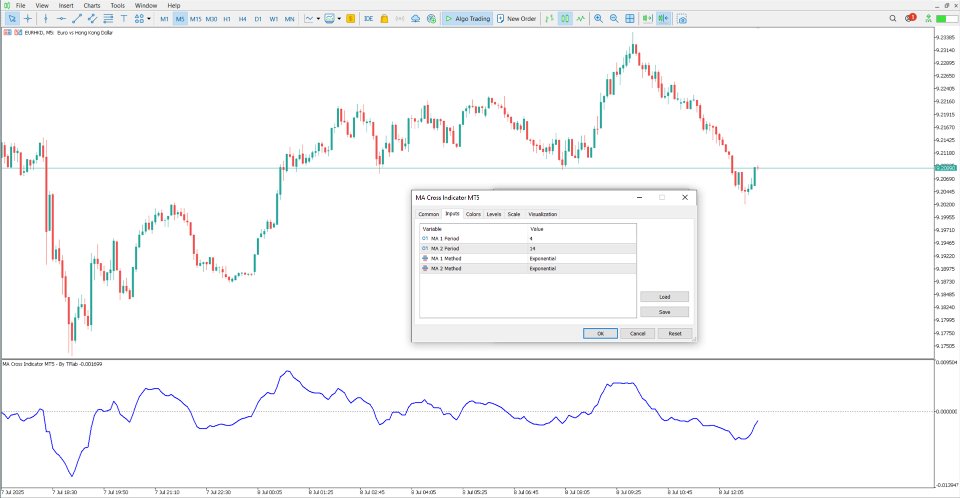
The settings panel for the MA Cross oscillator includes the following parameters:
• MA 1 Period: Defines the period of the first moving average
• MA 2 Period: Defines the period of the second moving average
• MA 1 Method: Specifies the calculation method for the first moving average
• MA 2 Method: Specifies the calculation method for the second moving average
Conclusion
The MA Cross Indicator is a trend-based technical analysis tool built around the crossover of two simple moving averages set to 4 and 14 periods. Its output is displayed as a linear oscillator that fluctuates around the zero axis, providing clear signals for identifying uptrends, downtrends, and potential entry points.
























This is a really good indicator for helping with direction analysis.