• Тип индикатора
  • Цена
     - 
  • Сбросить
Смотри обучающее видео по маркету на YouTube
Как купить торгового робота или индикатор
Запусти робота на
виртуальном хостинге
Протестируй индикатор/робота перед покупкой
Хочешь зарабатывать в Маркете?
Как подать продукт, чтобы его покупали

Новые технические индикаторы для MetaTrader 5 - 41
icon На основании сигналов технических индикаторов принимаются решения относительно открытия или закрытия сделки на фондовом и форекс-рынках. Суть индикаторов заключается в математическом преобразовании цены и/или объемов финансового инструмента для прогнозирования изменений цен в будущем. Протестируйте технические индикаторы, чтобы лучше предсказывать поведение рынка и зарабатывать на этом.
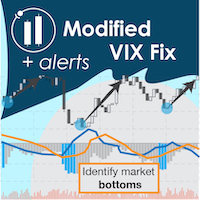
"The VIX Fix is a powerful indicator that detects   market bottoms for any asset " The VIX (volatility index) is a ticker symbol of implied volatility of the S&P 500, calculated by the Chicago Board Options Exchange. VIX is a popular measure of market risk, and is one of the best measures of market bottoms that currently exists. Unfortunately, it only exists for the S&P 500... The VIX   Fix   was published by Larry Williams in 2007, and it synthesizes a VIX volatility index for any asset (not j
K线极点轨道UD 【input 参数】 InpMyMagic: 幻数 InpShowPanel: 是否展示面板 InpOneLot: 开单量1份[最大99.99](=0最小手,>0固定手,<0>=-1净亏比,<-1净余最小亏比) InpAllLot: 总净单量,100%(=0最小手,>0固定手,<0>=-1净亏比,<-1净余最小亏比) InpLotMaxMoney: 开单量计算的最大金额(=0不管,>0超过该值即限制为该值,<0超过整数值即限制为小数倍数) InpLot1Dot1Money: 开单1手变化1点时金额变化值。(<=0自动计算(美元),>0指定) InpDotBig: 大间隔点值(>=0点值,<1三位数点差均,<0整均比) InpDotSml: 小间隔点值(>=0点值,<1三位数点差均,<0整均比) ==========   UD   ========== InpUDType: 类型(=0不开,=1常规,=4偏极,=6平台,=8慢跟,=10超前,=12跟随) InpMinWidth: 上下轨宽度最小值(>=0点值,<1三位数点差均,<0整均比) InpHTurnT
Institutional Pivot is a result of 5 years of research on order flow analysis in the Forex market and Nasdaq, seeking mounting and defense positions. The one of the best support and resistance points you can have right now available to everyone. You can opt for the Forex, CME and Brazilian markets in the settings Choosing the market just plot on the chart to make your trades
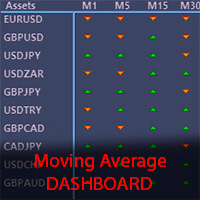
The Moving Average Dashboard indicator allows you to see the relationship between a fast and a slow moving average. This indicator is working on multiple symbols and up to 21 timeframes. It's allows you to configure the fast and slow moving averages to whatever period, method or price is appropriate The Moving Average Dashboard saves you time as you can use the indicator to scan multiple currency pairs or other symbols in just one window. Installation Download the Indicator in your MT5 te
50+ Candlestick Patterns, Simulated Trading Results, Top Five Performers Candle Analysis extends Candlesticks Pattern Analysis by not only identifying Patterns but also recording the Past Performance of the Patterns. What it Does:- Identifies and plots results on chart Displays Top Patterns for both Bullish and Bearish type.  Log can be printed in experts tab to see Simulated Trading results Displays All or Selected Patterns Alerts on Pattern formation More detailed information in   Blog
After forming a New Structure High the market will retrace creating a higher low. When this movement occurs, that NSH's now become an area of structure called  resistance . As price action pushes up from the newly created higher lows, that resistance level becomes the last stand for sellers to stop the buyers from rallying.    IF the resistance level cannot be penetrated, THEN it's likely that we'll see either a period of consolidation or a reversal in trend. IF price action breaks through
A powerful oscillator that provide Buy and Sell signals by calculating the investor liquidity. The more liquidity the more buy possibilities. The less liquidity the more sell possibilities. Please download the demo and run a backtest! HOW IT WORKS: The oscillator will put buy and sell arrow on the chart in runtime only . Top value is 95 to 100 -> Investors are ready to buy and you should follow. Bottom value is 5 to 0 -> Investors are ready to sell and you should follow. Alert + sound will app
BeST_ Elliot Wave Oscillator Strategies is an MT5 indicator which by default is the difference of two SMAs displayed as a histogram fluctuating around zero while a Signal Line generates Entry Signals either in a Reverse or in a Normal Mode and it is a very powerful tool that very often exploits huge market movements. Signal Line comes in 2 types: Advanced Get Type – like the corresponding one used in the homonym analysis package Mov. Average Type – as a Moving Average of the Elliot Oscillat
Выделяет торговые сессии на графике Trading Sessions Indicator (Индикатор торговых сессий) отображает начало и окончание каждой торговой сессии. Платная версия продукта Trading Sessions Indicator Pro с возможностью пользовательской настройки начала/окончания сессий >>> [ОПЦИИ:] Timeshift - Используйте, если имеет место смещение сессий по времени [Заданные параметры:] Asian session Open=0; Asian session Close=9; Asian session OpenSummertime=1; Asian session CloseSummertime=10; European s
FREE
Этот индикатор находит и отображает фигуры технического анализа "Двойное дно" и "Двойная вершина". Сигнализирует (выводит сообщение на экран), если фигура была сформирована недавно. Часто после появления этих паттернов, тренд поворачивает обратно или происходит коррекция. Чтобы не искать их самостоятельно, или не пропустить их появления, достаточно добавить индикатор на график. Индикатор можно использовать на разных таймфреймах и валютных парах, есть настройки для лучшего поиска на определённой
FREE
Master Calendar Osw
William Oswaldo Mayorga Urduy
ГЛАВНЫЙ КАЛЕНДАРЬ OSW Этот индикатор изначально был создан для моего личного использования, но я постепенно улучшал его и внедрял функции, помогающие в моей повседневной торговле, и функции будут продолжать реализовываться, если они будут полезны. ДЕТАЛИ КАЛЕНДАРЯ. >Мобильный и подробный календарь новостей, близких к текущей дате, с такими данными, как: дата, страна, валюта, сектор новостей, название новостей и предыдущие, прогноз и текущие данные. >Календарь обновляется автоматически к
Z Score Plus MT5
Eduardo Da Costa Custodio Santos
В финансах Z-баллы являются мерой изменчивости наблюдения и могут использоваться трейдерами для определения волатильности рынка. Z-баллы сообщают трейдерам, является ли он типичным для указанного набора данных или нетипичным. Z-оценки также позволяют аналитикам адаптировать оценки из нескольких наборов данных, чтобы получать оценки, которые можно более точно сравнивать друг с другом. # На практике у нас есть ZScore с нулевой точкой и колебаниями между 2 и 3 для сверхвысоких точек и колебаниями м
ATR Exit MT5
BLAKE STEVEN RODGER
4.75 (4)
The ATR Exit indicator uses the candle close + ATR value to draw trailing stop lines (orange under buys, magenta over sells) that advance with the trend until the trend changes direction. It uses a multiple of the Average True Range (ATR), subtracting it’s value from the close on buy, adding its value to the close on sell. Moreover, the trailing stop lines are generated to support the order’s trend direction (long or short):  In an upward trend, the long trailing stop line (orange line under bu
FREE
Pentagram MT5
Andrey Ziablytsev
5 (2)
Автоматическая разметка графика моделями Пентаграмма. Данная модель основана на Модели Расширения из Тактики Адверза. Предназначена для определения тренда и прогнозирования возможных уровней и целей ценовой коррекции в будущем. Модель описывает развивающийся тренд. Тренд актуален до тех пор пока цена не пересекла линию тренда модели в обратном направлении. Уровни лучей пентаграммы, уровень НР, расстояния 100% и 200% от расстояния между точками 1-4,  уровня HP  есть возможные уровни коррекции или
Jacket - стрелочный индикатор для форекса, фьючерсов и бинарных опционов без перерисовки. Отслеживает рыночный тренд, игнорируя резкие колебания рынка и шумы вокруг средней цены. Работает только по ценам открытия. Потому надежный и без перерисовок. Данный индикатор использует свои алгоритмы для анализа предыдущих периодов и предсказания дальнейшего поведения рынка. В его основе – расчет уровней с определенным периодом, что позволяет более точно оценивать ситуацию. Часто сигналы которые пошли не
America - индикатор глобального тренда. Если у вас еще нет своей торговой стратегии, Вы можете воспользоваться нашей готовой торговой стратегией. Индикатор поможет в поиске точек входа при анализе графика цены. Программа сначала получает «снимок» графика, затем анализирует его. Результаты сообщаются трейдеру в виде сигналов. Основная цель данного индикатора это определение моментов входов и выходов из сделок, поэтому индикатор отображает только линию тренда и точки входа, тоесть отображает пока
Signal Eskiya кроме линий канала отражает сигналы на вход в виде стрелок. Торговые стратегии, использующие индикатор канала относятся к классическим методам технического анализа, просты в исполнении, поэтому доступны даже новичкам. Ценовые диапазоны одинаково хорошо работают на любых торговых активах и таймфреймах, могут использоваться как самостоятельно, так и с дополнительным подтверждением от осцилляторов и рыночных объемов.  Американские трейдеры говорят: «Trend is your friend», – что в п
BetterVolumeTick it is a volume indicator. It marks the volume regions where there was a great aggression, also shows the volume intensity. Yellow means low volume, normal activity. Orange means activity with a pretty amount of volume. Red means ultra high volume. This indicator combined with the price chart will give you another view of the market context.
Market Fractal Analysis, Fractal Swing, Market Flow Fractal Cycles looks for Similar Patterns in the Market that repeat themselves because of the Market Fractal Nature. These patterns are displayed with help of Graphical Objects and Alerts can be received on their arrival. Read the   Blog   for full information. Features:- Auto Detection of Patterns Customization for Color and Line Styles Alerts, Emails & Push Notifications
Descriptions A point point is a technical analysis indicator, or calculations, used to determine the overall trend of market over different time frames. This indicator calculate the highest or lowest pivots among left x and right y bars and show the high/low level during that period.   From that, you could clearly see the top resistance & bottom support level and how market goes break out. Instructions pivotLeft - pivot left bar count pivotRight - pivot right bar count pivotHighColor - c
Индикатор строит трехпериодный семафор и фигуру разворота 123 от экстремума. Сигнал приходит на открытии второй свечи. По этому паттерну можно торговать разными способами (тест точки 3, пробой и другие). Выход из канала или пробой трендовой - это главный триггер для поиска точки входа. Значки окрашены в соответствии с уровнями Фибоначчи. Желтые значки указывают на тест уровня, при котором сигнал усиливается. Используя мультивалютную панель инструментов, вы можете отслеживать, на каких валютных
Смысл этого индикатора состоит в том, чтобы  находить уровни Мюррея на всех таймфреймах  и объединять их в  комбо-уровни , включающие сигнальные уровни, основанные на сильных уровнях Мюррея   (+2,   +1, 8, 4, 0, -1, -2). Чем меньше таймфрейм, тем больше у вас шансов сразу увидеть уровень комбо. Он будет выделен цветом. При наведении курсора на любое число появится подсказка, к какому таймфрейму относится уровень. Но вы всегда будете видеть текущий таймфрейм крайним левым. Умное оповещение   помо
HLC bar MT5 Wyckoff
Eduardo Da Costa Custodio Santos
Индикатор «HLC_bar_MT5 Wyckoff» для MT5 был создан для облегчения анализа во время торговли. Панель HLC использовалась Ричардом Вайкоффом и в настоящее время широко используется в операциях VSA. Вайкофф обнаружил, что использование максимума, минимума и закрытия сделало график намного чище и проще для анализа. Индикатор «HLC_bar_MT5 Wyckoff» позволяет: # Изменить ширину полосы; # Оставьте полосу того же цвета; # И выделите бар, который открывался и закрывался по одной цене. Цвета и ширина легко
Segmented Volume MT5
Eduardo Da Costa Custodio Santos
Индикатор сегментированного объема MT5 был создан для облегчения торговли с использованием анализа цен и объема, VSA, VPA, метода Wyckoff и системы Smart Money. Сегментированный объем работает на любом рынке (Crypto, CFD, Forex, Futures, Stocks ...) и работает в любое время графика. Посмотрите, насколько проста ваша интерпретация: # Зеленый: объем намного выше, чем в среднем по рынку. # Темно-розовый: громкость выше среднего. # Синий: положительная нормальная громкость. # Красный: отрицательная
Jac Trend
Eduardo Da Costa Custodio Santos
The JAC Trend Indicator for MT5 was created to facilitate the identification of the market trend in an easy and agile way. # When JAC Trend indicator is green , we have a pre-trend to uptrend market. # When JAC Trend indicator is Red we have a pre-trend to downtrend market. # When JAC Trend indicator is gray , we have a sideways market without strength. That way you have all the sides that the Market can go to in a clear and objective way.
Volume Zone Fractal
Eduardo Da Costa Custodio Santos
VZO Plus is an indicator that shows overbought and oversold regions based on traded volume. #When the indicator line is between -40 and -60 it is oversold #When the indicator line is between 40 and 60 it is overbought. Outside these regions, the market is following its natural path by inertia. Above the green line, it means that the market is positive, Another way to analyze the indicator is through divergence regions. When we have the bottom higher than the other in a downtrend or One botto
VSA Smart Money
Eduardo Da Costa Custodio Santos
The VSA Smart Money indicator tracks the movement of professional traders, institutional trades and all compound man movements. The VSA Smart money Indicator reads bar by bar, being an excellent tool for those who use VSA, Wyckoff, PVA and Any other analysis that uses price and volume. There are 10 indications that you will find in your Chart: *On Demand *Climax *UT Thrust *Top Reversal bar *Stop Volume *No Supply *Spring *Reversal Bottom *Shakeout *Bag Holding Using this indicator you will be o
Индикатор показывает на графике   круглые уровни . Их еще называют   психологическими , банковскими или уровнями основных игроков. На этих уровнях происходит настоящая борьба быков и медведей, накопление множества ордеров, что приводит к повышенной волатильности. Индикатор   автоматически   подстраивается под любой инструмент и таймфрейм. При пробитии и последующем тесте уровня   80 - покупаем . При пробитии и последующем тесте уровня   20 - продаём . Цель - 00. Внимание. Из-за сильных уровней
FREE
MiniMACD
Kiyoshi Mizu Miyabi Nori
4.6 (5)
This is just a MACD with multi symbols, multi timeframes, and multi colors. features. different symbols and timeframes from the main chart. draw main line, signal line, and histogram. each line can be erased. the ascent and descent can be distinguished.  Due to the above features, this MACD is suitable for multiple lineups in a single chart. This can be used in the same way as MiniCandles.  
FREE
Индикатор является торговой системой для краткосрочной торговли. Scalper Assistant помогает определить направление сделки, а также показывает точки входа и выхода. Индикатор рисует две линии (возможные точки для открытия позиций). В момент пробоя верхней линии вверх   (и при выполнении всех торговых условий)   появляется стрелка вверх(сигнал на покупку), а также 2 цели. В момент пробоя нижней линии вниз   (и при выполнении всех торговых условий)   появляется стрелка вниз(сигнал на продажу)
TB5 Channel
Oleksandr Myrhorodskyi
TB5 Channel  — это канальный мультитаймфреймный индикатор. Который генерирует точки входа на разных таймфреймах. Предусмотрено 2 способа построения индикатора. Первый способ — это установка индикатора по текущему таймфрейму. В данном случае у вас построится канал по тому таймфрейму, который у вас открыт в МТ5. Второй способ  построения индикатора – это умножение на индекс таймфрейма. Суть второго метода - построить на текущем графике канал старшего таймфрейма. Например, если вам надо построить
Amiguinhos Bar Counter
Eduardo Correia Da Silva
3 (2)
Amiguinho's Bar Counter is a price action indicator to display the bar count (candles) with some interesting options. About the "Period of analysis" parameter: if the current timeframe is in minutes, then the analysis period will be considered in days; if the current timeframe is in days, then the analysis period will be considered in months; or  if the period of analysis will be considered in years.
FREE
FMC Alert
YBM Capital Markets
I have been trading and designing indicators and EAs for the last 5 years, and with great pride and excitement, I am honored to present FMC Alert(Forex Market Conditions Alert) to you all! If you are a fan of the traditional indicators like the stochastic indicator, macd and moving averages, but if you would like a complete indicator that can utilize all these indicators, and some others, then the F.M.C Alert is the indicator for you. F.M.C Alert is an indicator that allows traders to customiz
Индикатор строит локальные максимумы и минимумы, которые находятся между x баров слева и y баров справа,  в виде непрерывных линий. Ниже приведено описание входных параметров. High Left Length - количество баров слева для нахождения локального максимума High Right Length   - количество баров справа для нахождения локального максимума Low Left Length   - количество баров слева для нахождения локального минимума Low Right Length   - количество баров справа для нахождения локального минимума
SL Sniper
Chalin Saranga Jayathilake
SL Sniper I coded. to trade with the trap system of the main market with vsa   for more information and you want vsa system  please  pm me Suggested timeframes to trading : M1- M2- M3- M5 - M15-M30 -H1  Wait london and newyork markert open after wait best then select the best strong index and weakest index by sniper Histogram is indicated by one arrow at a time. The signal in the end direction of weak and strong All red and green mean trending index,natural market is displayed only in white SL
Boom and Crash Trend Detector is a  Non-Repaint   MT5 trading system usually being sold for 50 0$ . Most people use this for Deriv but can be used to forex too. The boom and crash spike indicator is a spike detecting software, with Multiple features, these features include. Spike Alert ( from 10 to 100-second warning before spike) Continues spike Alert (for double or continuous spikes at a time) supports all Boom/crash Indices M6 time frame works best here . Bigger time frame trend pointer f
This is an indicator for MT5 providing accurate signals to enter a trade without repainting. It can be applied to any financial assets:   Forex Cryptocurrencies Metals Stocks Indices   It will provide pretty accurate trading signals and tell you when it's best to open a trade and close it. How do I trade with the Entry Points Pro indicator? Buy and install the indicator in your terminal Start trading by receiving signals from the indicator telling you about the ideal moment to enter a trade.
For a trader, trend is our friend. This is a trend indicator for MT5, can be used on any symbol. just load it to the terminal and you will see the current trend. green color means bullish trend and red means bearlish trend. you can also change the color by yourself when the indicator is loaded to the MT5 terminal the symbol and period is get from the terminal automaticly. How to use: I use this trend indicator on 2 terminals with different period  for the same symbol at same time. for example M5
VSA target Индикатор определяет на графике профессионального покупателя или профессионального продавца по системе VSA (Volume Spread Analysis) и выстраивает относительно этих баров (свечей) зону поддержки тенденции, а также целевые уровни. Особенности: 1.        В данном индикаторе можно выбрать режим при котором будут определяться только профессиональный покупатель или профессиональный продавец, а также чтобы определялись сразу оба профессиональных участника. 2.        Можно выставить любой tim
Огромное число трейдеров пользуется таким методом анализа, как VolumeProfile/MarketProfile. И я думаю, что не стоит объяснять такие понятия как РОС и VAH/VAL. Однако стандартное представление VolumeProfile имеет недостаток - мы видим лишь текущую картину рынка. Мы видим "выпуклость" распределения объема внутри периода. Но мы не видим главного - "миграция" уровня РОС в процессе движения цены. Настоящий индикатор уникален. Он динамический. Первая особенность - пользователь самостоятельно выбирает
MultiVWAP
Anton Polkovnikov
5 (1)
MultiVWAP Кардинальная переработка всем известного VWAP, представляющая по сути совершенно новый уникальный инструмент. Дается возможность накинуть на график 5 видов различных VWAP: Volume - стандартный VWAP, рассчитывающийся на основе объема No volume - в расчетах отсутствует объем, что позволяет использовать индикатор на графиках, для которых брокер не поставляет объемные данные Volatility - новая разработка, в основу расчета заложена неотстающая волатильность Buyer - расчет VWAP ведется на ос
MQL4 has also been converted to MQL5 exposure info for friends using iexposure. It shows the total number of positions that have been opened, how many buy or sell positions there are, the net amount of position numbers and their order prices, the profit and loss status of all total positions. I didn't write their code, it's open source, but I wanted to share it with everyone because it's an indicator I like! https://www.mql5.com/en/charts/14801856/usdjpy-fix-d1-idealfx-llc
This indicator shows the direction of the trend and trend change. Ganesha Trend Viewer is a trend indicator designed specifically for gold and can also be used on any financial instrument. The indicator does not redraw. Recommended time frame H1. Ganesha Trend Viewer is perfect for all Meta Trader symbols. (currencies, metals, cryptocurrencies, stocks and indices..) Parameter setting MA Short Period  ----- Moving Average short period MA Long Period   ----- Moving Average long period Alerts ON
FREE
Индикатор QRSI - один из важнейших и самых известных индикаторов, который используется трейдерами по всему миру. Также очевидно, что в каждой локальной области данный индикатор способен показывать хорошие входы. Для чего его обычно следует оптимизировать или просто визуально подогнать. Данная разработка предназначена для автоматической оптимизации индикатора. Однажды поставив на график индикатор будет с указанным периодом (PeriodReOptimization) автоматически сам себя пере-оптимизировать и показ
Atr Size Alert
Flavia Freitas Claro Dos Santos Claro
5 (2)
Indicador baseado no ATR (Avarage True Range) que exibe o tamanho em pips ou pontos do ativo. O indicador ATR SIZE ALERT dispara um alerta caso o preço atinja o numero de pips pre definido pelo usuário: Input: Periodo (periodo do indicador ATR) Pips (tamanho do movimento esperado) Alert (alerta sonoro) Além do alerta sonoro, o indicador também possui alerta visual.
FREE
This is a customizable three moving averages indicator useful in crossover trading technique. Yo can set various parameters such as calculation methods (exponential, simple, etc.), period and price type   for each MA separately  from one input dialog.  Parameters: Period <1,2,3> - Period of a moving average Shift <1,2,3> - Shift of a moving average Method <1,2,3> - Method of calculation for each moving average set separately Applied Price <1,2,3> - Set price type for calculations for each movi
FREE
CalendarFilter
Kiyoshi Mizu Miyabi Nori
Are you having trouble with too many events in the economic calendar? This reduces to the minimum number you need. You can filter by country code importance any key words and you can receive alerts before the set time of the event. ++++++++++++++ If country code is blank, display available code on the expert tab. You need to turn off the automatic calendar update setting in MT5. Any sound file of .wav format in Sounds directory. The length of keyword characters is limited by MT5.
FREE
UniversalMA MT5
Mikhail Sergeev
4.89 (38)
Скользящая средняя с огромными возможностями настройки. 10 видов сглаживания. 12 вариантов цены для построения. Возможность дискретизации полученного мувинга. Быстрый код. Возможность использования в экспертах без ограничений. Индикатор UniversalMA объединяет в себе самые востребованные способы построения, используемые в современном трейдинге. Таким образом, больше не нужно иметь множество разных индикаторов. Эксперт на основе индикатора Скользящие средние - это основанные на цене отстающие инди
FREE
Индикатор рисует потенциальные уровни, которые в будущем могут стать значимыми уровнями поддержки и сопротивления. Чем длиннее линия, тем выше вероятность   разворота цены  или усиления движения цены после пробоя этого уровня. С уменьшением вероятности образования уровня, длина линии сокращается. Индикатор не требует подстройки. В настройках можно изменить дизайн индикатора. На график вынесена кнопка " Line_Length " для подстройки длины линий ( для удобства восприятия индикатора ). Выбр
Heikin Ashi MACD
Wojciech Daniel Knoff
5 (2)
Check my version of the moving average convergence divergence (MACD) indicator based on Heikin Ashi calculations. Here you find multi-colored histogram which corresponds to bull (green) / bear(red) trend. Dark and light colors describes weakness/strenght of price trend in time. Also you can switch calculations between normal and Heikin Ashi price type. Note: Buffers numbers for iCustom: 0-MACD, 2-Signal line
FREE
You get a moving average indicator with different methods (exponential, linear, smoothed and linear weighted) calculated on smooth Heikin Ashi candles included in 'Examples' folder of Meta Trader 5. This program is dedicated for everyone trader in the market who is collecting necessary indicators designed for work with reduced market noise to better identify trends and buy opportunity.
FREE
Moving Average Convergence/Divergence — схождение/расхождение скользящих средних — технический индикатор, разработанный Джеральдом Аппелем (Gerald Appel), используемый в техническом анализе для проверки силы и направления тренда, а также определения разворотных точек. Встроенный в MetaTrader 5 индикатор MACD не соответствует задумке автора (Gerald Appel): -линия MACD графически изображена в виде гистограммы, однако гистограммой отражается разница между линией MACD и сигнальной линией;  -сигнал
FREE
A simple price action indicator to highlight inside and outside bars (candles) with colors. It is possible to choose what type of bar can be highlighted among: inside, ouside or both. It is can be possible to choose a first specific color for the shadow and the border of bars (candles), a second specific color for high/bull bar (candle) and a third specific color for down/bear bar (candle)
FREE
Индикатор QRSI - один из важнейших и самых известных индикаторов, который используется трейдерами по всему миру. Все сигналы формируются на открытии бара. Любая цена закрытия или цены нулевого бара заменяются соответственной ценой предыдущего бара, для того чтобы не было ложных результатов. Данный индикатор подойдет для тех, кого интересует классический метод расчета но с улучшенным функционалом. Существует версия как для MT4 так для MT5. По своей природе индикатор QRSI является осциллятором,
This is the Bill Williams Awesome Oscillator indicator calculated from Heikin Ashi candles. Here you find multi-colored histogram which is helpful when identify weakness or strength of trend in the market. To use it, just simply drop it on the chart and you don't need to change parameters except one: switch between Heikin Ashi or normal candles (see attached picture).
FREE
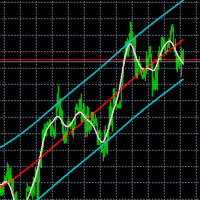
Flex Channel - индикатор строит канал используя фильтр Ходрика-Прескотта.  Фильтр Ходрика-Прескотта -  метод сглаживания временных рядов в целях устранения их циклической компоненты и выделения трендовой составляющей. Канал строится по ценам "Close". Настройки HP Fast Period - количество баров для рассчёта быстрой скользящей средней HP Slow Period - количество баров для рассчёта медленной скользящей средней Дополнительная информация в индикаторе Channel width - ширина канала в пипсах на нуле
MiniCandles
Kiyoshi Mizu Miyabi Nori
5 (1)
This indicator is a very simple indicator that draws candlesticks on a chart. However, it is possible to draw not only on the main chart but also on several sub-charts. In addition,it is possible to draw different symbols and timeframes from the main chart. features. 1. any symbols 2. any timeframes 3. two candle type(normal and heikin ashi) 4. many candle colors(intersection with ma_1) 5. pivot line (ver1.2) In case of positive candle,    FULL     : change color if low is over ma_1    PARTIAL :
FREE
Catch major price movements, early in the trend. Alerts you to enter at the likely beginning of a trend, and if it's incorrect, quickly alerts you to exit to limit any loss. Designed to capture large, profitable price movements, with early entrance to maximize your returns. As shown in screenshots, typical behavior is several quick entrance/exists with small loss , and then capture of a large trend with high profits .  The Instantaneous Trend  indicator is a lag-reduced method to detect price t
Melhor regra de coloração pra RENKO no MT5. Lucre de forma simples no mercado Brasileiro e também no Forex. Gatilhos precisos, indicando ótimos pontos de compra e venda no mercado. Pode ser utilizado no Mini Dólar e Mini índice Pode ser utilizado no mercado Forex. O indicador contém a regra de coloração aplicada ao RENKO. O indicador permite a alteração dos parâmetros: período e tamanho do renko O indicador permite a alteração das cores dos renkos.
"Driver Road Bands" indicator that is designed to be used in the 1H, 4H and 1D timeframes in the most ideal way. If we compare timeframes to roads and streets; main streets and highways with high traffic volume are similar to high-time timeframes in technical analysis. If you can interpret the curvilinear and linear lines drawn by this indicator on the graphic screen with your geometric perspective and develop your own buy and sell strategies; you may have the key to being a successful trader.
FREE
Spike Dragon Indicator is Specially Designed for Boom 300 and Crash 500 Indices. We decided to add the indicator after extensive testing. The strategy is Based on Supply and Demand levels, RSI ,MACD and 1 other custom indicator designed to filter out less probability signals.We accept suggestions in improving our system. Why choosing Spike Dragon : Easy Installation and compatible with MT5 Platform Onpoint Signals on M1 Timeframe making the system fast in generating Spikes Good risk Managemen
Binary Options Assistant (BOA) KAM Signals Indicator provides signals based on gkNextLevel Binary Options Strategy. Indicators: 3 Moving Averages & Stochastic Stop missing trades, stop jumping from chart to chart looking for trade set-ups and get all the signals on 1 chart! U se any of the BOA Signals Indicator with the  Binary Options Assistant (BOA) Multi Currency Dashboard .  All BOA Signal Indicator settings are adjustable to give you more strategy combinations. The signals can be seen v
The Moving Average ( https://www.youtube.com/c/TheMovingAverage/ ) inspired to create All in One 4MA-s with his color setting. It Put up 4 Smoothed Moving Averages With Arty chosed colors. You can modify the settings / Parameters of the indicator It's easy to use don't have to waist time to set up all 4 MA-s just put this up. Hope its helpfull and Arty don't mind it. You can donate my work here: https://discotechnika.hu/MQL/PayPal_Donate.jpg or here PayPal.Me/HunSkippy
FREE
Индикатор определения тренда, дополнит любую стратегию, а также может использоваться как самостоятельный инструмент.  ВАЖНО! Свяжитесь со мной сразу после покупки, чтобы получить инструкции и бонус!  Преимущества Прост в использовании, не перегружает график не нужной информацией; Возможность использования  как фильтр для любой стратегии; Имеет встроенные уровни динамических поддержек и сопротивлений, что может использоваться как для фиксации прибыли, так и для установки стоп-лоссов; Индикатор не
Dark Power MT5
Marco Solito
4.84 (56)
Dark Power  is an Indicator for intraday trading. This Indicator is based on   Trend Following  strategy, also adopting the use of an histogram to determine the right power . We can enter in good price with this Indicator, in order to follow the   strong trend   on the current instrument. The histogram is calculated based on the size of the bars and two moving averages calculated on the histogram determine the direction of the signal Key benefits Easily visible take profit/stop loss lines Int
Если вы еще не знакомы с   торговой стратегией The Strat   , погуглите ее прямо сейчас. Я обещаю, что это не будет пустой тратой вашего времени, и вы, вероятно, научитесь некоторым новым приемам, независимо от того, используете вы их или нет. Итак, теперь, когда вы знаете, что такое TheStrat, вы сможете понять, что этот индикатор может сделать для вас. Ключевая особенность Короче говоря, индикатор будет: Показать непрерывность таймфреймов для всех поддерживаемых таймфреймов Поддерживает два пр
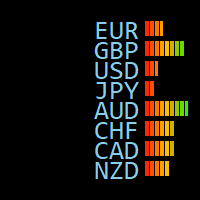
представлять Это торговый помощник, индикаторы информационной панели, сводная статистика валют, статистика счета, информация о позиции, серверное и местное время, сила валюты, оставшееся время K-линии, линии поддержки и сопротивления, смещение времени сервера, курс колебаний валют и другие функции. Может использоваться для всех типов счетов и валют. Отличная производительность, очень мало ресурсов Вы можете настроить положение, цвет, размер шрифта Любой модуль может быть индивидуально отображен
Alert Up Down MT5
William Oswaldo Mayorga Urduy
ПРЕДУПРЕЖДЕНИЕ ВВЕРХ - ВНИЗ ДЛЯ METATRADER 5 Этот индикатор генерирует алерт, когда цена покидает зону между линиями UP и DOWN. Вы можете создавать предупреждения различных типов, например: > Звук > Окно сообщения > Сообщение в поле эксперта > Почта (предварительно настроенная) > PUSH-уведомления (предварительно настроенные) Линии должны быть настроены из свойств индикатора, а не из свойств линий, поскольку, если это делается из свойств линий, это может повлиять на finonacci
[ MT4 Version ] Order Block Indicator MT5 Order Block Indicator MT5 is currently the most accurate and customizable indicator in the market. It has been developed to facilitate the analysis of operations based on Order Blocks and Supply and Demand Zones. These zones are possible reversal points of a movement. Order Blocks indicate a possible accumulation of orders in one area. The price usually gets to reach and react strongly to those areas. The most relevant levels for this reaction are the c
Мультивалютный индикатор Currency Strength Index Plus может быть установлен на график любой из 28 валютных пар, образованных 8 валютами (USD, EUR, GBP, AUD, NZD, CAD, CHF и JPY), например, на EURUSD, H1. Индикатор создан для определения направления силы каждой из 8 валют относительно друг друга. Используя силу и ее направление двух противоположных валют можно составить валютную пару с наилучшим торговым потенциалом. Индексы валют имеют гибкие настройки сглаживания и не перерисовываются. На скрин

MetaTrader Маркет позволяет максимально безопасно покупать программы для платформы MetaTrader. Вы можете скачать демо-версии понравившихся роботов и индикаторов прямо из терминала и проверить их в тестере стратегий.

Протестируйте программы в различных режимах перед покупкой для получения максимального представления о продукте и оплатите понравившийся продукт через платежную систему MQL5.community.

Платежная система MQL5.community обеспечивает оплату продавцам, а возможность тестирования программ в различных режимах позволяет покупателям получить максимальное представление о продукте.