Смотри обучающее видео по маркету на YouTube
Как купить торгового робота или индикатор
Запусти робота на
виртуальном хостинге
виртуальном хостинге
Протестируй индикатор/робота перед покупкой
Хочешь зарабатывать в Маркете?
Как подать продукт, чтобы его покупали
Новые технические индикаторы для MetaTrader 5 - 35

This is a multi frame stochastic indicator, you can attach any time frame of stoch indicator on one chart. It is very useful if you like to check multi time frame stoch data. If you are interested in EA,click below links to take a look: https://www.mql5.com/en/market/product/80170 https://www.mql5.com/en/market/product/81136
How to use: > Atach the first time frame you want on to the currency pair's chart > Atach the second time frame you want on to the currency pair's chart > Atach the thir
FREE
The Round Number Drawer is an indicator that automatically draw lines or zones at the psychological levels (00 or 50) as the market moves. New lines are drawn as the market moves while the old lines are deleted. This ensures that your chart is clutter-free. The user specifies the number of lines preferred on the chat, and the indicator keeps the number of lines constant. The indicator plots two types of levels, the Main Level (00 levels e.g. USDCAD 1.33000, 1.34000) and the Sub Level (50 levels

Supertrend indicator uses a combination of a moving average and average true range to detect the trend of a trading instrument.
Supertrend indicator for MetaTrader 5 easily shows the trend as a line following the price.
You can use the second my indicator: You will see 3 supertrends and EMA 200 lines on the screen.
Working with my product :
https://www.mql5.com/en/market/product/80692
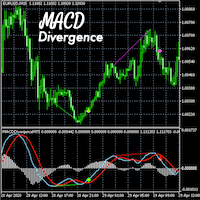
MACD Divergence Detector MT5
- Non-repainting - Live divergence detection - Accurate MACD indicator - Includes 10 indicator buffers - EA friendly - Includes useful customizable settings - Decide which buffers to display on the chart and their colors
The MACD Divergence Detector for MT5 is an accurate and useful tool for detecting and displaying MACD divergences and good places to take long and short trades. It includes 10 buffers and customizable settings. This tool does not repaint and ca

Volume Profile Indicator used by professional Traders at Traders Inside Ltd. If you want to succeed in trading you need to know if current price is cheap, expensive or fair valued. Key features: Fair price (Point of control, POC), high and low price zones (POH, POL) POC in different timeframes for better orientation Symbol and timeframe Chart resize on open positions/orders, VPRmax/min Historic POC - see, how POC has changed the last periods Button to show/hide VPR
Calculated Bars (best results
!! FLASH SALE !! Over 80% off !! For ONE week only. Now only $47 - normally $297! >>> Ends on 30 June 2023 - Don't miss it!
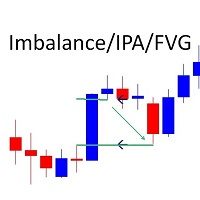
Marks Market I mbalance / Improper Price Action / Fair Value Gaps on The Chart As traders continue to search for the best trading indicators to guide their investments, the I mbalance / I mproper P rice A ction / F air V alue G ap I ndicator has become increasingly popular. This indicator helps to identify opportunities for taking profit . The indicator begins

MACD with fast and slow EMA. Moving average convergence divergence (MACD) is a trend-following momentum indicator that shows the relationship between two moving averages of a security's price . The MACD is calculated by subtracting the fast-period exponential moving average (EMA) from the slow-period EMA. Setup options: Fast EMA period Slow EMA period Signal EMA period Applied price Indicator window height Color MACD Color Signal Color Histogram
Average Daily Range with factor target and more functions (ADR)
Hello traders,
The upgraded ADR dashboard now is also for MT5 much more better and more convenient for day trader, try it to experience the good things!
How to use Average Daily Range (ADR) Indicator?
ADR is just a simple indicator tool to help trader identify the daily average range of an instrument. So for example we have the pairs EURUSD and that pairs usually makes a peak and bottom during the trading day an

The most sensitive indicator you've ever seen! And now with Alerts
POscillator Alert is a sensitive indicator that finds each trend direction change in every timeframe and then notifies you with the necessary alarms. It's a new version of the POscillator Indicator, with the addition of its alarm sending capability. The Indicator can send multiple alerts: email, mobile phone notification, alert window and alert sound. All of these different alarms are optional and you can choose the ones you
Александр Сергеевич Рыжков, [12.05.2022 7:02] SWI - Spread Widening Indicator.
Индикатор расширения спреда - должен быть в арсенале каждого опытного пользователя платформы Meta Trader.
Данный индикатор позволяет анализировать, аномальные ночные и новостные расширения спредов,
с помощью чего дополнительно максимизировать свою прибыль и снизить свои риски.
Для использования необходимо просто установить на график и подобрать цвет подходящий под ваш график.

30% Discounted ONLY 10 COPIES HURRY UP! 8 LEFT COPIES MTF UPDATED IN NEW VERSION Note: If MTF Order Not Work just do one thing one, when you set Show_mtf to true then don't change otf timeframe instead you insert indicator and then again open setting and change current otftimeframe to other in this way it will work. It issue from Mql5 not refresh setting properly. Very precise patterns to detect High Accurate Order Blocks: It Draw zone after market Structure Breakout with a high Accuracy,

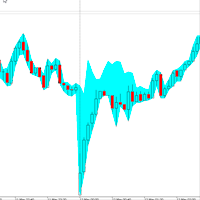
Этот индикатор сделан на основе дискретного преобразования Хартли. Использование этого преобразования позволяет применять разные подходы при обработке финансовых временных рядов. Отличительная особенность этого индикатора - его показания относятся не к одной точке на графике, а ко всем точкам периода индикатора. При обработке временного ряда индикатор позволяет выделять различные элементы временного ряда. На этом подходе построен первая возможность фильтрации - просто отбрасываются все ненужные
Этот фильтр построен на основе полиномов Бесселя. Его основное достоинство – маленькая временная задержка. Другая особенность этого фильтра - высокая чувствительность к последним значениям финансового временного ряда. Из-за чего индикатор выделяет активные движения цены, сглаживая при этом шумовые отклонения. Кроме классического варианта в индикатор, в качестве весовой функции, добавлены логарифмы коэффициентов Бесселя. В этом случае индикатор получается более сглаженным, но при этом он может
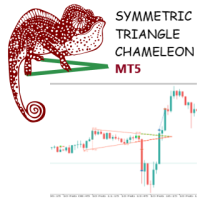
Triangle patterns are chart formations that signal a possible breakout in either direction. In the case of symmetrical triangles, the probability of a breakout to the upside or downside is about 50%. For more detailed information, I recommend the numerous publications on the Internet on this subject. What is special about this indicator is that it can be integrated into your own MT5 applications, such as scripts, Expert Advisers, etc. using the implemented indicator buffer via the iCustom() func
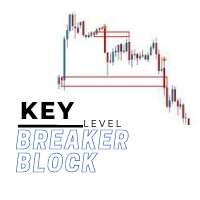
The key level breaker block indicator automatically draws breaker blocks for you on the chart. Breaker blocks are, in short, failed order blocks, but create strong support and resistance zones when price comes back to re-test them.
Advantages
The key level breaker block DOES NOT RE-PAINT, giving you confidence when a signal appears and also helps when looking back. The key level breaker block includes an on/off button on the chart to easily keep the charts clean after analysis by just on
Новичок или эксперт, наша первоклассная многопрофильная система Turn Prof улучшит ваш обмен и предоставит вам удивительные открытые двери обмена с уровнями помощи и препятствий, которые используют эксперты.
Обмен оборотов — это простой и убедительный метод входа и выхода из рынка на ключевых уровнях, который используется экспертами в течение довольно долгого времени и устраняет все изображения: Forex, Crypto, Stocks, Indicies и так далее.
Turn Prof предоставляет брокеру премиальные уровни,

Imbalance / Fair Value Gap (FVG) , this is a zone / gap created when the price move with force in a given direction. It identify a zone where the price could potentially go back. This gives perfect targets for your trades.
Imbalance is created from the high and low of 3 candles. When the wicks the of 1st and 3rd candle does not fully overlap the middle one.
This indicator will help you to easily spot mitigated/unmitigated imbalances in your chart. NEW UPDATE: Added Multi-Timeframe feature

Average Daily Range (ADR) with Support (S) and Resistance (R) Levels is an indicator which shows how far a currency pair can move in a day. It can be used to find hidden support and resistance levels, estimate effective profit and stop loss targets, and provide short term trade signals from the hidden S and R levels. Features
Automatically plots on the chat, the top and bottom of the ADR value (i.e. a horizontal channel) which acts as Support and Resistance Levels Automatically calculates the
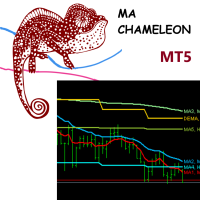
This indicator was developed by me, based on my experiences during my long term daily trading. It allows to get an excellent and compact overview about the current market situation without to have to monitor multiple charts. The default settings are widely used by traders. For example on sites like forexlive.com: https://www.forexlive.com/technical-analysis Features: The Moving Average Swiss Knife-like indicator for Daytraders Allows to setup of up to seven different MAs (MA and DEMA) to use on
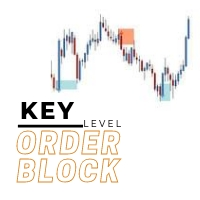
The key level order block indicator automatically draws order-blocks for you on the chart. The indicator compliments any strategy and can also be used as an independent tool. It can work with smart money concepts, harmonic patterns, supply and demand, flag patterns, Quasimodo strategy and many more.
Advantages
The key level order block DOES NOT RE-PAINT, giving you confidence when a signal appears and also helps when looking back. The key level order block includes an on/off button on th

[ MT4 Version ] Bulls and Bears Power Bulls and Bears Power is an indicator that clearly highlights if bulls or bears are currently in control of the market. A price movement started with high Bulls control in the market can indicate the beginning of a new trend movement. The relative indicator power between price peaks also indicates if the movement is losing strength and might foresee a significant correction or a trend reversal. Bulls and Bears Power indicator offers a clear and simplified vi

The best Vwap Midas coding for Metatrader 5 you can find in White Trader indicators.
The indicator has been optimized not to recalculate (improving performance) and has several visual settings for you to adapt in your own way. TRY IT FOR FREE by clicking the free demo button Where and why to use Vwap Midas (and Auto Zig Vwap Midas) can be used on a variety of indices, currencies, forex, cryptocurrencies, stocks, indices and commodities.
Many successful traders use price and volume to ge

The Market Sessions Indicator for MT5 helps you predict market turnarounds by detecting major supply and demand areas. These pivot points tend to occur after a new session has started and the previous one is still open. It is also used to gauge how many points or pips the market moves on average during a session. This helps us to place better our take profits and stop losses. The indicator works on all forex pairs, gold, silver, commodities, stocks, indices and any other instrument that your

Supertrend indicator uses a combination of a moving average and average true range to detect the trend of a trading instrument.
Supertrend indicator for MetaTrader 5 easily shows the trend as a line following the price.
Triple SuperTrend Histo indicator calculate three supertrends to show the trend as a histogram. Changing the color from red to green means you can BUY , from green to red means you can SELL .
Description of the method of drawing a histogram. The price is above the EMA 20
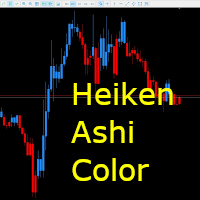
Change the timeframe of a subchart in bulk Change the scale of a subchart in bulk
Reflect only the color of the average bar on the chart
Display the high and low prices of the previous month, the previous week, and the previous day
Indicator.
When the average bar is displayed, it will be difficult to see the chart pattern by all means, so only the color is reflected. This makes it difficult to overlook the shape of candlesticks, such as pin bars and reversals.
It can be recommended f

The VWAP Level indicator is a technical analysis tool that calculates the weighted average price for the traded volumes of a specific asset. The VWAP provides traders and investors with the average price of an asset over a specific time frame.
It is commonly used by investors to compare data on "passive" trading operations, such as pension funds and mutual funds, but also by traders who want to check if an asset has been bought or sold at a good market price.
To calculate the VWAP level we
FREE
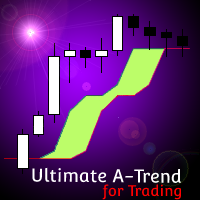
[ MT4 Version ] Ultimate Alpha Trend MT5
Ultimate Alpha Trend is the first trend indicator, which combines volatility, volume, average price and momentum. The results is a highly versatile representation of trendy and sideways market conditions, highlighting, at the same time, significant supply and demand levels. The Ultimate Alpha Trend indicator can be used to find entry oportunities and to set SLs taking into consideration current market volatility, volume and momentum. Besides that, the in

Description: The Multi POC displays multiple Point Of Controls on one chart. This Indicator is also already included in the "VolumeProfile" Indicator .
Features: Customizable Range POC Customizable section POCs with VAL&VAH lines Works on all timeframes Drag & Drop for live calculation
Support: The indicator is constantly being developed and improved. Please do not hesitate to contact me via the MQL5 Platform. I am very grateful about any Bug report, so that i can constantly improve the ind
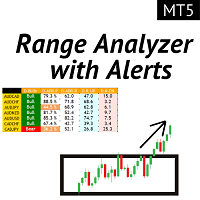
Индикатор Range Analyzer показывает средний диапазон пипсов валютной пары, измеренный за определенное количество периодов. Трейдеры могут использовать ADR для визуализации потенциального движения цены за пределами среднего дневного движения. Когда ADR выше среднего, это означает, что дневная волатильность выше, чем обычно, что означает, что валютная пара может выходить за пределы своей нормы. Наш анализатор ADR состоит из 5 основных функций: Range (ADR) Screener: мультивалютный анализ ADR. Зон

ПОКАЗАТЕЛЬ ДЛЯ КАЖДОГО Pip Scalper предназначен для скальпинга трендов. Оставайтесь в тренде дольше с этим индикатором. Работает на всех таймфреймах и активах. Собирайте ежедневные пипсы с помощью этого инструмента. Используйте скользящую среднюю 200 для фильтрации сделок. Рекомендуется использовать меньшие таймфреймы. Используйте для дневной торговли.
О и как использовать:
Pips Scalper основан на долгосрочной торговле по тренду. Купить на синем Продать на красном Используйте скользящую
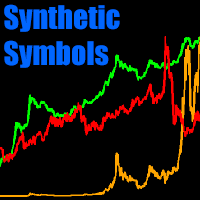
Выполняйте любую операцию между вашими терминальными символами (или вашими пользовательскими) для создания пользовательских синтетических символов : логарифмические шкалы, относительные показатели (акции против SP500, золото против серебра...), валютные индексы... возможности безграничны! Вы можете выполнять любую математическую операцию между символами и константами свеча за свечой. Включены функции для получения минимума [min(a,b)] или максимума [max(a,b)] между двумя значениями и квадратн

The Forex Master Pattern is an alternative form of technical analysis that provides a framework which will help you to find and follow the hidden price pattern that reveals the true intentions of financial markets. This algorithm here does a good job detecting the Phase 1 of the Forex Master Pattern cycle, which is the contraction point (or Value).
On Phase 2 we get higher timeframe activation (also called Expansion), which is where price oscillates above and below the average price defined

Cybertrade Keltner Channels - MT5 Created by Chester Keltner, this is a volatility indicator used by technical analysis. It is possible to follow the trend of financial asset prices and generate support and resistance patterns. In addition, envelopes are a way of tracking volatility in order to identify opportunities to buy and sell these assets.
It works on periods longer than the period visible on the chart. All values are available in the form of buffers to simplify possible automations.
FREE

Cybertrade ATR Trend Zone - MT5 The indicator shows, by calculating the ATR (Average True Range), the zone of probable price resistance. Indicated to be used as a probable exit point of an operation.
It works on periods longer than the period visible on the chart. All values are available in the form of buffers to simplify possible automations. This indicator is the same one we use in our EA. Also check out our other products.
FREE

Cybertrade Double Bollinger Bands - MT5 The Bollinger Bands indicator shows the levels of different highs and lows that a security price has reached in a given duration and also their relative strength, where the highs are close to the upper line and the lows are close to the lower line. Our differential is to present this indicator in a double form, with the availability of its values to simplify automation.
It works on periods longer than the period visible on the chart. All values are
FREE

Trend Entry Indicator Your Trading will Be easier with this indicator!!! This Indicator is Developed To make our trading life easier. Get an Arrow for Entry with Take Profit and Slop Loss marks on chart. - Indicator is Based on trend, because thats what we all want we want to follow the trend "it's our friend". - Based on Levels, price action and oscillators. - It works on all currency pairs, all indices, metals and stock. - it works on all pairs/indexes on Deriv including Boom and Crash. - Tim
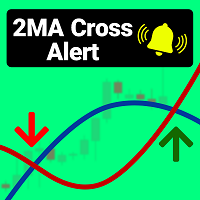
This indicator setup two Moving Average indicators and when the smaller Moving Average (2) crosses the larger one (1) , you will be notified by Popup alert, mobile notification, or Email.
If your strategy works with two Moving Average indicators, you do not need anymore to constantly and tediously look at the chart. You should just add this indicator to the chart according to your required settings, and whenever the defined cross (up or down) is done, it notifies you and you wouldn't miss the

У каждого индикатора есть свои достоинства и недостатки. Трендовые показывают хорошие сигналы во время тренда, но запаздывают во время флэта. Флэтовые прекрасно себя чувствуют во флэте, но при наступлении тренда сразу же умирают. Все это не было бы проблемой, если было бы просто предсказать, когда тренд сменится флэтом, а флэт сменится трендом, но на практике это крайне серьезная задача. Что если разработать такой алгоритм, который сможет в индикаторе устранить недостатки и усилить его достоинст

The Market Sessions Indicator for MT5 helps you predict market turnarounds by detecting major supply and demand areas. These pivot points tend to occur after a new session has started and the previous one is still open. It is also used to gauge how many points or pips the market moves on average during a session. This helps us to place better our take profits and stop losses. The indicator works on all forex pairs, gold, silver, commodities, stocks, indices and any other instrument that yo
You can identify the strength of the main forex currencies with this tool. You can combine it with different styles and get the best strategy out of it. It has very high power. It can be customized.
MT4 version
This indicator will have many updates and special settings will be added to it.
You can contact us via Instagram, Telegram, WhatsApp, email or here. We are ready to answer you.

Highly configurable Volume indicator.
Features: Highly customizable alert functions (at levels, crosses, direction changes via email, push, sound, popup) Multi timeframe ability Color customization (at levels, crosses, direction changes) Linear interpolation and histogram mode options Works on strategy tester in multi timeframe mode (at weekend without ticks also) Parameters:
Volume Timeframe: You can set the lower/higher timeframes for Volume. Volume Bar Shift: you can set the offset of th
FREE

Color Candle Indicator. The indicator implements a breakout system using the channel. When price exits the gray channel, the candlestick color changes to the color corresponding to trend direction. Blue for growth, yellow color for fall. Bright colors denote coincidence of trend direction and direction of a candlestick. Dark colors correspond to the situation when the direction of a candlestick is opposite to trend.
FREE

The US Dollar Index, also known as DXY, is used by traders seeking a measure of the value of USD against a basket of currencies used by US trade partners. The index will rise if the Dollar strengthens against these currencies and will fall if the Dollar weakens against these currencies. Plan your technical analysis of the US Dollar Index by tracking its price in the chart and keep up with the latest market movements with news, advice pieces, and the dollar index forecast. The U.S. dollar index (

Description Price action patterns detection that can work as triggers in any trading strategy, It include Flag, Flag Top, Flag 1234, and micro pullback patterns Support: We create great tools for the entire trading community. Most of them are free. If you believe in what we do Support Us Here. How is this indicator useful? You can use the indicator signals as a trigger to entry in the market and complement any trading strategy. Components Note 1: This indicator should only be considered a

AUTO MIDAS VWAP Volume Weighted Average Price (VWAP) is a trading benchmark commonly used by Big Players that gives the average price a Symbol has traded throughout the day. It is based on both Volume and price.
Commonly, MIDAS VWAP damand you to determine the initial point of analysis. This indicator plots automatically based on ZigZag Approach.
You will be able to use up to 3 HIGH MIDAS VWAP's and 3 LOW MIDAS VWAP's.
Wish the best trade results!!

Ayuda a interpretar la tendencia del precio de mercado de acuerdo a las mediciones en tiempo real, ideal para reforzar los resultados mostrados por el RSI las bandas de Bollinguer. Recuerde que el mercado de instrumentos financieros es altamente volatil, no opere con dinero que ponga en riesgo su estabilidad financiera. Solo use fondos que este dispuesto a perder. Resultados pasados no garantizan resultados futuros. Mantenga Siempre control sobre el riesgo.

Среднее Лемера можно рассматривать как оконную функцию, весовые коэффициенты которой зависят от значений используемых при расчете переменных. Это среднее является нелинейным, так как при его расчете используется возведение в степень. Характеристики индикатора зависят от двух параметров: iPeriod - период индикатора, допустимое значение больше или равно 2; iPower - показатель степени, который используется прирасчете значений индикатора. Допустимый интервал от -32 768 до 32 767
При iPower =
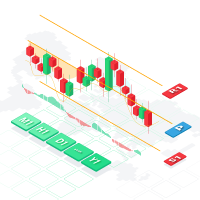
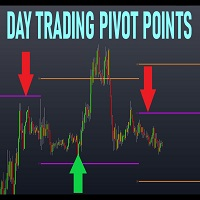
Построение точек разворота Traditionnal, Fibonacci, Woodie, Classic, Demark, Camarilla для любого таймфрейма
Поддержка всех типов разворотов Traditionnal, Fibonacci, Woodie, Classic, Demark, Camarilla Поддержка любого таймфрейма (M1...H1...D1...MN1...Yearly) Поддержка перехода на летнее время Поддержка ежедневного раздела форекс от открытия в Сиднее до закрытия в США Поддержка торговли криптовалютами Заполните разрыв между разворотной точкой и трендом, очень полезно
Разворотные точки показы

Cybertrade Auto Fibonacci retraction and projection - MT5
##### Free indicator for an indefinite period. ##### Auto Fibonacci is an indicator that automatically plots the Fibonacci retracement and projection based on the number of bars you select in the indicator setting. You can customize nine different levels of retraction and three levels of projection. It works on periods longer than the period visible on the chart. All values are available in the form of buffers to simplify possible au
FREE
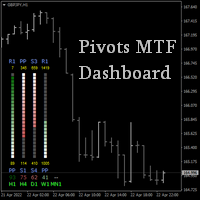
Если Вы торгуете по уровням, то этот индикатор для Вас.
Индикатор отображает уровни поддержки и сопротивления для выбранных таймфремов, дополнительно показывая сколько пунктов до ближайших уровней, а также между какими уровнями находится текущая цена в виде цветной шкалы и процентов.
Расположение в любом месте на чарте, возможность масштабирования, смещение расчёта с учётом часовой разницы Вашего брокера, выбор цветовой гаммы и прочие параметры позволят настроить индикатор на Ваше усмотрени

"Hunttern harmonic pattern finder" base on the dynamic zigzag with the notification and prediction mode
This version of the indicator identifies 11 harmonic patterns and predicts them in real-time before they are completely formed. It offers the ability to calculate the error rate of Zigzag patterns depending on a risk threshold. It moreover sends out a notification once the pattern is complete.
The supported patterns:
ABCD BAT ALT BAT BUTTERFLY GARTLEY CRAB DEEP CRAB CYPHER SHARK THREE
FREE

This indicator calculates gann support and resistance prices with use gann pyramid formulation and draw them on the chart. And If you want, Indicator can alert you when the current price arrive these pivot levels. Alert Options: Send Mobil Message, Send E-mail, Show Message and Sound Alert Levels: S1, S2, S3, S4, S5, R1, R2, R3, R4, R5 Inputs: GannInputPrice: Input price for gann pyramid formulation. GannInputDigit: How many digit do you want to use for calculation formula. (The number and the
FREE
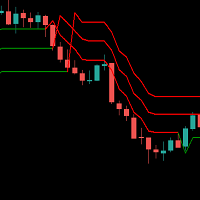
Supertrend indicator uses a combination of a moving average and average true range to detect the trend of a trading instrument.
Supertrend indicator for MetaTrader 5 easily shows the trend as a line following the price.
USAGE THIS INDICATOR If the closing prices are above Supertrend Line, there is a Bullish sentiment at that moment. The opposite is a Bearish sentiment. Three green lines - Strong Bullish sentiment. Three red lines - Bearish sentiment.
For BUY : - Three green lines and pric

KT Higher High Lower Low marks the following swing points with their respective S/R levels: Higher High: The swing high made by the price that is higher than the previous high. Lower High: The swing high made by the price that is lower than the previous high. Lower Low: The swing low made by the price that is lower than the previous low. Higher Low: The swing low made by the price that is higher than the previous low.
Features The intensity of swing high and swing low can be adjusted by cha

Highly configurable Average True Range (ATR) indicator.
Features: Highly customizable alert functions (at levels, crosses, direction changes via email, push, sound, popup) Multi timeframe ability Color customization (at levels, crosses, direction changes) Linear interpolation and histogram mode options Works on strategy tester in multi timeframe mode (at weekend without ticks also) Adjustable Levels Parameters:
ATR Timeframe: You can set the lower/higher timeframes for ATR. ATR Bar Shift: y
FREE

This indicator is the advanced edition of WRP&KD support resistance designed according to the combination of WPR, Stoch, RSI, CCI, and tick volume indicators. You can add other timeframe's support and resistance on the current chart. When WPR, Stoch, RSI, CCI goes up the same time quickly and the volume become larger, the price may meet strong resistance, many times short order will take profit, but if the price break through it, Long positions are more likely to be profitable, and the

25% off. Original price: $40 RSI Scanner is a multi symbol multi timeframe RSI dashboard that monitors Relative Strength Index indicator for price entering and exiting overbought and oversold in up to 28 symbols and 9 timeframes.
Download Demo here (Scans only M1, M5 and M10) Settings description here MT4 version here
RSI Scanner features: Signals RSI entering and exiting the overbought and oversold zones. Monitors 28 customizable instruments and 9 timeframes at the same time. Supports

Benefits of the Surfboard indicator :
Entry signals without repainting If a signal appears and is confirmed, it does NOT disappear anymore, unlike indicators with repainting, which lead to major financial losses because they can show a signal and then remove it. perfect opening of trades The indicator algorithms allow you to find the Peak and floor position to enter a deal (buy or sell an asset), which increases the success rate for each and every trader using it. Surfboard works with any asse

its not just an Indicator. its a trading system I'm working on for 3 years and also would be updated you don't need any thing else to trade because its a price action indicator that shows all static and dynamic support and resistance this indicator contains 7 lines that gives us dynamic support and resistance also when main lines (white ones) become flat for 26-52 periods they show strong levels. you can find consolidating areas, strong downtrend(in Green channel) and strong uptrend(in Red Chan

Наконец то интерфейс стал удобным. Теперь вы можете мышкой управлять периодом индикатора. Просто нажмите на кнопку и прокрутите колесо мышки для увеличения или уменьшения периода CCI. Кнопку можно разместить в любом удобном месте, закрепить ее и использовать одним нажатием. На одном графике можно установить несколько индикаторов и управлять ими как по отдельности так и всеми сразу. Простая установка на график позволяет не заботится о переименовании или изменении параметров каждого индикатора, ав
FREE

Индикатор каждый день показывает тренд и цели на текущую ситуацию. Так же индикатор уменьшает количество убыточных сделок, за счёт правильного определения рыночных условий. Предназначен для анализа и торговли внутри дня. Как использовать: Голубая линия показывает цену открытия дня, от нее устанавливаются по особой формуле 4 линии, определяющие цели на текущий день. Можно искать и открывать сделки в сторону тренда. Серая линия это первая цель. При достижении ценой этих уровней лучше закрыть часть
FREE

Фильтр Колмогорова - Журбенко можно рассматривать как специальную оконную функцию, предназначенную для устранения спектральной утечки. Этот фильтр оптимален для сглаживания стохастических (в том числе и финансовых) временных рядов. Индикатор, построенный на основе этого фильтра содержит следующие параметры: iLength - период исходного прямоугольного окна, применяемого для построения фильтра. Допустимое значение 2 - 255. iDegree - порядок фильтра. Если iDegree=0, то получится простая скользящая с

Выделяет торговые сессии на графике
Платная версия продукта Trading Sessions Indicator Free с возможностью пользовательской настройки начала/окончания сессий.
Trading Sessions Indicator (Индикатор торговых сессий) отображает начало и окончание каждой торговой сессии.
[ОПЦИИ:] Asian session Open Asian session Close Asian session OpenSummertime Asian session CloseSummertime European session Open European session Close European session Open European session Close Timeshift
Для лучших резу

Simple Super Trend indicator for MetaTrader 5. A trend indicator similar to moving averages. Use it for entry and exit signals. It gives accurate signals on precise time. Works as a Trailing SL/TP. This indicator can also be used on multiple timeframes where you place it on a larger timeframe then go to a lower timeframe. Super Trend needs to be used in conjunction with other indicators like rsi, Parabolic SAR, MACD, etc to receive filtered signals.
FREE

Transaction Data Analysis Assistant: This is a statistical analysis tool for transaction data, and there are many data charts for analysis and reference. language: Support language selection switch (currently supports Chinese and English active recognition without manual selection) The main window shows: Balance display Total profit and loss display Now the position profit and loss amount is displayed Now the position profit and loss ratio is displayed The total order volume, total lot size, and
FREE

Only 5 copies of the EA at $30! Next price --> $45 Find charts and signals based on harmonic patterns, which work great in 1-hour timeframes and up.
Buy and sell signs based on different harmonic patterns as follows:
0: ABC_D
1: ABCD_E
2: 3Drive
3: 5_0
4: Gartley
5: Bat
6: Crab
7: Butterfly
8: Cypher
9: NenStar
10: Shark
11: AntiBat
12: AntiGartley
13: AntiCrab
14: AntiButterfly
15: AntiCypher
16: AntiNenStar
17: AntiShark
How to use:
When there is an opportunity to
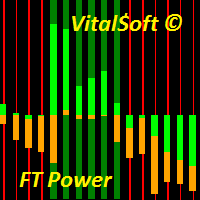
Индикаторная система FT Power предназначена для определения направления тренда ценового графика. Состоит из двух гистограмм. Центральная гистограмма Bull/Bear Power определяет преобладание силы быков или медведей. В моменты, когда значение индикатора выше нулевой отметки, Bull/Bear Power показывает, что «быки» сильны, а когда гистограмма становится ниже 0, то «быки» выбиваются из сил и дальнейший рост становится сомнительным. Основная гисторгамма служит для определения трендовых либо флетовых уч

This indicator is designed according to the combination of WPR and Stoch indicators, when WPR goes up and Stoc goes up quickly too, the price may meet strong resistance, many times short order will take profit, but if the price break through it, Long positions are more likely to be profitable, and the reverse held true as well. You can adjust the parameters of WPR and Stoc to Adapt the symbol you operate. Click here to look the advanced edition: https://www.mql5.com/en/market/pro
FREE

Offer 249 down from 350 for the next 1 copies. then back to 350 $
Are you tired of using outdated indicators that leave you guessing where to set your profit targets? Look no further than the AK CAP Opening Range Breakout Indicator. This powerful tool is backed by a US patent and has already helped countless traders pass funded challenges like FTMO. We use it daily on our prop traders and internal funds, and now it's available to you as well. The calculation behind the indicator is incredibly

Trend Reversal alert: The concept of the EA is to give you a message/alert when something happens in the market, so you will never pass a tradechance for a trendreversaltrade. The EA give you the message when the chance is higher for a trendreversal, but it is important to say that this doesn`t mean that you should trade every signal. The advantage provided by the program is that you don`t need to sit the hole time for the PC and look at the chart because you get a message when a good trendrever
FREE
MetaTrader Маркет предлагает каждому разработчику торговых программ простую и удобную площадку для их продажи.
Мы поможем вам с оформлением и подскажем, как подготовить описание продукта для Маркета. Все продаваемые через Маркет программы защищаются дополнительным шифрованием и могут запускаться только на компьютере покупателя. Незаконное копирование исключено.
Вы упускаете торговые возможности:
- Бесплатные приложения для трейдинга
- 8 000+ сигналов для копирования
- Экономические новости для анализа финансовых рынков
Регистрация
Вход
Если у вас нет учетной записи, зарегистрируйтесь
Для авторизации и пользования сайтом MQL5.com необходимо разрешить использование файлов Сookie.
Пожалуйста, включите в вашем браузере данную настройку, иначе вы не сможете авторизоваться.