 MetaTrader 5
 Эксперты
 Индикаторы
 Библиотеки
 Утилиты
 Виджеты
 Правила
Смотри обучающее видео по маркету на YouTube
Как купить торгового робота или индикатор
Запусти робота на
виртуальном хостинге
виртуальном хостинге
Протестируй индикатор/робота перед покупкой
Хочешь зарабатывать в Маркете?
Как подать продукт, чтобы его покупали
Новые технические индикаторы для MetaTrader 5 - 135
 На основании сигналов технических индикаторов принимаются решения относительно открытия или закрытия сделки на фондовом и форекс-рынках. Суть индикаторов заключается в математическом преобразовании цены и/или объемов финансового инструмента для прогнозирования изменений цен в будущем.
Протестируйте технические индикаторы, чтобы лучше предсказывать поведение рынка и зарабатывать на этом.

L'indicatore "Heikin Ashi" è stato progettato per migliorare l'analisi dei grafici finanziari con un sistema di candele Heikin Ashi. Le candele Heikin Ashi sono un metodo avanzato per visualizzare il prezzo, che aiuta a filtrare il rumore del mercato, rendendo più chiara l'interpretazione dei trend e migliorando la qualità delle decisioni di trading. Questo indicatore consente di visualizzare le candele Heikin Ashi al posto delle candele giapponesi tradizionali, rendendo l'analisi grafica più pu
FREE

The SuperTrend Strategy is a widely-used technical indicator based on the Average True Range (ATR), primarily employed as a trailing stop tool to identify prevailing market trends. The indicator is designed for ease of use while providing reliable insights into the current market trend. It operates based on two key parameters: the period and the multiplier . By default, it uses a period of 15 for the ATR calculation and a multiplier of 3 . The Average True Range (ATR) plays a crucial role in th
FREE
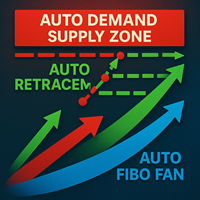
From REAL KNOWLEDGE to TRADE LIKE A PRO! CHoCH Power Indicator – Instant BOS & Demand/Supply Zone Detection Transform your gold trading with crystal-clear insights: Trade Gold Effortlessly on M1 & M5 Spot Demand/Supply Zones on M15 & H1 Automatic 61.8% Fibonacci Retracement on M5, M15 & H1 Works Best with SMA 420 Price above SMA420 → Only consider LONG Price below SMA420 → Only consider SHORT SCM Multi-Frame Fibo Suite Multi-Timeframe Swing Detection
• Auto-identify swing highs & lows
• Rea

Индикатор MA Color Candles MA Color Candles — это индикатор для визуального отображения рыночного тренда путем окрашивания свечей на графике. Он не добавляет объектов и не искажает котировки, а изменяет цвет реальных свечей в зависимости от состояния двух скользящих средних. Это позволяет быстро оценить направление цены и использовать индикатор как фильтр в стратегиях. Принцип работы Бычий тренд: быстрая MA выше медленной, медленная MA растёт (зелёные свечи). Медвежий тренд: быстрая MA ниже мед
FREE

Advanced Volume Profile Analysis Tool for MetaTrader 5 The Kecia Volume Profile Order Finder provides traders with volume profile analysis capabilities. This MT5 indicator combines volume profile visualization with statistical calculations to help identify potential trading opportunities and suggests entry, stop loss, and take profit levels based on market structure. Market Profile Visualization Transform your chart with customizable volume profile visualizations: Multiple visualization options
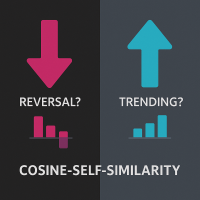
Cosine-Self-Similarity: Identify Trends & Reversals
What is Cosine Similarity? Cosine similarity measures how alike two sequences are by looking at the angle between them. A value of +1 means they move perfectly together, -1 means they move perfectly opposite, and 0 means there's no directional relationship. This indicator applies this concept to price returns.
Is the market trending strongly, or is it choppy and reversing? Gain insight with the Cosine-Self-Similarity indicator!
This powerfu
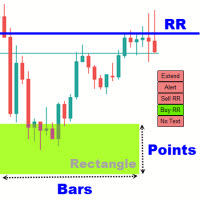
Rectangle Trading Custom is a powerful technical analysis tool designed for price action and range-based traders. It allows users to define consolidation zones and receive alerts when the price breaks out of these zones or approaches trendlines drawn on the chart. Rectangles and Trendlines will be extended into future with one click. Rectangle point size, name and prices will be displayed around rectangle. Key Features: Draw Trading Zones (Rectangle Zones)
Users can manually draw rectangles to

Break Even Zone – Real-Time Floating P/L Visual Indicator Quick Overview:
Break Even Zone is a powerful visual indicator that automatically highlights your floating profit or loss directly on the chart. It displays a red zone when your open trades are in floating loss , and a green zone when they are in floating profit – helping you make smarter, faster decisions. ️ Key Features: Red Zone Block appears when your trades are in floating loss Green Zone Block shows up when trades are in f
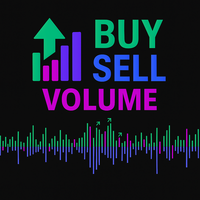
Индикатор объемов покупок/продаж с парной дивергенцией для MT 5 Индикатор объемов покупок/продаж — это пользовательский технический индикатор, разработанный для MetaTrader 5, предназначенный для анализа и визуализации объемов тиков покупок и продаж в отдельном окне. Он предоставляет трейдерам информацию о рыночной динамике, выделяя доминирование объемов, баланс и паттерны дивергенции. Индикатор использует данные тиковых объемов для оценки давления покупок и продаж, предлагая детализированное пре

The Kecia Market News Detector is a cutting-edge MT5 indicator designed to detect and quantify the impact of news events and market anomalies across multiple currency pairs in real-time. By leveraging 20+ advanced statistical metrics, this tool identifies abnormal market behavior, liquidity shifts, and volatility regimes often triggered by economic news, geopolitical events, or institutional order flow. Key Features: Multi-Symbol Dashboard : Monitor up to 30 currency pairs simultaneously in a
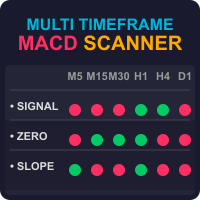
Discover the Power of the Multi Timeframe MACD Scanner for MT5 The MTF MACD Scanner indicator is a practical tool for traders using MetaTrader 5 (MT5). It takes the well-known MACD (Moving Average Convergence Divergence) indicator and turns its data into easy-to-read dashboard and candle colors on your chart. This helps you spot market trends, momentum shifts, and potential reversals without needing to analyze separate MACD lines and switch between timeframes. What Does It Do? This indicator cr
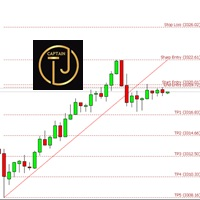
CTJMFiboSignal is The Power of Technical Analysis at Your Fingertips Embark on a seamless trading journey with CTJMFiboSignal , your go-to premium indicator for technical analysis mastery. Integrating advanced Fibonacci Retracement techniques with ZigZag patterns , this cutting-edge tool is designed to boost your confidence, adaptability, and accuracy in the ever-evolving world of market trading. Why CTJMFiboSignal Stands Out Supreme Accuracy:
Gain the upper hand in market analysis

Advanced Analysis – Total Visual Clarity
The Ichimoku Dashboard features three powerful dashboards to deliver precise trading signals based on a proven methodology. The color-coded panel design allows users to instantly identify the status of each monitored financial instrument at a glance. The combined table of the "Ichimoku Dashboard" for MetaTrader 5 is a key component that integrates and synthesizes trading signals generated by the indicators, providing a clear and immediate overview to su

Detect Trend and Consolidation : Push Notif for Mobile Trading Overview Push Notif for Mobile Trading: Detect Trend and Consolidation is a custom MetaTrader 5 (MT5) indicator developed by Ritz_EANEHA that intelligently detects whether the market is in a trend (bullish/bearish) or in consolidation (sideways) . It uses a proprietary comparison of Standard Deviation (StdDev) and Average True Range (ATR) to assess volatility and market structure, and sends mobile push notifications to alert trade
FREE

FVG Super Trend FVG Super Trend is an advanced Smart Money Concepts (SMC) indicator designed to identify high-probability Fair Value Gaps (FVGs) with trend confirmation and momentum filtering. The indicator combines: Fair Value Gap (FVG) detection MACD momentum confirmation EMA trend filtering ADX angle strength analysis Multi-Timeframe (HTF) candle confirmation Intelligent FVG classification system Real-time alerts and notifications Unlike ordinary FVG indicators, this tool filters weak market
FREE

Indicador ROC (Rate of Change) para MT5 Descrição O indicador ROC (Rate of Change) é uma ferramenta essencial para análise de momentum no mercado. Ele mede a variação percentual do preço em relação a um período anterior, fornecendo insights valiosos sobre a força e velocidade dos movimentos de preço. Esta versão personalizada para MetaTrader 5 oferece recursos avançados de visualização e alerta, com múltiplas opções de personalização para atender às suas necessidades específicas de trading. Cara
FREE

The Digital Buy/Sell Power Indicator is an advanced, visually intuitive tool that monitors buying and selling pressure across timeframes (M1 to Monthly), displaying momentum on a 0-100 scale with glowing digital readouts. Equipped with a movable panel, timeframe toggle switches, and a weighted algorithm for accurate Buy/Sell/Neutral signals, it provides traders with precise, actionable market dynamics. All time frames can be used at once to give a better perspective of market direction. Lowerin
FREE

Push Notif for Mobile Trading
(Now you can trade perfectly through notifications to your Mobile Gadget, with Signals that you can adjust to your trading style, Use VPS to activate real time trading)
Description Push Notif for Mobile Trading is a custom MetaTrader 5 (MT5) indicator designed to send mobile push notifications to traders when certain price or indicator-based conditions are met. This allows traders to monitor markets remotely and act quickly, even when not at their trading terminal.
FREE
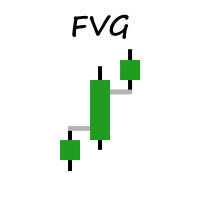
Welcome to MM Fair Value Gap Indicator.
Simple indicator that shows You FVG based on settings. The Fair Value Gap is a pattern made up of three candles: A Bullish Fair Value Gap forms on a second rising candle between the high of the first candle and the low of the third candle. A Bearish Fair Value Gap forms on a second declining candle between the low of the first candle and the high of the third candle
Indicator will be updated in future.
FREE

Have you ever asked yourself why your supply and demand zones fail , even when everything looks “perfect”? The truth is, you're not wrong — you're just watching the reaction, not the reason. It's not like those random currency strength meters that rely on lagging indicators like RSI, CCI, or similar tools mashed together to guess strength or weakness. That approach reacts to the past — not the cause. Pairs like EURUSD or USDJPY are just the outcomes . The real drivers? Currency indices an

DRAGON SCALE User Guide Indicator Visualization The DRAGON SCALE indicator displays several visual elements on the chart: Scale Zone – Displayed as purple areas (accumulation zones) and red areas (distribution zones) surrounding the pivot level. Lifebeat Signal – Appears as an arrow below the candle when the price enters a critical zone. The color of the arrow indicates the direction (green for bullish, red for bearish, yellow for neutral). Entry Countdown – Appears as an arrow above the cand

How to Use 1. Setting the Parameters Momentum Period : Adjust based on the characteristics of the trading pair. Use lower values (8–12) for volatile pairs, and higher values (14–20) for more stable pairs. Accumulation Period : Adjust based on the timeframe. Use lower values (3–5) for lower timeframes (M5–M30), and higher values (5–10) for higher timeframes (H1–D1). Energy Burst Threshold : Set according to your desired sensitivity. Lower values (50–60) provide more frequent signals; higher value

PULSAR ZONE MT5 Indicator Description PULSAR ZONE is a custom MT5 indicator designed for signal zoning based on volume pressure and trend direction. Ideal for scalping volatile pairs, it provides clear visual cues for both entry and exit points. Key Features Lifebeat Signal A visual signal triggered when a trend reversal occurs with significant volume pressure. Displayed as a green (bullish) or red (bearish) arrow, it highlights high-probability entry opportunities. Entry Countdown Once
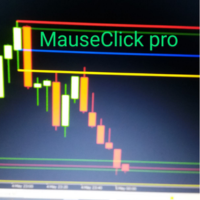
MauseClick Candle Pro – Marca velas importantes con un solo clic Precisión visual, líneas profesionales y persistencia total
¿Qué hace este indicador único?
Marca cualquier vela importante con un solo clic: Selecciona una vela y el indicador dibujará automáticamente sus zonas clave: Mecha de inicio Mecha de final Cuerpo de inicio Cuerpo de final
Marca múltiples velas a la vez: Analiza sin límites. Cada vela marcada se guarda individualmente.
Líneas profesionales y personaliza

Product Title: SuperTrend + Volume Confirmation Pro Product Description: Elevate your SuperTrend trading with the Volume Confirmation Pro indicator. This tool integrates sophisticated volume analysis directly into the SuperTrend framework, aiming to improve signal quality by assessing the strength and conviction behind trend movements. Go beyond simple price action and gain deeper insights into market dynamics. Overview: While the standard SuperTrend indicator offers clear trend direction, not

## Signal Types
### Buy Signal - Appears when a bullish reversal pattern is detected - Green arrow appears below the candle - Candles turn green during signal duration - "BUY Signal" label appears with timestamp
### Sell Signal - Appears when a bearish reversal pattern is detected - Red arrow appears above the candle - Candles turn red during signal duration - "SELL Signal" label appears with timestamp
## Best Practices
1. **Timeframe Selection** - Works on all timeframes - Recommen

Smart Watermark Displays current symbol + timeframe Shows account name (or custom text) Customizable font/color/position One-Click Tools Timeframe Switcher: Quick-access buttons (M1 to D1) Drawing Tools: Create horizontal lines, trendlines, and Fibonacci retracements with consistent sizing Object Cleanup: "Delete" button removes all indicator-created drawings Pips Meter Real-time P/L tracking in pips Color-coded (green/red) for profit/loss Supports magic number filtering Chart Zoom Contro
FREE

The Pranavtrxx ( Author ) Levels Indicator is a precision-based trading tool designed to identify key price levels in the market, helping traders make informed entry and exit decisions. This indicator automatically plots dynamic support and resistance zones derived from historical price action, psychological price levels, and recent market structure. Whether you're a day trader or swing trader, this tool offers real-time market level tracking that adjusts with price movement, helping you pinpoin

Overview:
TrendPro is a cutting‑edge indicator built on the crossover of three customizable Exponential Moving Averages (EMAs). Designed for all timeframes, it accurately identifies bullish and bearish momentum zones, and plots clear buy/sell arrows. With an integrated side‑market filter and optional pop‑up alerts, TrendPro helps you seize every opportunity without noise or false signals. Key Features: Precise Trend Detection Utilizes three EMAs (default periods: 34, 55, 89) to gauge market dir

KingTrend — Price Action Trend Analysis Tool KingTrend is a trend-following indicator based on long-standing price action principles involving Highs, Lows, Open, and Close. The logic behind this tool comes from concepts passed on to me by my mentor and translated into code for consistent structure recognition. Features: Identifies market structure using price action logic Detects trend direction and key turning points Marks Higher Highs, Lower Lows, and extensions Suitable for discretionary or

The SuperTrend Advance Trading is a widely-used technical indicator based on SuperTrend Strategy + Price Action + EMA . How it works: - Buy/Sell Signals can be generated when the trend reverses, the conditions of Price action, TrendLine and EMA are met. - After the Signal appears, be patient and wait until the candle closes, at that time place the order as soon as possible. You may have time to review your entry, consider whether it is a good entry or not. - Carefully review the entry, up

Индикатор сессий SMC — это точный инструмент, созданный для трейдеров Smart Money , которые полагаются на концепции ИКТ, охоту за ликвидностью и стратегии на основе сессий . Он плавно отображает критические торговые зоны на основе сессий, используя самые проверенные и популярные концепции, используемые трейдерами институционального уровня. Этот индикатор сессий «все в одном» накладывает на ваш график самые эффективные и высоковероятностные стратегии диапазона, включая: ICT Asian

Откройте для себя силу объёма с Volume Thermal Vision Готовы вывести свой трейдинг на новый уровень? Представляем Volume Thermal Vision – окончательный индикатор объёма для MetaTrader 5, который превращает анализ объёма в стратегическое преимущество. Разработан для трейдеров, стремящихся выявлять высоковероятностные сигналы, этот индикатор идеально подходит для методологий VSA (Volume Spread Analysis), ICT (Inner Circle Trader), SMC (Smart Money Concepts) и Уайкоффа, помогая расшифровывать повед

Откройте для себя силу продвинутого анализа объема с Weis Wave Scouter — революционным индикатором для MetaTrader 5, который сочетает проверенные временем принципы метода Вайкоффа и анализа объема VSA (Volume Spread Analysis). Разработанный для трейдеров, стремящихся к точности и глубине в своих операциях, этот индикатор предлагает тактическое чтение рынка через анализ кумулятивных волн объема, помогая выявлять ключевые точки разворота и продолжения тренда.
Weis Wave Scouter имеет четкий визуаль

ICT Order Flow Matrix Автоматическое определение институциональных зон блоков ордеров для MetaTrader 5
Обзор Поднимите качество своих графиков с помощью реальных инсайтов институционального потока ордеров. ICT Order Flow Matrix в режиме реального времени анализирует движение цены, чтобы определить, где банки, хедж-фонды и проп-трейдинговые компании размещают свои крупнейшие ордера. Затем индикатор отображает эти «Order Blocks» как динамические зоны поддержки и сопротивления — ручная прорис

Индикатор стратегии прорыва сессии в Лондоне предназначен для трейдеров, которые следуют ICT (Inner Circle Trader) и концепциям Smart Money (SMC) , фокусируясь на охоте за ликвидностью на основе сессии, зонах поражения и поведении маркет-мейкеров во время лондонской сессии. Этот инструмент фиксирует самые высокие и самые низкие уровни цен между 00:00 и 07:00 по Гринвичу , которые обычно определяются как London Killzone или диапазон маркет-мейкеров . Он помогает
Volume Thermal Vision Basic — это упрощённая версия знаменитого индикатора Volume Thermal Vision, разработанная для трейдеров, стремящихся анализировать интенсивность объёма с практичностью и эффективностью. С 6 уровнями ярких цветов выберите один из режимов StealthMode, NightVision или FrostVision для чёткого и стратегического отображения объёмных данных. Идеально подходит для новичков или в дополнение к вашему анализу, этот индикатор лёгкий, интуитивно понятный и идеально подходит для оптимиза
FREE

The Weis Wave Scouter Basic is the essential version of our renowned indicator for MetaTrader 5, designed for traders who wish to explore the concepts of the Wyckoff method and VSA (Volume Spread Analysis) in an accessible and efficient way. Based on volume wave reading, this simplified indicator allows you to clearly identify market movements, focusing on the principles of effort vs result and supply and demand, as taught by Richard Wyckoff. With Weis Wave Scouter Basic, you can visualize bull
FREE

Индикатор диапазона Нью-Йорка — это инструмент анализа на основе сессии, разработанный для трейдеров, применяющих концепции ICT (Inner Circle Trader) , торговлю Smart Money и институциональные методы ценового действия . Разработанный специально для сессии Нью-Йорка, этот индикатор фиксирует ценовой диапазон между 12:00 и 14:00 по Гринвичу , критический период, который совпадает с закрытием Лондона и открытием Нью-Йорка . Он определяет максимумы и минимумы сессии ,

Индикатор ICT London Open Killzone — это торговый инструмент на основе Smart Money , разработанный для трейдеров форекс, которые следуют институциональным концепциям, таким как ICT, SMC (Smart Money Concepts) и стратегиям рыночной структуры на основе ликвидности . Этот индикатор выделяет London Open Killzone, в частности, с 06:00 до 08:00 GMT , сессию, известную своей волатильностью и смещением цен из-за перекрывающихся потоков ликвидности между азиатской сессией и откры
The CTJM Candle Timer Indicator is a robust tool developed for traders who use MetaTrader 5. Designed with precision, it displays the remaining time for the current candle on a trading chart, enabling traders to monitor the market more effectively and make timely decisions. With a customizable visual interface, users can adjust colors, font sizes, and positioning to suit their preferences. Some key features of this indicator include: Real-Time Candle Countdown: Keeps traders informed of the exa
FREE
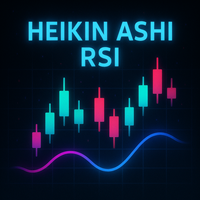
Let us introduce the Heikin Ashi RSI Oscillator! This indicator combines the concepts of Heikin Ashi candles with the RSI (Relative Strength Index) to produce an oscillator-like format that can be used to filter out some of the noise associated with standard RSI readings. This provides traders with a smoother representation of market conditions. Here are some articles to read more about the RSI and Heikin Ashi candles: https://www.investopedia.com/terms/r/rsi.asp https://www.investopedia.com/ter

The Candle Smoother is an indicator for MetaTrader 5 that helps you see price movements more calmly and clearly. It removes unnecessary "market noise" and displays the true trend more effectively.
What does the "Candle Smoother Indicator" do?
It smooths the classic candlestick data (Open, High, Low, Close). This filters out chaotic, hectic candles. Additionally, an EMA line (Exponential Moving Average) is calculated based on the smoothed prices. This helps you better recognize where the market
FREE
Are you tired of those old, boring TP and SL lines cluttering your charts? Free now, celebrating release of Live Chart Viewer utility https://www.mql5.com/en/market/product/158488
Struggling to showcase your trades in a way that actually grabs attention ?
Worry no more! Introducing the ultimate solution you’ve been waiting for... The TPSL Bounding Box PRO Indicator! PRO Version (With Risk to Rewards Ratio and more Modern Look Stats)
With just a simple setup, you can transform you
FREE
HedgingMonitor: Visual Control for Hedging Operations HedgingMonitor: Professional Order Visualization for MT5 HedgingMonitor is a professional indicator for MetaTrader 5 that displays detailed information about all your open and pending orders in an organized and customizable visual panel. Ideal for traders who use hedging strategies or manage multiple orders simultaneously. Key Features: Intuitive Visual Interface: View all your orders in a single panel, with color coding to quickly identify b

Ukeita Spike detector for All Gain and Pain Indices
Ukeita Spike Detector is a trend-sensitive indicator specially designed for Gain and Pain Indices
Gain and Pain synthetic indices are available 24/7 on Weltrade , similar to synthetic indices (Boom and Crash) offered by Deriv Broker .
This powerful tool helps detect incoming spike for Gain and Pain indices with high accuracy, making it a great addition to any strategy aimed at trading spikes safely.
Features
1) Detects incoming spikes f

This MT5 indicator provides real-time updates of classic Renko charts. Renko charts focus on price movement, filtering out noise and highlighting trends. What are Renko candles? Renko charts display price movement using "bricks" of equal size, ignoring time. A new brick is drawn only when the price moves by a specified amount. They help visualize trends by removing time-based noise.
Parameters - BrickSizePoints (20): Renko brick size in points - HistoryDepthSec (3600): Historical data to ini
FREE

Realized Volatility Indicator Description The Realized Volatility Indicator measures the actual volatility observed in the market over a specified period.
Unlike implied volatility (which is based on options pricing), realized volatility is based directly on historical price movements, offering a pure and objective view of market turbulence. This indicator can be used to: Assess market conditions, Optimize risk management, Fine-tune trading strategies based on volatility behavior. Key Features
FREE

Candle Confirm Color
What Is It?
The Candle Pattern Confirmations is an advanced indicator for MetaTrader 5 (MT5) designed to identify and confirm candlestick patterns with high probability of trend reversal or continuation. It visually highlights candles that form Engulfing (Bullish/Bearish) and Inside Bars patterns, assisting traders in making more assertive decisions with real-time confirmation.
Main Features
Automatic Pattern Detection
- Detects Bullish Engulfing and Bearish Engulfin
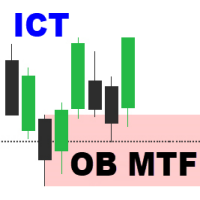
Order Block Multi Timeframe The Order Block Multi Timeframe is a powerful tool for Smart Money Concept (SMC) traders, combining high-accuracy Order Block detection with real-time Break of Structure (BOS) and Change of Character (CHoCH) analysis across multiple timeframes. Smart Money Insight, Multi-Timeframe Precision This indicator automatically identifies institutional Order Blocks —key price zones where large players have entered the market—and plots them directly on your chart. It also track
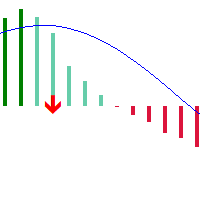
Based on the classic MACD indicator, this version introduces color concepts and adds golden/death cross arrow markers to represent MACD trend changes, helping investors make better decisions.
1. The MACD histogram bars display different colors when positioned above or below the zero line 2. When the MACD histogram is above the zero line and the current MACD value is greater than the previous value, it displays in dark color, indicating a continuing upward trend 3. When the MACD histogram is ab

Eabotpro Signals v3.0
A professional MetaTrader 5 indicator designed to deliver high-precision trading signals with real-time notifications, trade management tools, and a clean interface. "Recommended Base time frame is 4H Fibo From input . and trade time frame 1 mint , and 5 mint " Key Features: High-Accuracy Signals : Optimized for precision and consistency across different market conditions. Smart Trade Panel : Displays entry price, targets, stop levels, performance stats, and profit trackin

This is a Free Display Dashboard for The ArbitrageATR Recovery MT5 EA. This indicator is used to track existing Total hedge positions (Account Summary) , Balance, Equity, P/L and Symbols, Correlation Status. Please adjust size and colours according to your desired preference. Feel free to message me if there are any queries required. Please note that this an indicator and not an Expert Advisor.
LINK TO THE EA: https://www.mql5.com/en/market/product/131269?source=Site+Market+Product+Page#descr
FREE
Indicador IMI (Intraday Momentum Index) Descrição O Indicador IMI (Intraday Momentum Index) é uma poderosa ferramenta de análise técnica desenvolvida para identificar a força do momentum e potenciais reversões no mercado. Este indicador quantifica a relação entre ganhos e perdas durante um período específico, ajudando traders a avaliar a dinâmica atual do mercado. Características Oscila entre 0 e 100, facilitando a interpretação das condições de mercado Identifica com precisão áreas de sobrecomp
FREE
RTS5PatternBTCPrice is an analytical tool for MetaTrader 5 that systematically searches for historical similarities in price action and evaluates how the market behaved after similar situations.
The indicator provides both visual and statistical information that can be used to support trading decisions. It compares the current price pattern, defined by a selected number of candles, with historical data.
The similarity results are displayed using a histogram with three categories: Good Match –
FREE

Simple. Informative. Instantly Visible on Your Chart. Alwinson Active Trades Info is a lightweight indicator that displays a summary of currently open positions directly on the chart. It removes the need to switch to the Terminal window to check which symbols are active and what volume is involved. An MT4 version of this indicator is also available among my products.
Key Features: Lists all symbols that currently have open positions in the trading account. Shows the dominant position type (BUY
FREE
Percentage Range Consolidation O Percentage Range Consolidation é um indicador poderoso projetado para identificar zonas de consolidação de preço com base em variações percentuais ao longo do tempo. Ideal para traders que buscam detectar áreas de compressão de volatilidade e possíveis pontos de ruptura (breakout). Principais características: Identifica até 3 zonas de consolidação simultâneas, cada uma configurável de forma independente. Cálculo baseado na variação percentual entre a máxima e mín

Range Filter Buy and Sell O Range Filter Buy and Sell é um indicador técnico avançado que combina filtragem de movimentos de preço com geração de sinais claros de compra e venda.
Ele utiliza um sistema inteligente de suavização baseado em médias móveis exponenciais do range de preços, adaptado por um multiplicador configurável. Principais recursos:
Filtragem de tendências (Alta, Baixa ou Neutra) com cores distintas no gráfico:
• Tendência de alta (linha verde)
• Tendência de baixa (linha verm
TrendWave Bands Indicator This is a trend-tracking tool, originally by BigBeluga on TradingView, designed to adjust automatically to current market movements using upper and lower dynamic bands. It uses primary waves to view the strength and persistence of a trend, and includes secondary wave bands to assist with deeper analysis. Main Features: Smart Adaptive Bands In uptrends, a dynamic lower band is displayed, while in downtrends, an upper band appears. These serve as moving zones of support o
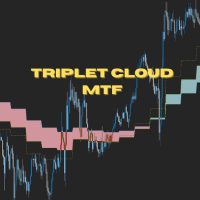
Triplet Cloud MTF is an indicator for trend-following strategy. It presents the trend in HTF from the LTF Chart that allows traders focus on looking for trade entry in the right direction and increase striking rate. It comes with simple input setup. You will only need to choose HTF you want to follow its trend and set the alert setup, then all is set. Here are the mostly selected HTF setup for each of entry timeframe: M1 Entry : M15 Trend M5 Entry : H1 Trend M15 Entry : H4 Trend H1 Entry

Daily Weekly Monthly High Low - Your Ultimate Tool for Precision Market Analysis
The 200 free download promotion has ended. The price has now been updated. Thank you, everyone!
Love it? Hate it? Let me know in a review! Feature requests and ideas for new tools are highly appreciated. :)
Try "The AUDCAD Trader":
https://www.mql5.com/en/market/product/151841 Overview:
Elevate your trading strategy with Daily Weekly Monthly High Low , a sophisticated MQL5 indicator designed to pinpoint c

Fibonacci Trend Indicator for MT5 Unlock the power of Fibonacci analysis on your MetaTrader 5 charts!
Our Fibonacci Trend Indicator automatically plots dynamic support and resistance levels so you can spot trends, reversals, and breakout opportunities at a glance. Features & Advantages Automatic Fibonacci Levels
Instantly displays seven key Fibonacci retracement levels based on the highest and lowest prices from your chosen lookback period — no manual work required. Dynamic Trend Adaptatio
FREE

️ **Drawdown Tracker Pro** – Smart Risk Control for Prop Traders Many traers fail their prop firm challenge not because they’re bad but because they don’t track their equity drawdown clearly enough, in real-time. This tool fixes that. **Drawdown Tracker Pro** is an advanced MT5 indicator built for traders who need to stay within daily drawdown limits - especially during challenges with FTMO, MFF, or other funding programs. It helps you trade with discipline and avoid costly violations.

The Ultimate RSI indicator is a new oscillator based on the calculation of the Relative Strength Index that aims to put more emphasis on the trend, thus having a less noisy output. Opposite to the regular RSI, this oscillator is designed for a trend trading approach instead of a contrarian one. While returning the same information as a regular RSI, the Ultimate RSI puts more emphasis on trends, and as such can reach overbought/oversold levels faster as well as staying longer within these areas.

Trend Rider combines indicators such as Super Trend, RSI, and MACD. Its purpose is to assist in spotting and riding trends by displaying direction through color-coded candles and trailing stop levels. It can be employed independently or alongside other filters for enhanced decision-making.
The integration of these indicators aims to provide a clearer picture of market trends and facilitate better trading strategies. Super Trend helps identify the prevailing trend, RSI measures the market condi

Descubra o Pulse Flow, um indicador exclusivo desenvolvido para traders que buscam clareza visual e agilidade na leitura do mercado. Com uma abordagem inteligente e dinâmica, ele destaca zonas de transição de força e equilíbrio entre compradores e vendedores, revelando oportunidades com precisão.
Ideal para quem opera fluxo, price action ou deseja uma leitura limpa, objetiva e poderosa, o Pulse Flow se adapta a qualquer ativo ou tempo gráfico. Simples de usar, difícil de ignorar

Descubra o Wave Flow, um indicador exclusivo desenvolvido para traders que buscam clareza visual e agilidade na leitura do mercado. Com uma abordagem inteligente e dinâmica, ele destaca zonas de transição de força entre compradores e vendedores, revelando oportunidades com precisão.
Ideal para quem opera fluxo, price action ou deseja uma leitura limpa, objetiva e poderosa, o Wave Flow se adapta a qualquer ativo ou tempo gráfico. Simples de usar, difícil de ignorar
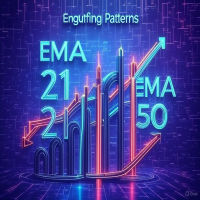
Engulfing with EMAs Indicator
Unlock the power of advanced candlestick pattern detection with the Engulfing with EMAs Indicator , a cutting-edge tool designed for MetaTrader 5. This futuristic indicator combines the precision of engulfing pattern analysis with the trend-following strength of Exponential Moving Averages (EMA 21 and EMA 50), empowering traders to identify high-probability setups across all currency pairs and timeframes. Key Features: Comprehensive Engulfing Detection : Detects b
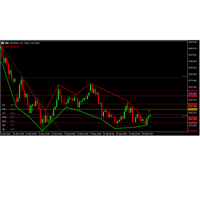
Advantages of the AutoTrendlinesMTF_WithRSI Indicator Multi-Timeframe Trendlines Automatically draws support/resistance trendlines on multiple timeframes (current, H1, H4). Adjustable lookback period ( LookbackBars ) and swing strength ( SwingStrength ) for customization. Daily Pivot Points Calculates and displays daily pivot levels (P, R1/S1, R2/S2, R3/S3) with customizable colors. Toggle visibility for each level individually. Auto Fibonacci Retracement Plots Fibonacci levels based on recent h
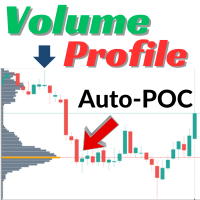
Crystal Volume Profile Auto POC — Визуализация объема для точных торговых решений Обзор
Crystal Volume Profile Auto POC — это индикатор для MetaTrader 5, который отображает распределение объема и автоматически определяет Point of Control (POC). Он помогает трейдерам находить области наибольшей активности участников рынка и выявлять скрытые уровни поддержки и сопротивления. Основные возможности Динамический профиль объема (видимая часть графика или выбранный диапазон) Автоматическое определение
FREE
MetaTrader Маркет - уникальная площадка по продаже роботов и технических индикаторов, не имеющая аналогов.
Памятка пользователя MQL5.community расскажет вам и о других возможностях, доступных трейдерам только у нас: копирование торговых сигналов, заказ программ для фрилансеров, автоматические расчеты через платежную систему, аренда вычислительных мощностей в MQL5 Cloud Network.

Вы упускаете торговые возможности:
- Бесплатные приложения для трейдинга
- 8 000+ сигналов для копирования
- Экономические новости для анализа финансовых рынков
Регистрация
Вход
Вы принимаете политику сайта и условия использования
Если у вас нет учетной записи, зарегистрируйтесь