 MetaTrader 5
 专家
 指标
 程序库
 实用工具
 窗口小部件
 规则
适用于MetaTrader 5的新技术指标 - 135
 技术指标的信号外汇和股票市场的开仓交易和平仓交易起着至关重要的作用。指标的本质就是一种交易品种的数学转换,旨在预测未来的价格变化。
测试技术指标可以更有利于预测市场行为并从中获利。
Let us introduce the Heikin Ashi RSI Oscillator! This indicator combines the concepts of Heikin Ashi candles with the RSI (Relative Strength Index) to produce an oscillator-like format that can be used to filter out some of the noise associated with standard RSI readings. This provides traders with a smoother representation of market conditions. Here are some articles to read more about the RSI and Heikin Ashi candles: https://www.investopedia.com/terms/r/rsi.asp https://www.investopedia.com/ter

The Candle Smoother is an indicator for MetaTrader 5 that helps you see price movements more calmly and clearly. It removes unnecessary "market noise" and displays the true trend more effectively.
What does the "Candle Smoother Indicator" do?
It smooths the classic candlestick data (Open, High, Low, Close). This filters out chaotic, hectic candles. Additionally, an EMA line (Exponential Moving Average) is calculated based on the smoothed prices. This helps you better recognize where the market
FREE
HedgingMonitor: Visual Control for Hedging Operations HedgingMonitor: Professional Order Visualization for MT5 HedgingMonitor is a professional indicator for MetaTrader 5 that displays detailed information about all your open and pending orders in an organized and customizable visual panel. Ideal for traders who use hedging strategies or manage multiple orders simultaneously. Key Features: Intuitive Visual Interface: View all your orders in a single panel, with color coding to quickly identify b

Ukeita Spike detector for All Gain and Pain Indices
Ukeita Spike Detector is a trend-sensitive indicator specially designed for Gain and Pain Indices
Gain and Pain synthetic indices are available 24/7 on Weltrade , similar to synthetic indices (Boom and Crash) offered by Deriv Broker .
This powerful tool helps detect incoming spike for Gain and Pain indices with high accuracy, making it a great addition to any strategy aimed at trading spikes safely.
Features
1) Detects incoming spikes f

This MT5 indicator provides real-time updates of classic Renko charts. Renko charts focus on price movement, filtering out noise and highlighting trends. What are Renko candles? Renko charts display price movement using "bricks" of equal size, ignoring time. A new brick is drawn only when the price moves by a specified amount. They help visualize trends by removing time-based noise.
Parameters - BrickSizePoints (20): Renko brick size in points - HistoryDepthSec (3600): Historical data to ini
FREE

Realized Volatility Indicator Description The Realized Volatility Indicator measures the actual volatility observed in the market over a specified period.
Unlike implied volatility (which is based on options pricing), realized volatility is based directly on historical price movements, offering a pure and objective view of market turbulence. This indicator can be used to: Assess market conditions, Optimize risk management, Fine-tune trading strategies based on volatility behavior. Key Features
FREE

Candle Confirm Color
What Is It?
The Candle Pattern Confirmations is an advanced indicator for MetaTrader 5 (MT5) designed to identify and confirm candlestick patterns with high probability of trend reversal or continuation. It visually highlights candles that form Engulfing (Bullish/Bearish) and Inside Bars patterns, assisting traders in making more assertive decisions with real-time confirmation.
Main Features
Automatic Pattern Detection
- Detects Bullish Engulfing and Bearish Engulfin
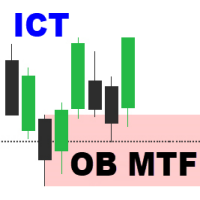
Order Block Multi Timeframe The Order Block Multi Timeframe is a powerful tool for Smart Money Concept (SMC) traders, combining high-accuracy Order Block detection with real-time Break of Structure (BOS) and Change of Character (CHoCH) analysis across multiple timeframes. Smart Money Insight, Multi-Timeframe Precision This indicator automatically identifies institutional Order Blocks —key price zones where large players have entered the market—and plots them directly on your chart. It also track
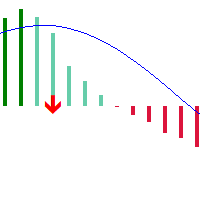
基于经典的MACD指标,引入了颜色的概念,并且加入了金叉死叉的箭头标识,来表示MACD的变化趋势,从而更好地帮助投资者做出决策。 1. 当MACD指标的柱体位于零轴上方或者下方时,默认显示为不同的颜色 2. 当MACD指标的柱体位于零轴上方时,如果MACD值比前一值大,则显示为深色,说明上涨趋势延续 3. 当MACD指标的柱体位于零轴上方时,如果MACD值比前一值小,则显示为浅色,说明上涨趋势减弱 4. 当MACD指标的柱体位于零轴下方时,如果MACD值比前一值大,则显示为浅色,说明下跌趋势减弱 5. 当MACD指标的柱体位于零轴下方时,如果MACD值比前一值小,则显示为深色,说明下跌趋势延续 6. 增加了金叉和死叉的箭头标识 7. 如果当前MACD值大于信号线的值,并且前一K线的MACD值小于或等于信号线的值,则显示为向上的箭头 8. 如果当前MACD值小于信号线的值,并且前一K线的MACD值大于或等于信号线的值,则显示为向下的箭头
一个亏惨了的投资者的首次指标市场尝试,如果有任何建议,欢迎交流。 希望大家多多支持。

Eabotpro Signals v3.0
A professional MetaTrader 5 indicator designed to deliver high-precision trading signals with real-time notifications, trade management tools, and a clean interface. "Recommended Base time frame is 4H Fibo From input . and trade time frame 1 mint , and 5 mint " Key Features: High-Accuracy Signals : Optimized for precision and consistency across different market conditions. Smart Trade Panel : Displays entry price, targets, stop levels, performance stats, and profit trackin

This is a Free Display Dashboard for The ArbitrageATR Recovery MT5 EA. This indicator is used to track existing Total hedge positions (Account Summary) , Balance, Equity, P/L and Symbols, Correlation Status. Please adjust size and colours according to your desired preference. Feel free to message me if there are any queries required. Please note that this an indicator and not an Expert Advisor.
LINK TO THE EA: https://www.mql5.com/en/market/product/131269?source=Site+Market+Product+Page#descr
FREE
RTS5PatternBTCPrice is an analytical tool for MetaTrader 5 that systematically searches for historical similarities in price action and evaluates how the market behaved after similar situations.
The indicator provides both visual and statistical information that can be used to support trading decisions. It compares the current price pattern, defined by a selected number of candles, with historical data.
The similarity results are displayed using a histogram with three categories: Good Match –
FREE

Simple. Informative. Instantly Visible on Your Chart. Alwinson Active Trades Info is a lightweight indicator that displays a summary of currently open positions directly on the chart. It removes the need to switch to the Terminal window to check which symbols are active and what volume is involved. An MT4 version of this indicator is also available among my products.
Key Features: Lists all symbols that currently have open positions in the trading account. Shows the dominant position type (BUY
FREE

Percentage Range Consolidation O Percentage Range Consolidation é um indicador poderoso projetado para identificar zonas de consolidação de preço com base em variações percentuais ao longo do tempo. Ideal para traders que buscam detectar áreas de compressão de volatilidade e possíveis pontos de ruptura (breakout). Principais características: Identifica até 3 zonas de consolidação simultâneas, cada uma configurável de forma independente. Cálculo baseado na variação percentual entre a máxima e mín

Range Filter Buy and Sell O Range Filter Buy and Sell é um indicador técnico avançado que combina filtragem de movimentos de preço com geração de sinais claros de compra e venda.
Ele utiliza um sistema inteligente de suavização baseado em médias móveis exponenciais do range de preços, adaptado por um multiplicador configurável. Principais recursos:
Filtragem de tendências (Alta, Baixa ou Neutra) com cores distintas no gráfico:
• Tendência de alta (linha verde)
• Tendência de baixa (linha verm

TrendWave Bands Indicator This is a trend-tracking tool, originally by BigBeluga on TradingView, designed to adjust automatically to current market movements using upper and lower dynamic bands. It uses primary waves to view the strength and persistence of a trend, and includes secondary wave bands to assist with deeper analysis. Main Features: Smart Adaptive Bands In uptrends, a dynamic lower band is displayed, while in downtrends, an upper band appears. These serve as moving zones of support o
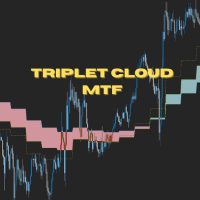
Triplet Cloud MTF is an indicator for trend-following strategy. It presents the trend in HTF from the LTF Chart that allows traders focus on looking for trade entry in the right direction and increase striking rate. It comes with simple input setup. You will only need to choose HTF you want to follow its trend and set the alert setup, then all is set. Here are the mostly selected HTF setup for each of entry timeframe: M1 Entry : M15 Trend M5 Entry : H1 Trend M15 Entry : H4 Trend H1 Entry

Fibonacci Trend Indicator for MT5 Unlock the power of Fibonacci analysis on your MetaTrader 5 charts!
Our Fibonacci Trend Indicator automatically plots dynamic support and resistance levels so you can spot trends, reversals, and breakout opportunities at a glance. Features & Advantages Automatic Fibonacci Levels
Instantly displays seven key Fibonacci retracement levels based on the highest and lowest prices from your chosen lookback period — no manual work required. Dynamic Trend Adaptatio
FREE

️ **Drawdown Tracker Pro** – Smart Risk Control for Prop Traders Many traers fail their prop firm challenge not because they’re bad but because they don’t track their equity drawdown clearly enough, in real-time. This tool fixes that. **Drawdown Tracker Pro** is an advanced MT5 indicator built for traders who need to stay within daily drawdown limits - especially during challenges with FTMO, MFF, or other funding programs. It helps you trade with discipline and avoid costly violations.

The Ultimate RSI indicator is a new oscillator based on the calculation of the Relative Strength Index that aims to put more emphasis on the trend, thus having a less noisy output. Opposite to the regular RSI, this oscillator is designed for a trend trading approach instead of a contrarian one. While returning the same information as a regular RSI, the Ultimate RSI puts more emphasis on trends, and as such can reach overbought/oversold levels faster as well as staying longer within these areas.

Trend Rider combines indicators such as Super Trend, RSI, and MACD. Its purpose is to assist in spotting and riding trends by displaying direction through color-coded candles and trailing stop levels. It can be employed independently or alongside other filters for enhanced decision-making.
The integration of these indicators aims to provide a clearer picture of market trends and facilitate better trading strategies. Super Trend helps identify the prevailing trend, RSI measures the market condi

Descubra o Pulse Flow, um indicador exclusivo desenvolvido para traders que buscam clareza visual e agilidade na leitura do mercado. Com uma abordagem inteligente e dinâmica, ele destaca zonas de transição de força e equilíbrio entre compradores e vendedores, revelando oportunidades com precisão.
Ideal para quem opera fluxo, price action ou deseja uma leitura limpa, objetiva e poderosa, o Pulse Flow se adapta a qualquer ativo ou tempo gráfico. Simples de usar, difícil de ignorar

Descubra o Wave Flow, um indicador exclusivo desenvolvido para traders que buscam clareza visual e agilidade na leitura do mercado. Com uma abordagem inteligente e dinâmica, ele destaca zonas de transição de força entre compradores e vendedores, revelando oportunidades com precisão.
Ideal para quem opera fluxo, price action ou deseja uma leitura limpa, objetiva e poderosa, o Wave Flow se adapta a qualquer ativo ou tempo gráfico. Simples de usar, difícil de ignorar

UZFX-Alpha Strike Signals v2.0是一款专业级市场分析工具,旨在精准清晰地识别高概率交易机会。该先进指标融合了精密的价格行为识别与动态风险管理可视化功能,直接在图表上呈现清晰的买入与卖出信号。 注意:结合使用 { LTL 164343 } 指标,可提高获胜信号的准确率。 利用 LTL 信号判断趋势,并以 Alpha 信号作为入场信号。 这种方法将最大限度地提高您的胜率,并有助于避免误判信号。 工作原理 该指标通过识别特定K线形态来分析市场结构,这些形态预示着潜在趋势反转或延续。当这些形态符合专有算法条件时,指标将生成清晰视觉信号:
• 买入信号(蓝色箭头)出现在市场底部,表明看涨动能显现 • 卖出信号(红色箭头)出现在市场顶部,确认看跌压力形成
交易者核心优势 1. 清晰可执行的信号 无需解读猜测——信号位置直接在图表上显示箭头
色彩编码信号(买入蓝标/卖出红标)实现即时识别
可配置信号灵敏度以匹配您的交易风格
2. 完整交易管理可视化 信号出现时,指标自动绘制:
入场点位——最佳建仓价格
止损位——基于近期价格走势的保护性位
多级止盈位(1
FREE

轻松识别真实市场强度 — 即使你是新手。
动量影子指标(MSI)非常适合初学者和专业交易者。
它向你显示市场是否真的有力量 — 让你更有信心知道何时买入和卖出。 没有困惑。没有猜测。
只有简单的线条,告诉你什么是真实的,什么不是。 超级易用 — 适合所有水平
明确的买入和卖出信号
最适用于20分钟及以上时间框架,但也适合快节奏交易 最适用于合成波动指数——没有新闻会影响这些市场,因此你获得的是纯粹的动量信号。
工作原理:
MSI 在你的图表上显示三条线: 短期趋势线(黄色) 长期趋势线(蓝色) 动量影子线(白色),跟踪过去的价格运动 看涨信号:
当价格突破黄色和蓝色线,且动量影子也在其上方时:
表明强劲的上行动力。建议买入。 看跌信号:
当价格跌破黄色和蓝色线,且动量影子也在其下方时:
表明强劲的下行动力。建议卖出。 如果影子与价格不一致(例如价格突破,但影子仍在下方),说明动量较弱,行情可能是假突破。 最佳时间框架:
在20分钟及以上时间框架下效果最佳
也可用于短线交易(剥头皮) 为何与众不同: 通过跟踪动量确认价格走势,减少虚假信号 适用于任何市
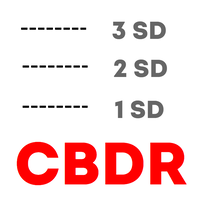
Haven CBDR 是一个易于使用的指标,可在图表上显示 ICT “中央银行交易商区间”(CBDR)。该程序绘制矩形,标示 CBDR 价格区间,并显示额外的标准差线,以评估可能的支撑和阻力水平。产品允许自定义 CBDR 的时间区间、显示的日历天数、图形元素的颜色和样式,并根据图表主题自动调整配色方案。此外,指标还会绘制垂直线,标示每日蜡烛图的开盘,有助于掌握市场动态。 其他产品 -> 点击这里 交易者如何使用: 参数设置:
如有需要,可调整会话的开始和结束时间,并自定义显示参数(颜色、矩形边框样式、标准差线和标记)。 区间分析:
使用显示的矩形快速评估所选期间内的 CBDR 价格区间。标准差线有助于确定潜在的反转或延续水平。 寻找交易信号:
每日蜡烛开盘的垂直线和区间信息,为交易者提供更多参考,帮助确定进出场位置,从而更好地与机构资金动向同步。 这款工具适合希望在交易会话内清晰掌握价格区间,并基于客观图表分析优化策略的交易者。
FREE

KT Fair Value Gap(FVG)用于识别并高亮显示市场中暂时性的价格不平衡区域。这些缺口通常作为价格延续的潜在区域,有时也可能成为价格反转的起点(也称为反向FVG)。 多头FVG: 以绿色方框显示,这些缺口通常是支撑区,价格可能从此恢复上涨。一旦被回补,也可能成为潜在的反转点。 空头FVG: 以红色方框显示,这些缺口是阻力区,价格可能从此继续下跌。与多头缺口类似,回补后也可能发生趋势反转。
功能特色 简洁清晰的设计: 该指标专为清楚显示FVG区域而设计,帮助交易者专注于关键信息,避免图表混乱。 可视化仪表盘: 屏幕上的小面板可快速显示已回补与未回补FVG的百分比,帮助您快速洞察市场结构。 高度可定制: 可自由调整FVG的阈值水平、已/未回补缺口的可见性,还可以根据个人风格自定义颜色与线条粗细。 即时提醒: 每当检测到新的FVG时,您将立刻收到通知,确保不错过任何潜在交易机会。
什么是已回补的FVG
当一根K线收盘价低于FVG区域下边界时,多头FVG被视为已回补。 当K线收盘价高于FVG区域上边界时,空头FVG被视为已回补。
什么是未回补的FVG
只要没有K线收盘在其下

PHSB_顶底 更清晰地观察市场极值与当前市场结构 PHSB_顶底 是一款专为 MetaTrader 5 开发的指标,旨在帮助交易者更加直观地观察 价格在市场区间内的结构 ,突出显示主要极值以及中间参考区域。 除了直观识别 顶部 和 底部 之外,该指标还将其他重要信息整合到同一个界面中,使交易者能够同时观察所分析的价格区间、市场当前所处的位置以及近期K线的表现。 设计理念非常简单: 减少图表上分散的信息,让市场分析拥有更多上下文。 顶部与底部识别 该指标的核心功能是识别所分析区间中的极值位置。 PHSB_顶底 直接在图表上显示: 顶部 ; 底部 ; 区间中线 ; 中间参考区域。 这些水平线会显示在图表上,帮助交易者更加清晰地观察当前价格结构。 用于分析的K线数量可以由用户自行设置。 在一个视图中观察整个市场区间 与只关注当前价格不同,该指标可以让交易者从由市场极值形成的结构中观察当前市场。 这可以帮助交易者直观了解: 当前价格处于区间中的什么位置; 与顶部之间的距离; 与底部之间的距离; 当前结构的中心区域; 可以作为分析参考的中间区域。 指标不会告诉交易者应该采取什么行动
FREE

零滞后EMA指标(AI优化版)——专业交易工具
通过零滞后EMA指标提升交易精度——新一代解决方案,消除传统移动平均线的延迟。采用AI优化算法,提供闪电般的市场洞察,助您抢占先机。 核心功能: AI加速 :几乎无延迟,极速检测趋势转变与动量变化。 多市场适用 :适用于外汇、股票、加密货币及大宗商品。 清晰趋势 :平滑噪声,保留关键信号,决策更清晰。 早期信号识别 :比传统EMA更早发现多空动向。 动态视觉提示 :可选红绿颜色切换,快速识别市场方向。 自定义参数 :可调整周期与价格源,适配您的策略。 多时间框架兼容 :支持1分钟线至月线图。 策略灵活性 :可单独使用或搭配RSI、MACD、斐波那契等工具。 为何选择它? 实战检验算法 :真实环境中表现可靠。 新手到专家皆宜 :操作简单,效果强大。 适应市场变化 :全周期保持相关性。 适合人群: 寻求快速确认信号的交易者。 希望减少滞后性亏损的投资者。 任何希望升级技术分析工具的人。 开启智能交易新时代。保持领先,交易更聪明.
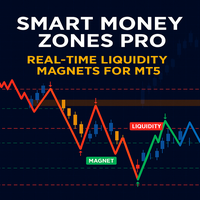
如果您想嘗試更了解 SM Zones Pro 指標的功能,我們建議您先下載並嘗試免費的 SM 區域指標,該指標適用於在不同時間範圍內與單一 EURUSD 工具配合使用。您可以從這個市場下載 SM Zones。 SMZones Pro 與 SM Zones 不同,它可以同時分析多達 10 種不同的儀器。
SM Zones Pro 指標是根據智慧資金管理策略的原則開發的,對於 MetaTrader 5 (MT5) 平台上的交易者來說是一個非常方便的工具。它以圖形方式在圖表上顯示 SM 策略中使用的所有重要區域:市場結構、流動性增加的價格水平、“價格磁鐵”區域 - 不平衡、訂單塊、fvg、斷路器塊和緩解塊 - 工具價格朝這些區域移動。影響牛市的區域以綠色突出顯示,而影響熊市的區域則以棕色突出顯示。這些水平反映了價格可能變化的區域,通常受到大型機構和銀行訂單的影響。當價格達到這些關鍵區域時,可能會經歷大幅快速的波動,這通常會讓交易者了解如何做出正確的交易決策。
使用淺色主題可以最方便地查看圖表。您可以建立一個方便的淺色主題模板並將其用於所有這些框架。
如何根據您的需求客製化 Smart

FREE

MACD Scalper Zero Lag is a fast, accurate, and reliable indicator designed to give traders the real-time edge they need. By eliminating the lag found in traditional MACD indicators, it delivers instantaneous divergence alerts on both forex and cryptocurrency markets. With its robust algorithm and user-friendly interface, this tool not only detects early trend reversals but also provides clear and actionable signals. The indicator offers customizable settings so that you can adjust sensitivity a
Elevate Your Trading with Advanced Anchored Volume Weighted Average Price Technology Unlock the true power of price action with our premium Anchored VWAP Indicator for MetaTrader 5 - the essential tool for precision entries, strategic exits, and high-probability trend continuation setups. Write me a DM for a 7 day free trial. Anchored VWAP Plus gives traders unprecedented control by allowing custom anchor points for Volume Weighted Average Price calculations on any chart. With support for 4 sim
FREE

To review our products, please click the link: LINK This Classic Pivot Point Indicator accurately calculates and displays 7 essential pivot levels , including the Pivot Point , 3 Support levels (S1–S3) , and 3 Resistance levels (R1–R3) based on the standard classic pivot formula . Designed for Forex, indices, commodities, and crypto trading , it supports multi-currency and multi-timeframe analysis in a clean, professional dashboard interface . With the built-in interactive dashboard , traders c
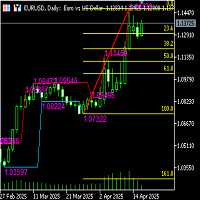
自动斐波那契线指标(含高低通道线)功能说明 功能简介 本指标结合自动识别的波段高低点,自动绘制斐波那契回撤/扩展线,并配合绘制当前分析区间的最高价与最低价通道线,为交易者提供更清晰的支撑/阻力参考与趋势分析依据。 主要功能 自动波段识别 程序根据预设算法Fractal 高低点)识别关键波段; 选取最近一个明显高点与低点作为绘制基础; 无需手动干预,自动更新。 斐波那契回撤/扩展线绘制 自动计算以下常用比例:0%、23.6%、38.2%、50%、61.8%、100%、161.8% 等; 对每一水平绘制水平参考线,标注数值; 高低通道线绘制 在选定的计算区间内自动绘制“最高价线”和“最低价线”价格标签; 显示当前区间内的价格通道宽度,便于判断价格是否处于突破/震荡阶段。 自动更新与多周期适配 指标随行情自动刷新; 可用于任何时间周期(如1分钟至周线); 保持图表整洁,适应短线与波段策略。 图表友好设置 支持自定义线条颜色、透明度、样式; 技术参数 区间长度: 指定显示价格标签K线数量 应用场景 趋势行情中预测回调/反弹区; 判断价格是否突破关键比例位; 配合价格通道识别震荡
FREE

The VIX Index, or CBOE Volatility Index, is an indicator designed for MetaTrader 5 that transforms historical volatility into an easy-to-interpret oscillator, placing the volatility range between 0 (minimum) and 100 (maximum) based on a configurable normalization period.
Unlike a simple ATR, this oscillator shows you on the chart when volatility is abnormally low or high compared to its recent behavior. Additionally, the indicator provides context and information about the famous VIX Volatility
FREE
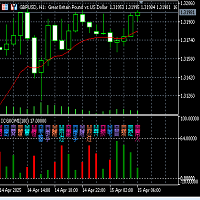
伏羲卦象双色震荡指示器功能及使用说明(V2.1) 伏羲卦象双色震荡指示器指标说明: (1)本卦象变化指标是根据中国古代文化中"易经"哲学的阴阳转化思想,融合金融交易K线图每一蜡烛图K线周期多空相互博弈的结果,用中国最古老的预测编码方法,以易经伏羲64卦象的形式,将卦象的每一爻的阴阳和蜡烛K线图的阴阳结合在一起,实时绘制在交易图表子窗口的每一根K线图的下方, 以表示未来的K线的走向趋势。 (2)指标在子窗口的左上侧只显示当前蜡烛K线所对应的卦数,非当前K线的卦象指标是在K线的每个蜡烛下方标注了对应的卦名。 (3)本指标同时又将主图中卦象的变化,再以卦数双色柱状图在子窗口绘制,更直观地标示每根蜡烛K线对应的卦象的形态变化,预示未来的可能走向. (3)本指标的重大创新意义: a:突破传统的三根或者两根K线的组合预测,而是用六根K线的组合装成卦象进行多空的预示。通过卦象的变化,交易者一定会有全新的交易灵感. B:与单纯的主图卦象指标不同,本指标的特点,直观且易于交易者实现报警提醒或者以此指标的信号进行EA交易系统的开发. (4)本指标适合所有时间框架.卦名卦象随K线的变化自动更新。 (5
FREE

This scanner is based on the Bill Williams Awesome Oscillator (AO) indicator and is designed for faster analysis of financial instruments. The chart shows five vertical columns, which includes a financial instrument that meets certain criteria. The first column shows financial instruments with a strong trend, namely when the AO indicator is above the zero line on three time frames. If there is a strong downward trend in the market, then such instruments will fall into the fifth column. The seco
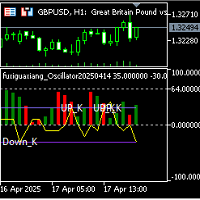
伏羲卦象震荡信号报警指示器 —— 融合《易经》哲学与金融量化的智能交易分析工具 一、产品概述 “ 伏羲卦象震荡信号报警指示器 ” 是一款基于中国传统《易经》哲学思想,融合现代金融技术分析方法的创新型交易辅助工具。该指标通过将六十四卦的阴阳爻象与 K 线形态相结合,构建全新的市场走势识别模型,并以可视化和智能预警方式为交易者提供直观、精准、具前瞻性的技术分析支持。 二、核心功能与技术原理 1. 卦象建模机制 本指标采用《易经》中六爻构卦的思想,每六根 K 线为一组构成一个完整卦象,通过对 K 线阳线 / 阴线属性的映射,实现卦象与市场多空能量变化的同步反映。 2. 动态震荡信号识别 结合卦象周期的变化,计算当前市场的震荡强度与趋势动量。将震荡信号实时绘制于子图 K 线对应位置,并通过算法判断关键转折点,实现信号预警。 3. 多维可视化与智能提示 在交易图表的子窗口中,指标以图形方式展示: 卦象柱状图(双色) :直观显示当前 K 线所处卦象形态与多空倾向; 震荡信号折线(黄色) :量化表现市场波动强弱; 高 / 低报警线 :用于关键阈值突破时触发语音、弹窗及文本提示,辅助交易决策。 三、产
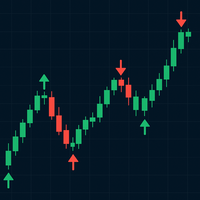
Trend Mark is a versatile trading indicator designed to highlight high-probability entry points using visually intuitive arrows directly on the chart. It analyzes price action and market momentum to identify potential trend reversals or continuations, displaying upward or downward arrows when specific trade conditions are met. Suitable for both beginners and experienced traders, Trend Mark can be used across multiple timeframes and instruments, making it a powerful tool for scalping, day trading

AstroBias Indicator: Precision in the Angle of Your Trend The AstroBias Indicator is more than just a trend direction tool. It also tracks the change in the angle of the price slope , allowing traders to filter signals using angular filters . This makes it especially useful for building automated trading bots based on its signal logic. Key Benefits of AstroBias Indicator Highly Sensitive to Price Action AstroBias responds quickly to real-time price movements, providing clear and timely sign

Sonic Edge Meter: Precision for Reversals and Price Surges Sonic Edge Meter is a powerful indicator built on original algorithms for extremum detection . It’s specifically designed to identify market reversals and sharp directional moves , giving you a clear signal before they happen. How Does Sonic Edge Meter Work? The indicator notifies you of potential turning points or price spikes by displaying visual markers directly on the chart:
Blue dot — signal to buy
Red dot — signal to sell
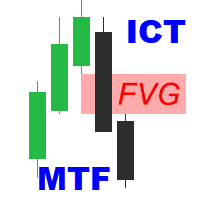
ICT Fair Value Gaps MTF Unlock the power of Fair Value Gaps (FVGs) across multiple timeframes using the ICT Fair Value Gaps Multi - Timeframe Indicator —a precision tool built for traders who follow the Smart Money Concept (SMC) . Key Features : Multi-Timeframe FVG Detection : Automatically identifies Fair Value Gaps from higher timeframes (M15, H1, H4, etc.) and plots them on your active chart for immediate insight. Break of Structure (BOS) & Change of Character (CHoCH): Clearly marked BOS
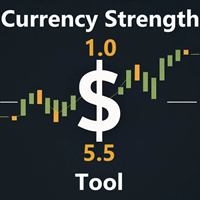
" Currency Strength Tool " is a straightforward and user-friendly indicator designed for analyzing the strength of eight major currencies based on daily price changes of currency pairs. It displays information compactly on the chart in three rows, providing traders with insights into current market dynamics. The indicator serves as an analytical tool, aiding in making informed trading decisions.
It appears as follows: -7.3% 0.5% 0.2% 6.4% 1.2% 3.2% 4.1% 0.4% (daily change) USD E
FREE

The Accumulation and Distribution indicator is a volume-based indicator that was essentially designed to measure underlying supply and demand. This is accomplished by trying to determine whether traders are actually accumulating (buying) or distributing (selling). This is accomplished by plotting a cumulative total of the money flow volume for each period. This indicator can reveal divergences between volume flow and actual price to primarily affirm a current trend or to anticipate a future reve
As the suggested, with this indicator you are able to switch from one symbol or timeframe to another in the same single chart. So forget about opening tons of chart on your screen! It's not designed for ICT or SMC trader, but if you are that kind of trader you still can use it. Imagine you have a strategy containing various indicators and settings, on a single chart you can screen the entry opportunity then move to the next symbol or timeframe.
FREE

Overview The Stochastic Divergence Indicator is a tool designed to help identify potential market turning points by analyzing divergences between price and the Stochastic Oscillator. It highlights divergence signals visually on the chart, assisting traders in observing possible trend changes. Key Features No Repaint: Once a signal is formed, it remains on the chart. Adjustable Parameters: Settings can be modified to fit different trading preferences and timeframes. Visual Display: Arrows are plo
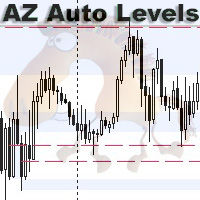
AZ Auto Levels builder ATR edition Indicator of automatic level drawing. For different instruments you need to play with the parameters to find the right ones. So, what is its idea - the indicator searches for levels of interest on the timeframe selected in the settings (by default H1). The search occurs only on candles that are 30% greater than the standard daily ATR of similar candles (you can change this in the settings). ATR is calculated for 20 days ago (also can be changed in the settings)
FREE
Eight indicator for 3 day/session/week setups. Check out our other products for fxer.net:
https://www.mql5.com/en/market/product/114888
https://www.mql5.com/en/market/product/114890
Indicator daily features: Daily close/high/low Weekly open/high/low/close Tokyo/London/New York sessions Alerts Signals and alerts for First Green days First Red days Inside days Outside days 3x days of breakout up 3x days of breakouts down Do not be stupid and take every signal. Learn 3day setups first.
FREE

The Quasimodo Pattern Indicator is no more difficult than the Head and Shoulders. Still, only a few traders know about it, and some even confuse one with the other. However, this is not a reason to avoid this tool in your forex trading strategy. Features: Automatic Detection: The indicator automatically scans for valid QM patterns across any timeframe, reducing the need for manual chart analysis. Visual Highlights: Clear and customizable on-chart drawing of shoulders, heads, and breakout zones

This indicator is converted from Pinescript to MQL5 and consisting of buffers for the range lines as well, its not only object.
The Range Detector indicator aims to detect and highlight intervals where prices are ranging. The extremities of the ranges are highlighted in real-time, with breakouts being indicated by the color changes of the extremities.
USAGE Ranging prices are defined by a period of stationarity, that is where prices move within a specific range.
Detecting ranging marke

When there is no position, when changing the color, you can consider opening an order. With the fluctuation of the market, when the current color changes again, you need to close the position and leave. Suitable for different cycles, the trading rules are simple and require friends to explore on their own.
I hope friends who use this indicator can make a lot of money, rolling bigger and bigger like a snowball. thank you!
The TrendKiller Oscillator is a custom MetaTrader 5 (MT5) indicator designed to help traders analyze price deviations from a moving average, displayed in a separate window. It calculates the difference between a chosen price (e.g., close) and a moving average (default: 14-period SMA), producing a detrended value that oscillates around a zero line. Dynamic maximum and minimum levels, computed over a user-defined period (default: 50 bars), provide context for identifying overbought/oversold condi

SpectralEdge Periodogram - Cycle Analysis Indicator
Overview
The SpectralEdge Periodogram is a powerful technical analysis indicator for MetaTrader 5, designed to uncover hidden price cycles in financial markets using Fast Fourier Transform (FFT). By transforming price data into the frequency domain, this indicator reveals the dominant cycles driving market movements, enabling traders to identify repeating patterns and make informed trading decisions. Whether you're a day trader, swing trader

Multi-MA Ribbon Overlay (6 EMAs + 250 SMA)
This indicator displays six exponential moving averages (15, 25, 35, 45, 60, 70)(YOU CAN CHANGE THE VALUES) and a slow 250-period simple moving average to help visualize market momentum and trend structure. It’s designed as a clean trend-ribbon for scalpers, intraday, and swing traders. ️ Disclaimer:
Trading forex and CFDs on margin carries a high level of risk and may not be suitable for all investors. Leverage can work for or against you. Always u
FREE

Zone to Zone Indicator for MT5 Unleash the full potential of your trading strategy with the "Zone to Zone" indicator for MetaTrader 5. This advanced tool provides unparalleled precision and versatility, making it an essential addition to any trader's toolkit. Key Features: MT5 Compatibility : Seamlessly integrates with the MetaTrader 5 platform for a smooth and efficient trading experience. Accurate Historical Resistance/Support Zones : Effortlessly draw and identify key resistance and support

مؤشر Smart Trend Candles هو أداة فعّالة في منصة MetaTrader 4، تجمع بين عناصر تحليل فني متعددة لتحديد اتجاهات السوق وقياس قوة المشترين والبائعين. يوفر هذا المؤشر متعدد الاستخدامات إشارات مرئية واضحة تُحسّن قرارات التداول الخاصة بك. الميزات الرئيسية 1. تحديد الاتجاه يستخدم شموع Heikin-Ashi المعدلة (اختياري) لتصفية ضوضاء السوق يتضمن متوسطًا متحركًا (فترة قابلة للتكوين) لتأكيد الاتجاه تنفيذ مؤشر القوة النسبية لقياس الزخم 2. قياس القوة تشير الشموع المرمزة بالألوان إلى شدة ضغط الشراء/البيع تحليل الحج

Do you find it difficult to track and manage your open positions across multiple different symbols in MetaTrader 5? Do you need a quick and comprehensive overview of your current market exposure and the performance of each symbol individually? The "Dynamic Exposure Table" indicator is your ideal tool! This indicator displays a clear and detailed table in a separate window below the chart, summarizing all your open positions and intelligently grouping them by symbol, giving you a complete view of

MonetTrend — Премиум-индикатор для торговли по тренду (M30, H1, H4)
MonetTrend — это мощный и визуально понятный трендовый индикатор, созданный для торговли на таймфреймах M30, H1 и H4. Он идеально подходит для работы с волатильными инструментами, такими как: • Золото (XAUUSD) • Криптовалюты (BTCUSD) • Валютные пары (EURUSD, USDJPY и др.)
Ключевые особенности MonetTrend: • Автоматическое отображение Take Profit 1 (TP1) и Stop Loss (SL): После появления сигнала индикатор сразу показывает: • TP

Este indicador calcula e exibe no gráfico o preço justo do mini índice (WIN) com base em dados fundamentais do mercado. Além disso, ele traça automaticamente linhas de suporte e resistência percentuais , ajudando você a visualizar zonas importantes de preço. É como ter uma régua financeira no gráfico, mostrando onde o preço "deveria estar", de forma objetiva, considerando o cenário macroeconômico!
O indicador usa uma fórmula de precificação de contratos futuros baseada em: O preço à vista do Ib

购买该指标的每位用户将额外免费获得以下内容:
原创工具“Bomber Utility”,该工具会自动跟踪每一笔交易,设置止损和止盈点,并根据策略规则自动平仓; 适用于不同交易品种的指标设置文件(Set 文件); 三种不同风险模式下的 Bomber Utility 设置文件:“最低风险”、“平衡风险” 和 “观望策略”; 一套详细的 视频操作手册,帮助您快速完成安装、配置并开始使用本交易系统。 注意: 要获取以上所有赠品,请通过 MQL5 的私人消息系统联系卖家。 我为您介绍原创的自定义指标 “Divergence Bomber”(背离轰炸机),它是一套基于 MACD 背离交易策略 的“全功能”交易系统。
该技术指标的主要任务是识别 价格与 MACD 指标之间的背离,并发出交易信号(包括推送通知),指示未来价格可能的运动方向。平均而言,这些信号的准确率超过 98%。有关该指标如何工作的详细说明,请观看本页面上的视频演示。 该系统使用 止损订单 和 动态回撤平仓机制 来管理交易。 Divergence Bomber 指标的主要特点: 支持交易的品种: AUDCAD、AUDCHF、AUDS
Haven Average Daily Range 是一款功能强大且灵活的指标,用于计算和显示平均每日范围,为交易者提供了评估波动性和潜在每日价格变动的宝贵工具。 经过最新更新,该指标的功能更加完善,增加了直接在图表上分析历史数据的能力! 查看我的其他产品 -> 点击此处 主要功能: 历史ADR水平: 直接在图表上可视化过去几天的ADR水平,以便进行深入分析和视觉回测。 灵活的显示控制: 使用 ShowHistory 参数完全控制历史记录的显示。在需要分析时启用它,在需要简洁图表时禁用它。 性能优化: 使用 DaysToCalculate 设置历史计算的确切天数。这确保了即使在较长时间周期内,您的终端也能保持最快性能。 多周期ADR计算: 基于多个周期(5、10和20天)的经典计算方法,以获得平滑而准确的数值。 动态样式变化: 当达到每日范围时,线条会自动改变颜色和粗细,立即吸引您的注意力。 可定制的可视化: 完全自由地自定义颜色、样式和线条粗细,以完美融入您的交易系统。 交易中的应用: ADR可以有效地用于多种交易决策。当价格接近ADR上轨时,可能预示着买盘枯竭区,特别是与其他信号
FREE

RSI ABCD形态查找器:技术策略 1. 指标工作原理 结合 经典RSI 与自动检测 ABCD谐波形态 。 主要组件 标准RSI (可调周期) 高低点标记 (箭头) ABCD形态 (绿/红线) 超买(70)和超卖(30)过滤器 2. MT5设置 period = 14 ; // RSI周期 size = 4 ; // 最大形态尺寸 OverBought = 70 ; // 超买水平 OverSold = 30 ; // 超卖水平 Filter = USE_FILTER_ YES ; // 确认过滤器 3. 交易策略 3.1. 买入信号(看涨ABCD) 条件: RSI形成: 低点( A ) → 高点( B ) → 更高低点( C ) D 高于超卖区(30)但低于 C 确认:绿色连线A-B-C-D 目标: TP1: B-C的61.8% TP2: B-C的100% 止损: 低于 D 3.2. 卖出信号(看跌ABCD) 条件: RSI形成: 高点( A ) → 低点( B ) → 更低高点( C ) D 低于超买区(70)但高于 C 确认:红色连线A-B-C-D 目标: TP1: B-C的6
FREE

I am a trader specializing in the development of rare , exclusive , high-performance trading bots designed for serious traders who are committed to achieving consistent profitability and success. This free indicator is more than just a visual tool—it powers the Midnight Throttle EA , an automated trading system that executes trades based on the precise market conditions this indicator observes. Midnight Watch : A Pro-Level Tool for Precision Market Analysis. An advanced , multi-functional MetaTr
SyntheticaFX Scalper Pro 指标
SyntheticaFX Scalper Pro 指标是一款多功能且用户友好的工具,旨在帮助交易者在多种时间框架和所有货币对中识别高精度的入场点。该指标在图表上提供清晰的视觉信号,并附带推荐的止损(SL)和止盈(TP)水平,使交易者能够更自信地规划交易。其内置仪表板提供实时交易统计数据,帮助交易者监控表现并做出明智决策。 主要功能 多时间框架兼容性 :无缝适用于多种时间框架,包括 M5 and M15,为不同交易风格提供灵活性。 通用应用 :适用于所有货币对,确保交易者可在广泛市场中使用。 高精度信号 :提供可靠的入场信号,注重精度,帮助交易者捕捉潜在市场机会。 推荐的止损和止盈水平 :每个信号都附带根据市场波动性计算的止损和止盈水平,简化交易管理。 视觉提示 :在图表上直接显示清晰的买入和卖出信号,以及止损和止盈线,便于解读。 性能仪表板 :内置仪表板跟踪交易统计数据,如最近指定交易的胜率、亏损次数和胜率百分比。 可定制设置 :提供多种可调整输入选项,允许交易者根据个人偏好定制指标。 用户友好设计 :以简洁为设计理念,适合初

多时间框架 K 线 指标是一款强大的可视化工具,旨在帮助交易者将较低时间框架的分析与较高时间框架的结构相结合。该指标可直接在当前图表上绘制所选较高时间框架(1 小时、4 小时、1 天等)的 K 线图,让您无需切换图表即可更清晰地了解整体市场走势。
谁需要这个指标? 此工具非常适合: 智能货币概念 (SMC) / ICT 交易者依赖较高的时间框架偏差,同时在较低的时间框架上执行交易。 黄牛和日内交易者希望与每日或时段的动量保持同步。 想要快速浏览 HTF 结构同时在较小图表上细化条目的波段交易者。
无论您交易的是价格行为、供需还是趋势跟踪系统,该指标都能确保您的入场得到更高时间范围的强度支持。
策略改进 多时间框架蜡烛图有助于改善: 方向偏差确认——与主导趋势或市场结构保持一致。 精炼入场点——确定最佳入场区域(例如,5M 图上的看涨日线图内)。 假突破过滤——仅按照 HTF 蜡烛的方向进行交易,以避免陷阱。 HTF 流动性意识——从更高的时间范围内发现潜在的灯芯和反应区。
主要特点: 选择任意更高的时间范围进行覆盖。 自定义蜡烛颜色、边框和填充设置。 将 MTF 蜡烛显示在常
Linear Trend Predictor — 结合切入点和方向支撑线的趋势指标。按照突破高/低价通道的原理运作。该指标算法过滤市场噪音,考虑波动性和市场动态。
指示器功能
使用平滑方法,显示市场趋势和开立买入或卖出订单的切入点。 适合通过分析任何时间范围内的图表来确定短期和长期的市场走势。 输入参数可适应任何市场和时间范围,允许交易者独立定制指标。 设定的指示信号不会消失,也不会重新绘制——它是在蜡烛收盘时确定的。 几种类型的通知以箭头组合。 该指标既可以作为独立的交易系统使用,也可以作为其他交易系统的补充。 可供任何经验水平的交易者使用。
主要参数
Volatility Smoothing Level - 指标的主要参数,允许您配置指标以实现舒适的操作。
它的数字范围是 1 到 100,从而增加了您可以获得更长趋势运动的平滑度。
通过少量的数字,您可以获得短期走势并快速退出交易。
使用指标进行交易的时刻:
红线和箭头表示下降趋势和卖出开盘信号。止损应根据前一个上分形来设置。 黄线和箭头表示上升趋势和买入开盘信号。止损应根据前一个下分形来设置。
Volumatic Trend is a powerful, trend-following indicator that merges directional analysis with real-time volume behavior. By combining adaptive trend logic and volume overlays, it gives traders a detailed snapshot of market conviction and potential turning points. From instant trend shift detection to volume-weighted candle visuals, this tool brings deeper context to price movement. MT4 Version - https://www.mql5.com/en/market/product/136210/ Join To Learn Market Depth - https://www.mql5.co
FREE

蜡烛成交量强度是一种先进的成交量分析指标,可洞察买卖双方之间的持续竞争。它计算并可视化实时成交量变化,帮助交易者更准确地确认突破、趋势、回撤和反转。
主要特点: 基于成交量的确认—— 该指标监控成交量变化,并在市场力量在买家和卖家之间转移时发出警报。 趋势和突破验证—— 通过分析交易量分布,交易者可以确认市场趋势和突破信号的强度。 反转和回撤检测—— 成交量模式有助于识别价格走势中的潜在转折点。 支撑和阻力洞察—— 关键水平附近的成交量增加增强了对其可靠性的信心。 简单有效的可视化—— 以直方图形式显示买卖强度,以便于解释。 蜡烛图成交量强度可帮助交易者利用成交量分析确认市场走势,从而做出明智的决策。在突破期间,高交易量表明市场参与度高,从而增强了突破信号的有效性并降低了错误动作的可能性。理解趋势强度变得更容易,因为上升趋势中成交量的增加证实了持续的购买压力,而下降趋势中成交量的增加表明强劲的卖出活动,为交易者提供了对趋势延续的更大信心。此外,该指标通过识别价格变动和成交量活动之间的差异来帮助发现潜在的趋势逆转。例如,如果价格继续上涨而成交量下降,则可能表明趋势减弱并可能出现逆转。
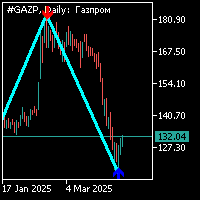
之字形指示器是标准的,周期为34,带有额外的箭头信号。 附加信号与之字形指示器分开计算。该指标的工作如下:1。 当形成之字形指示器的一段并且附加信号以箭头的形式出现时,您需要在箭头的方向上打开一个位置;2。 当zig-zag指示器的另一个臂在与前一个臂的顶部的附加信号(箭头)相反的方向上形成时,就可以建立一个挂单的位置。 在形成与附加信号(箭头)相反的锯齿形肩之后,您可以添加到之前的打开位置或将止损移动到这个水平;4. 如果您以保守的交易模式进行交易,则无法在价格走势的第一次回调之前开设额外的头寸;5。 为了准确地进入市场,您可以等待zig-zag指标段的形成和高级时间框架上的额外信号的出现,同时在距离未平仓头寸不超过40点的位置放置止损。 6. 在您为交易添加了额外的头寸后,未平仓头寸的止损应保持在相同的价格水平,如果头寸在止损处关闭,那么您将以平均值获利;7。 止损,建议在下一个价格回调形成后重新排列(指标的一段将形成之字形朝向附加信号(箭头))。 8. 如果在之字形段形成后,一个额外的信号以箭头的形式出现在你交易的时间框架上,所有的开放头寸都被关闭 9. 在高度波动的金融市场中,
您知道为什么MetaTrader市场是出售交易策略和技术指标的最佳场所吗?不需要广告或软件保护,没有支付的麻烦。一切都在MetaTrader市场提供。
