Смотри обучающее видео по маркету на YouTube
Как купить торгового робота или индикатор
Запусти робота на
виртуальном хостинге
виртуальном хостинге
Протестируй индикатор/робота перед покупкой
Хочешь зарабатывать в Маркете?
Как подать продукт, чтобы его покупали
Платные технические индикаторы для MetaTrader 4 - 12

Информация об индикаторе MACD доступна по этой ссылке .
Описание программы Этот индикатор способен отображать 1-2 индикатора MACD на разных таймфреймах и с разными настройками. Имеется бесплатная версия, которая использует для расчетов EMA. Данная версия Pro использует все 4 типа скользящих средних для расчетов: простая, экспоненциальная, сглаженная и линейно-взвешенная. Активные индикаторы могут подавать всплывающее, звуковое, push-сообщение или оповещение по электронной почте. В бесплатной в

Monster Harmonics - индикатор гармонических моделей (harmonic patterns). Он распознает следующие модели: Гартли (Gartley), Летучая мышь (Bat), Краб (Crab), Бабочка (Butterfly), Монограмма (Cypher), Черный лебедь (Black Swan), Белый лебедь (White Swan), Акула (Shark) и AB=CD. Незаконченные модели также распознаются. Monster даже показывает потенциальную зону разворота (Potential Reversal Zone, PRZ). Пользователи могут добавлять свои паттерны. Кроме текущей модели, Monster также показывает все мод

MetaForecast предсказывает и визуализирует будущее любого рынка на основе гармонии в данных о ценах. Хотя рынок не всегда предсказуем, если существует узнаваемый паттерн в ценах, то MetaForecast способен предсказать будущее с наибольшей точностью. По сравнению с другими аналогичными продуктами, MetaForecast способен генерировать более точные результаты, анализируя тренды на рынке.
Входные параметры Past size (Размер прошлых данных) Указывает количество баров, которые MetaForecast использует дл
Индикатор RSI Pro Analyser — это мощный инструмент, предназначенный для трейдеров, стремящихся принимать обоснованные решения одновременно на нескольких таймфреймах. Этот индикатор использует RSI для предоставления сигналов перекупленности , перепроданности и тренда, что упрощает определение возможностей входа в рынок. Его главным преимуществом является простота чтения благодаря четким и четким цветовым кодам, обозначающим различные рыночные условия.
Индикатор отображает значения RSI и связан

Индикатор волны Вайса основан на теории Ричарда Вайкоффа. Работает на всех таймфреймах, флетовых и тиковых графиках. Может применяться к любому рынку. Индикатор добавляет объемы соответствующих ценовых волн и рисует кумулятивную гистограмму. Каждая ценовая волна движется в определенном направлении вверх или вниз, пока не изменится. Чтобы индикаторная волна развернулась, цена должна превышать количество точек (пипсы * 10), установленных в параметрах индикатора. Поэтому последняя волна перерисовыв

Market Cycles это уникальный авторский индикатор, который использует нейросеть для определения текущей рыночной фазы. Для обучения нейронная сеть используют циклические (разворотные) паттерны. Валютные рынки имеют тенденцию циклически двигаться от медвежьих периодов к бычьим и обратно. В этом продукте мы объединили паттерны с четырех таймфреймов (M5, M15, M30, H1), это позволило значительно увеличить точность сигналов! Market Cycles нужно использовать на валютной паре EURUSD, таймфреме M30 !
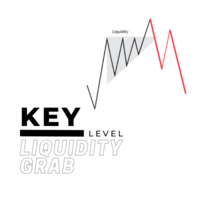
For a bullish move to occur for example, there should be alot of buying power. but you cannot buy if there is no sell on the other side, so the big players usually tend to manipulate the market in order to create available positions on the other side and be able to open their positions and one of the ways is by creating a fake breakout/ a liquidity grab. Before majority of big reversal moves and trends are formed, a liquidty grab would have occured in order to have enough orders to push for the

The Buyside & Sellside Liquidity indicator aims to detect & highlight the first and arguably most important concept within the ICT trading methodology, Liquidity levels. SETTINGS
Liquidity Levels
Detection Length: Lookback period
Margin: Sets margin/sensitivity for a liquidity level detection
Liquidity Zones
Buyside Liquidity Zones: Enables display of the buyside liquidity zones.
Margin: Sets margin/sensitivity for the liquidity zone boundaries.
Color: Color option

Индикатор Blahtech Daily Range отображает средний дневной диапазон вместе с диапазонами отдельных сессий. Используя дневные цены открытия в качестве опорных, индикатор показывает цели фиксированного диапазона и динамического диапазона в виде линий на графике. Эти линии четко показывают, когда происходит истощение среднего диапазона. Дневные и сессионные диапазоны могут быть полезны для подтверждения входов или для установки целей, а также являются отличным способом улучшить шансы любой торговой
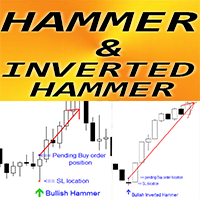
Forex Indicator " Hammer and Inverted Hammer pattern" for MT4 Indicator "Hammer and Inverted Hammer pattern" is very powerful indicator for Price Action trading: No repaint, No delays; Indicator detects bullish Inverted Hammer and Hammer patterns on chart: Bullish Inverted Hammer - Blue arrow signal on chart (see pictures) Bullish Hammer - Green arrow signal on chart (see pictures) P C, Mobile & Email alerts are included Indicator "Hammer and Inverted Hammer pattern" is excellent
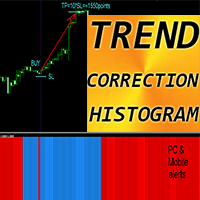
Forex Indicator "Trend Correction Histogram" for MT4 Trend Correction Histogram can be in 2 colors: red for bearish trend and blue for bullish one 7 consecutive histogram columns of the same color means beginning of new trend Trend Correction Histogram indicator designed with the main purpose - to minimize losses and maximize profit It has parameter - "Period", responsible for indicator's sensitivity Built-in Mobile and PC alerts Trend Correction Histogram can be use as a simple but profitable
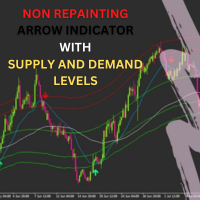
*****ARROWS NON REPAINT ***** Trade With Sam Simple Strategy Guide : https://www.mql5.com/en/blogs/post/740855
MT5 version of the indicator
Try Out and see the Difference
The Sam's Trend Blaster indicator tracks the market trend with an unmatched reliability, by ignoring sudden fluctuations and market noise. It has been designed to trend-trade intraday charts and small timeframes. Its winning ratio is around 85%. This is an arrow indicator that shows precise price reversals. A great ar
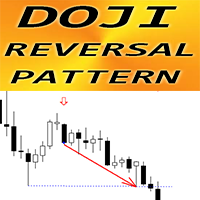
Forex Indicator " Doji Reversal pattern" for MT4 Indicator "Doji Reversal pattern" is pure Price Action trading: No repaint, No delays; Indicator detects Doji Reversal pattern on chart where Doji candle is in the middle of the pattern and the last candle is breakout one: Bullish Doji Reversal pattern - Blue arrow signal on chart (see pictures) Bearish Doji Reversal pattern - Red arrow signal on chart (see pictures) P C, Mobile & Email alerts are included Indicator " Doji Revers

This scanner is monitoring the entire market for trade opportunities for all symbols and for all time frames. You don't have to look to all the charts, for all symbols and for all time frames. This scanner will alert you on your computer, or on your mobile, when a trade opportunity has been found. You never have to miss a trade opportunity! This indicator is designed to scan all pairs and symbols, for all time frames, to find a cross of the MACD main and signal line. MACD Definition
The
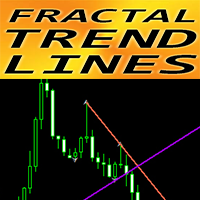
Forex Indicator "Fractal Trend Lines" for MT4 This indicator is excellent for traders who use Graphical Analysis with breakouts!!! "Fractal Trend Lines" shows graphical Up Trend (violet) & Down Trend (tomato color) lines. Up Trend & Down Trend lines are built on 2 nearest corresponding fractals Indicator has few parameters responsible for trend lines color and width I ndicator has built-in Mobile and PC alert of breakout // More great Expert Advisors and Indicators are available here: https:
The FCPI indicator or Forex Currency Power Index indicator for MT4 is a multi currency pairs indicator that displays 28 pairs on 1 chart, which consists of 8 Major Pairs and 20 Cross pairs. 8 Major Pairs and 20 Cross pairs: EURUSD,GBPUSD,AUDUSD,NZDUSD,USDCAD,USDCHF,USDJPY,EURGBP,EURAUD,EURNZD,EURCAD,EURCHF,EURJPY,GBPAUD, GBPNZD,GBPCAD,GBPCHF,GBPJPY,AUDNZD,AUDCAD,AUDCHF,AUDJPY,NZDCAD,NZDCHF,NZDJPY,CADCHF,CADJPY,CHFJPY. Automatically detects symbols that have a symbol prefix and/or a symbol suffi
Представленный продукт является эффективным трендовым индикатором который в зависимости от настроек может использоваться как для краткосрочной торговли (скальпинга) так и для среднесрочных/долгосрочных торговых стратегий. Простота использования индикатора делает его хорошим выбором как для новичков так и для опытных трейдеров. Суть индикатора NRTR (Nick Rypock Trailing Reverse) заключается в том, что он всегда находится на постоянном удалении от достигнутых экстремумов цен – под графиком на вос

Scanner Dashboard for Best Heiken Ashi VQZZ Arrows Indicator here: https://www.mql5.com/en/market/product/45900 Check out this post for detailed description on How To Use All Indicator extras and template: https://www.mql5.com/en/blogs/post/758259
Please note that if you are using too many pairs/timeframes, then VQZZ calculations might slow down the dashboard. So be careful not to use too many VQZZ Higher timeframes if you are using too many pairs.
Also, VQZZ is based on higher timeframes. e

Индикатор Trend PA для определения тренда использует Price Action и собственный алгоритм фильтрации. Такой подход помогает точно определять точки входа и текущий тренд на любом таймфрейме. Индикатор использует собственный алгоритм анализа изменения цены и Price Action. Что дает Вам преимущество без задержек распознать новый зарождающийся тренд с меньшим количеством ложных срабатываний. Условия фильтрации тренда можно подобрать в настройках индивидуально под Ваш стиль торговли. Индикатор отмеча
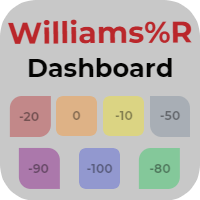
Информационная панель Williams Dashboard помогает получить глобальную оценку рынка на основе значений Williams Percent Range. Панель Williams Dashboard анализирует и отслеживает все выбранные вами инструменты. Это очень полезная панель, которая позволяет открыть любой график за несколько секунд и совершить сделку.
Основные функции панели Williams Dashboard Графическая панель, которая позволяет оценить ситуацию на множестве инструментов. 7 различных ситуаций по диапазону Williams Percent Range,
This indicator gives you nice trigger entry....whatever it is your trading style. You can use on different timeframes and also you can select from the setting the sensibility of the indicator itself, changing the input parameter "cycle period". For faster trigger signals you need to use shorter "cycle periods". You can use it in reversal strategy as well as in trending strategy. Added: - Sound Notification - PopUp Notification - Mobile Push Notification (To make it work follow the inst
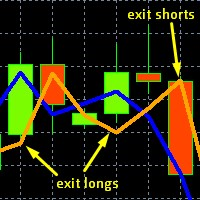
This is the original, simpler version of our core EURUSD algorithm (it calculates and displays 2 lines rather than 3), but it is still capable of detecting levels in the market where EURUSD will likely move to. These levels are indicated by unusual large gaps, formed by the two lines.
Detailed guidance is given to users. All in all it works on the very short term, and more importantly on the daily chart.
The differences between this and our top EURUSD indicator, is that this one only dis
Keltner MTF (Not repaint!!!) is a channel indicator that can display price channels from different timeframes on a single chart of quotes. For example, on the H1 chart, you can see at the same time the Keltner price channel from the M15 and H4 timeframe. This tactic makes it possible to more clearly understand the tendency of price movements, to determine trading goals and points for making deals. How the Keltner MTF Indicator Works The Keltner MTF indicator can be used both - for trading in

Professional Histogram ( PH ) is a highly efficient and reliable tool for trading Forex, CFDs and binary options. PH is easy to use and configure both for beginners and experienced traders. Unlike most indicators, Professional Histogram finds longer trends and gives fewer false signals. When a buy or a sell signal appears, an alert is triggered allowing you to open a position in a timely manner and avoid sitting at your PC all the time. Professional Histogram for the MetaTrader 5 terminal :

В торговой системе "Masters of Risk" один из основных концептов связан с местами, где рынки меняют направление. По сути, это смена приоритета и нарушение структуры тренда на экстремумах рынка, где предположительно находятся или находились бы стоп-лоссы "умных" участников, которые стоят за границами накоплений объема. По этой причине называем их "Разворотные фигуры" - места с большим весом для начала нового и сильного тренда. Некоторые из важных преимуществ индикатора заключаются в следующем:
Че
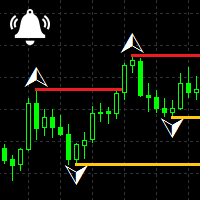
Индикатор Fractals Notifier MT4 является модификацией индикатора Fractals Билла Вильямса. Фрактал представляет собой два набора стрелок - вверх (верхние фракталы) и вниз (нижние фракталы). Каждый фрактал удовлетворяет следующим условиям: Верхний фрактал - максимум (high) сигнального бара больше либо равен максимумам всех баров из диапазона слева и справа; Нижний фрактал - минимум (low) сигнального бара меньше либо равен минимумам всех баров из диапазона слева и справа. В отличие от стандартного
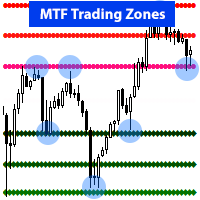
Not a traditional support resistance, or pivot point indicator. RevCan's " Early Reversal - MTF Trading Zones " is an Advanced tool that identifies potential market reversal points, or change of a trend at an early stage using MTF chart analysis. >> It analyzes multiple chart timeframes (MTF) to find these key price turnover zones where big banks and institutions are likely to place their trades, hence chances for you for high probability trade entry, Stop loss, and Take profit targets to maximi

FOTSI (Forex Overview True Strength Index) for MT4 FOTSI is an indicator that analyzes the relative strength of currencies in major Forex pairs. It aims to anticipate corrections in currency pairs following strong trends by identifying potential entry signals through overbought and oversold target areas. Theoretical Logic of Construction: Calculation of Individual Currency Momentum: FOTSI starts by calculating the momentum for each currency pair that includes a specific currency, then aggregates

Break Moment - это уникальный авторский индикатор с широкими возможностями, и разнообразием настроек. Может применяться, как сигнальный, либо вспомогательный инструмент. Для своих расчетов определяет ценовой канал, и при пробое его, если все условия по дополнительным фильтрам соблюдены отображает сигнал в виде гистограммы. С помощью Break Moment можно определять основную тенденцию, так как ко всему прочему он имеет 2 фильтра определяющих ее. Если активировать эти фильтры, то сигналы будут появля

The Th3Eng Ninja indicator is based on an analysis of the right trend direction with perfect custom algorithms. It show the true direction and the best point of the trend. With Stop Loss point and Three Take Profit points. Also it provides a secondary entry points in dots arrows style. And Finally it draws a very helpful lines from entry level to TP1, TP2, TP3, SL levels or the reverse signal, and all current/old signals status.
How to use the indicator
No complicated steps , Just follow 2

Индикатор отображает на графике паттерн "Рельсы". Этот паттерн состоит из двух разнонаправленных свечей с одинаковыми телами и небольшими тенями. Если на текущем таймфрейме паттерн "Рельсы", то на таймфрейме x2 он будет выглядеть как Пин-бар (Doji). Этот индикатор был создан для автоматического поиска паттерна наиболее эффективным способом с помощью логически простых настроек, которые вы можете легко изменить. Есть возможность фильтрации по тренду (2 скользящие средние) и по развороту (RSI и по

[V 1.00] Выпущен MTF NRPA 5 Moving Average RTD!
Приборная панель в реальном времени без перерисовки стрелок.
Если вы ищете лучший индикатор скользящих средних, то вы находитесь на правильной странице. Обычно люди устанавливают две скользящие средние, потому что пересечение двух скользящих средних (пересечение) определяет направление следующего ценового тренда. Если быстрая скользящая средняя пересекается с медленной скользящей средней и быстрая > медленная, то тренд восходящий. И наоборот,

Индикатор рисует уровни Фибоначчи согласно ЗигЗагам, Торговым Сессиям, Фракталам или Свечам (включая нестандартные периоды: Год, Полугодие, 4 Месяца, Квартал, 2 Месяца). Уровни перерисовываются заново, каждый раз, после закрытия текущего бара. Есть возможность включить предупреждения при пересечении заданных уровней. Также вы можете анализировать уровни на истории. Для этого нужно задать количество Фибо-уровней в опции "Number of Fibo in the past".
Параметры Calculate Fibo according to — режим
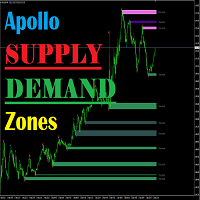
Apollo Supply Demand Zones - это индикатор, который рассчитывает уровни поддержки и сопротивления. Индикатор будет полезен абсолютно всем трейдерам, вне зависимости от того какую стратегию они используют. Данный индикатор может стать одним из основных элементов вашей торговой системы. Индикатор рассчитывает уровни как на текущем тайм фрейме, так и может работать в режиме MTF, отображая уровни с более высокого тайм фрейма. Данный индикатор может использоваться абсолютно на любом тайм фрейме и с л
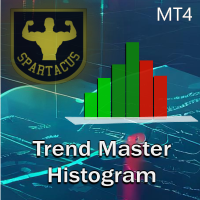
Trend Chart Histogram — индикатор, основанный на алгоритме с использованием двух скользящих средних и нескольких осцилляторов. Благодаря цветовому коду он позволяет быстро определить тенденцию и воспользоваться крупнейшими рыночными импульсами. Светлые цвета указывают на тренд, темные цвета определяют импульсы, а серый указывает на то, что вам не следует входить в рынок.
Версия для МТ5 здесь.
Входные параметры: - Период 1 (быстрый период) - Период 2 (медленный период) - Период осциллятора

Мультивалютный и мультитаймфреймовый индикатор Канала Стандартных Отклонений (Standard Deviation Channel). Отображает текущее направление рынка. На панели вы можете видеть прорывы и касания (ценой) уровней канала линейной регрессии. В параметрах можете указать любые желаемые валюты и периоды. Также индикатор может отправлять уведомления при касании уровней. По клику на ячейке будет открыт данный символ и период. «Канал стандартных отклонений строится на основе Тренда Линейной Регрессии, которая
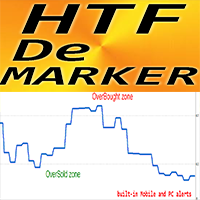
Forex Indicator HTF DeMarker for MT4 This indicator is a useful tool used by technical traders to find entry and exit points. H TF means - H igher Time Frame. DeMarker oscillator line indicates the current price position relative to previous highs and lows
DeMarker provides the most efficient regular divergence signals among other oscillators
OverBought zone is when the D eMarker is above 0.7 and OverSold one - when it is below 0.3
Indicator has built-in Mobile and PC alert
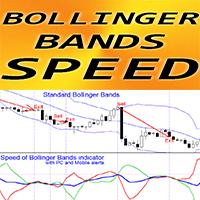
Forex Indicator " Bollinger Bands Speed" for MT4, No Repaint. Speed of Bollinger Bands - is a unique trend indicator The calculation of this indicator is based on equations from physics . Speed is the 1st derivative of standard Bollinger Bands Bollinger Bands speed indicator shows how fast BB middle line and BB borders change their directions By default: Blue line is the speed of BB middle line, Red line - speed of bottom border, Green one - speed of top border It is recom
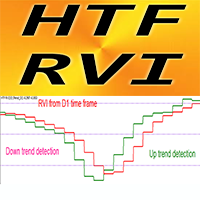
Forex Indicator HTF RVI Oscillator for MT4, No repaint Upgrade your trading methods with the professional HTF RVI Oscillator for MT4. H TF means - H igher Time Frame RVI is one of the best oscillators for trend change detection and entry from Oversold/Overbought areas This indicator is excellent for Multi-Time Frame trading systems with Price Action entries from OverSold/Bought areas . HTF RVI Indicator allows you to attach RVI from Higher time frame to your current chart

Новая, более точная версия индикатора Xmaster . Более 200 трейдеров с разных стран мира провели на своих ПК более 15000 тестов разных комбинаций этого индикатора, чтобы получить максимально эффективную и точную формулу. И вот мы Вам представляем индикатор " Xmaster formula indicator forex no repaint " который показывает точные сигналы и не перерисовывается. Так же этот индикатор отправляет сигналы трейдеру на email и push. Он постоянно с приходом каждого нового тика, анализирует рынок по более

Что если бы Бог создал торговую систему? Без чудес... Просто посмотрите, как математика может быть эффективной на рынке. Нам удалось объединить технический анализ / ценовое движение в индикаторы, создав лучшую настройку для торговли, будь то на рынке Forex, индексах или акциях. Нам понадобилось 2 года, чтобы создать что-то, что действительно работает, и теперь пришло время вам это открыть. TrendX3 - это революция в анализе трендов. На основе передовых алгоритмов и данных в реальном времени он пр

This Indicator does not repaint itself at all, it's identifies a new TREND in the bud, this indicator examines the volatility, volumes and momentum to identify the moment in which there is an explosion of one or more of these data and therefore the moment in which prices have strong probability of following a new TREND.
CandleBarColorate never misses a beat, he always identifies a new TREND in the bud without error. This indicator facilitates the reading of charts on METATRADER; on a single wi
Description:
The Engulfing 13EMA is a Multi Timeframe Indicator that scans Multiple Symbols which will help you to identify potential trade set ups. As well as Forex, it can scan Crypto, Exotics, Metals, Indices, Energies or what ever else you have in your Market Watch list. You also have the option to enable/disable the time frames you want to scan. (M1,M5,M15,M30,H1,H4,D1,W1,MN1) All of these options are made possible from just ONE chart, from which the Indicator is attached
An alert is

In case you get Laguerre S crat indicator, you will get Laguerre Scrat Ea as a Gift. To get Ea and det a iled m anu al PDF contact me PM. Default settings are for usd/cad H4 For St able Long term Profits Laguerre Scrat is a trading system based on 4 indicator combinations in the shape of one indicator. Laguerre indicator (upgraded), CCI, Bollinger bands and market volatility factor. It generates arrows in the indicator window and nuts on the price chart, doubling arrows for a better view where

All about Smart Money Concepts Strategy: Market struture: internal or swing BOS, CHoCH; Orderblock; Liquity equal; Fair Value Gap with Consequent encroachment, Balanced price range; Level with Previous month, week, day level or in day level (PMH, PWH, PDH, HOD); BuySell Stops Liquidity (BSL, SSL); Liquidity Void Long Wicks; Premium and Discount; Candle pattern ... "Smart Money Concepts" ( SMC ) is a fairly new yet widely used term amongst price action traders looking to more accurately navigate

Product detailed post: https://www.mql5.com/en/blogs/post/756962
Get free demo from the link in above post.
Features: - Multi Heiken Parameters
- Alerts & Highlights for Heiken Switch
- Heiken Alignment Alerts
- Multi-timeframe Alignment Alerts
- Multi Currency
Heiken Explained: Heiken Settings: All comma separated lists will be used for different heiken ashi's. Example: 5,40,188 will mean that MAPeriod1 in 1st heiken will be 5; In 2nd heiken will be 40 and in 3rd heiken ashi will be 1

Biwavelet - индикатор для гармонического прогнозирования рынка на основе построения одномерных вейвлет функций-преобразований. Вейвлет преобразования являются одним из основных инструментов цифрового алгоритмичексого трейдинга. Это связано с их способностью анализировать и прогнозировать процессы, происходящие в двух независимых базовых измерениях - цены и времени. Вейвлеты обладают существенными преимуществами по сравнению с преобразованием Фурье, потому что вейвлет-преобразование позволяет суд

The indicator displays the following elements: Supply Zones, Demand Zones, Fair Value Gaps and sends alerts when a supply or demand zone is reached. The zone timeframe is set independently of the chart timeframe. For example, it is possible to set M5 zones on an H4 chart. The importance of zones can be adjusted using the zone strength parameter. Demand zones are displayed if at least one candle in the range of the zone is entirely above the zone. Similarly, supply zones are displayed if at least

Imbalance / Fair Value Gap (FVG), this is a zone / gap created when the price move with force in a given direction. It identify a zone where the price could potentially go back. This gives perfect targets for your trades.
Imbalance is created from the high and low of 3 candles. When the wicks the of 1st and 3rd candle does not fully overlap the middle one.
This indicator will help you to easily spot mitigated/unmitigated imbalances in your chart.
NEW FEATURE Update: Multi-TimeFrame Feat

after getting indic ator cont act me for Bonus E a. Non Repaint TMA channel with special conditioned arrows on price cross of channel lines plus market Volatility factor, which makes product much more accurate than any usual tma channel indicators. It is proven to be profitable with Ea built based on it which you will get as a BONUS in case of indicator purchase. Good luck.

The indicator determines the trend and its direction. At the same time, it shows
the oversold and overbought zones. Thus, it determines the most profitable
places to open a position. The indicator can be used as a filter and complement
to any strategy. It can also be used as an independent tool.
Advantages
The indicator does not redraw the values. Works on all available tools. Works on all periods. It has a minimum of settings. The ability to use it as a primary and auxiliary indicato

The Pearson Trend!! My name is Murat Yazici. I have B.Sc. Statistics and M.Sc. Quantitative Methods degrees. I have several scientific papers, conference presentations in Texas, Toronto, London, Istanbul, books and book chapters studies, and many projects about mathematical and statistical modelling. I am also journal reviewer at some scientific journals.
What is The Pearson Trend's Logic? It is based on A Fuzzy Model developed by me. Vague or fuzzy data and application several fields,

Это инструмент, помогающий не только торговать по методике VSA (Volume Spread Analysis) и PRICE ACTION, но и изучать в разрезе данные методы. Индикатор ищет на графике паттерны VSA и PRICE ACTION с учетом текущего тренда. Есть возможность просматривать паттерны старшего таймфрейма на графике текущего периода. Пользовательский режим дает возможность находить свои паттерны и закономерности рынка на основе метода VSA. Также имеется гистограмма объемов с автоподстройкой толщины и визуальными горизон

uGenesys AI - 90% Accurate Daytrading Indicator
Introducing the ultimate forex trading indicator system, uGenesys AI, powered by cutting-edge AI technology and advanced analytical techniques, including Time-Series Analysis and Genetic Algorithms. Our AI-powered trading system leverages the power of time-series analysis to identify trends and patterns in historical price data, allowing traders to make informed predictions about future market movements. By analyzing vast amounts of data, our sys

This strategy is best used for Trend based trading. While market is trending, price still makes smaller ranges. Darvas boxes show breakouts from these small ranges, while still following the original market trend. Detailed Description: https://www.mql5.com/en/blogs/post/747919
Features:
Darvas - Check Darvas Box Breakout
- Check Price Above/Below MA or Darvas Box has crossed MA
- Min, Max Box Height
- Max Distance Between Entry Price and Darvas Box
Other Indicators:
- NRTR Tren
The FTR Multi-Timeframe indicator is a versatile tool that can add great value to your trading arsenal. This indicator is intended to be used to add confluence to your already existing trading strategy, such as, breakout & retest, supply and demand, patterns or continuation trading. FTR Multi-Timeframe is a continuation indicator. Rules are attached as a screenshot.
Settings for Demo/Strategy Tester: Set Server_Time_Filter to false in indicator settings ( IMPORTANT! ). Tick 'Show object desc

Welcome to Propsense, the best solution for new and veteran traders with a simple FREE strategy! This indicator is a unique and affordable trading tool built on the teachings of a former bank trader. With this tool, you will be able to see inefficient points with ease. As well as this, traders will have an interactive display panel which will show your running and closed P/L in pips AND currency units. It also allows you to set your desired daily target/loss limit! IMPORTANT INFORMATION
Maxim
30% discounted ONLY 10 COPIES HURRY UP! 5 LEFT COPIES All Features now have in current version. Very precise patterns to detect High Accurate Order Blocks: It Draw zone after market Structure Breakout with a high Accuracy, institutional orders with the potential to change the price’s direction and keep moving towards it, have been placed. Features Auto Order Blocks Draw Market Structure BOS LINE Auto Imbalance Detect Auto Trend Detect MTF Order Blocks Double Signal One Alert Signal Second Lo

Chart Patterns Detect 15 patterns (Ascending Triangle, Descending Triangle, Rising Wedge, Falling Wedge, Bullish Flag, Bearish Flag, Bullish Rectangle, Bearish Rectangle Symmetrical triangle, Head and Shoulders, Inverted Head and Shoulders, Triple top, Triple Bottom, Double Top, Double Bottom) Use historical data to calculate the probability of each pattern to succeed (possibility to filter notification according to the chance of success) gives graphic indication about the invalidation level and

Levels Pro System рассчитывает канал движения цены, учитывая волатильность инструмента, бары и тренд, - и на основании расчетных данных показывает тренд и чертит уровни поддержки/сопротивления в очень удобном визуальном представлении. В индикатор встроена система определения критических точек (критических баров), которая позволяет трейдеру значительно проще выявлять истинный пробой уровня, ложный пробой, отскок от уровня, возможный сигнал на ранней стадии движения цены итд. Таким образом, торгов

Индикатор продаж PTS Divergence Finder от Roger Medcalf - Precision Trading Systems. Этот индикатор предоставляет только медвежьи - сигналы на продажу. Прежде всего, меня много раз спрашивали, почему я не предоставил индикатор дивергенции на продажу, хотя с удовольствием предоставлял индикатор дивергенции на покупку много лет. Я дал ответ, что сигналы на продажу менее надежны, чем сигналы на покупку, что до сих пор остается верным. Некоторые решения для изменения этой ситуации были найдены не пу

Martin Armstrong Cycles employs an unconventional form of technical analysis on your charts aimed at capturing market angles, swift market movements, price reversals, and early trend shifts. I strongly advise all traders to integrate cyclical analysis into their charting methods, as it unveils the inherent rhythms of markets. Every element in the universe follows a cycle, and so does price!
Analytical Benefits of Cyclical Analysis
The angle of the cycle provides a roadmap for anticipating fu

PTS - Divergence Buy Finder от Precision Trading Systems Precision Divergence Finder был разработан для точного определения дна рынка и часто успешно справляется с этой задачей. В техническом анализе искусство выбора дна обычно намного проще, чем выбор вершины, и этот инструмент разработан именно для этой задачи. После обнаружения быстрой дивергенции мудро подождать, пока тренд не изменится вверх, прежде чем покупать. Для входа можно использовать высокий уровень за 10 или 20 баров или скользящее

Структура индикатора. Индикатор Cunning crocodile ( Хитрый крокодил ) состоит из трех скользящих средних (примененных к цене Median price = ( high + low )/2 ) : обычной MA ( SMA , EMA , SMMA , LWMA ) или среднего < X > процесса X и двух ее обобщений <X F >=<X/<X>>*<X> и <X S >=<X*<X>>/<X>, берущихся с тем же периодом усреднения. Все три кривые пересекаются в единых точках, что (такое пересечение, при котором хитрый крокодил,

Описание
Money Zones - индикатор, определяющий зоны накопления/распределения на рынке. Зеленые зоны позволяют искать точки входа в покупку или точки выхода из продажи. Красные зоны, напротив, определяют возможность продажи или закрытия покупок. Индикатор имеет возможность определять денежные зоны для двух временных интервалов одновременно на одном графике.
Как использовать?
Используйте этот индикатор, чтобы определить рыночные зоны как зоны поддержки/сопротивления, чтобы определить наилуч

Supertrend indicator uses a combination of a moving average and average true range to detect the trend of a trading instrument.
Supertrend indicator for MetaTrader 5 easily shows the trend as a line following the price.
USAGE THIS INDICATOR If the closing prices are above Supertrend Line, there is a Bullish sentiment at that moment. The opposite is a Bearish sentiment. Three green lines - Strong Bullish sentiment. Three red lines - Bearish sentiment.
For BUY : - Three green lines and pr
CONGESTION BREAKOUT INDICATOR: When you see a sideways price movement in a meaningless market, what goes through your mind? Is it a danger, an opportunity or completely a vacuum? Let's see if we can avoid the latter and focus on using it to our advantage. The ability to read price action through the display of rectangles on the chart could be the boost you need to achieve your trading goals. What is congestion? Congestion is a market situation where the price is trading around a particular leve

Индикатор Multicurrency Trend Detector ( MTD ) позволяет сразу и на одном графике на выбранном временном интервале, простирающегося от нулевого бара до бара, задаваемого в настройках величиной horizon , определить наличие, направление и силы трендов всех основных валют, а также оценить надежности этих трендов. Это достигается посредством расчета индексов (безотносительных покупательных способностей) восьми основных валют, а именно: AUD, CAD, CHF, EUR, GBP, JPY
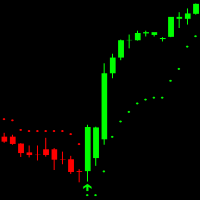
Easy Trend Indicator can be used for all forex pairs, indices and cryptocurrencies. It´s a non rapainting Trend trading indicator and works on all timeframes. GREEN candles show an uptrend and RED candles show a Downtrend. Arrows show when to enter the Market. Indicator has 7 Inputs: Max History Bars = On how many Bars in the Chart the indicator is drawn ATR Period = How many Bars are used for Average True Range calculation ATR Multiplier = Is used for Indicator sensitivity (Higher multiplier =

MT5 Version
Understanding market sentiment is a critical aspect of successful trading. Market sentiment refers to the overall feeling or attitude of traders and investors towards a particular financial instrument, such as a stock, currency pair, or cryptocurrency. It is a collective perception of market participants' emotions and beliefs about the asset's future price direction. Market sentiment can be bullish (positive), bearish (negative), or neutral (sideways). Knowing the market sentiment
Узнайте, как легко и просто купить торгового робота в MetaTrader AppStore - магазине приложений для платформы MetaTrader.
Платежная система MQL5.community позволяет проводить оплату с помощью PayPal, банковских карт и популярных платежных систем. Кроме того, настоятельно рекомендуем протестировать торгового робота перед покупкой, чтобы получить более полное представление о нем.
Вы упускаете торговые возможности:
- Бесплатные приложения для трейдинга
- 8 000+ сигналов для копирования
- Экономические новости для анализа финансовых рынков
Регистрация
Вход
Если у вас нет учетной записи, зарегистрируйтесь
Для авторизации и пользования сайтом MQL5.com необходимо разрешить использование файлов Сookie.
Пожалуйста, включите в вашем браузере данную настройку, иначе вы не сможете авторизоваться.