 MetaTrader 5
 Эксперты
 Индикаторы
 Библиотеки
 Утилиты
 Виджеты
 Правила
Смотри обучающее видео по маркету на YouTube
Как купить торгового робота или индикатор
Запусти робота на
виртуальном хостинге
виртуальном хостинге
Протестируй индикатор/робота перед покупкой
Хочешь зарабатывать в Маркете?
Как подать продукт, чтобы его покупали
Бесплатные технические индикаторы для MetaTrader 4 - 25
 На основании сигналов технических индикаторов из списка ниже вы сможете принимать решения относительно открытия или закрытия сделки в платформе MetaTrader 4.
Работа индикаторов заключается в математическом преобразовании цены и/или объемов финансового инструмента для прогнозирования изменений цен.

Представляю эффективный инструмент определения разворота на таймфрейме H4. Сам индикатор устанавливается на график М30. Все параметры уже установлены. Правильное использование индикатора: К сожалению проверка в тестере не даст правильное представление об индикаторе, поэтому аренда на один месяц максимально доступна. Не нужно устанавливать файл на удалённый сервер. Установите его в терминал на локальном ком
FREE
Набирается блок баров при условии конвергенции . Если условия конвергенции не соблюдаются, блок удаляется. Более точнее, условием является переход блока баров из состояния конвергенции в состояние дивергенции . Блоки формируются выборочно с пропусками. Пропуски характеризуются состоянием дивергенции баров. Перед тем как блок удалится, находятся экстремальные значения баров внутри блока ( min , max ). Линия соединяет экстремальные бары. Линия прорисовывается только перед тем как блок уда
FREE
If you are boring in repeatedly changing of trading symbol in every charts when use multiple charts to analyzing prices or trading. This indicator can help you. It will change the symbol of any other charts in the terminal to the same as in the chart you have attached this indicator to it whenever you add new symbol to the chart or click on the button. After finished the job it will sleep quietly waiting for new occasion in order to minimize resource usage of the computor.
FREE

Fast T3 MA Trend indicator derived from T3 moving averages. This indicator is part of the T3 Cloud MA indicator and is posted here on its own. Buying/Selling opportunities above/below line. The MA line can also be used as dynamic support/resistance for more aggressive entries. Use default values for best settings. The number of look back bars is user defined. This indicator can be used in combination with other strategies such as price action. Suitable for all time frames.
FREE
I decided to list it for free. Combined Informer of DeMarker with RSI MTF. Each parameter can be change values in menu. it is good for scalping or for weekly trading and looks as universal fx-toy. Now I use it for BTC, ETH, BNB. In menu you can turn on daily percentage gain info, weekly and monthly gains also included as informers. Short ATR helps to determine when price was slow/stopped and entry for pulse pump/dump. The filter of numbers of RSI can be tuned for overbought/oversold values w
FREE

the AK CAP toolbox free to use;
it includes the same indicators we use for our daily trading and we think the simpler the better. Lightweight indicator for use on all timeframes. that includes VWAP with vwap value indicator on top right. 3 EMA: FAST, MEDIUM, SLOW the candle timer to show how much time left in a candle.
colors and positions are fully customizable.
enjoy
FREE
Questo indicatore per MT4 traccia automaticamente i punti di pivot giornalieri sul grafico, fornendo livelli chiave di supporto e resistenza basati sui prezzi di apertura, chiusura, massimo e minimo del giorno precedente. I punti pivot aiutano i trader a identificare potenziali aree di inversione e zone di prezzo critiche, migliorando la precisione nelle decisioni operative quotidiane."
FREE

Its primary motive is to overlay horizontal lines spaced according to multiples of the Average True Range (ATR), centered on a reference price from defined periods such as trading sessions, candlestick counts, or 12-hour intervals. This facilitates the identification of potential support and resistance levels or expected price ranges. Additionally, it marks major forex trading sessions (Sydney, Tokyo, London, and New York) with arrows to provide contextual awareness of market hours, enhancing d
FREE
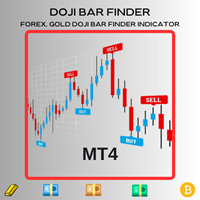
This automated DOJI BAR FINDER INDICATOR can be utilized to manage trades and identify potential areas of support and resistance for both buying and selling. It is designed to identify zones for Sell/Buy trades and can be effectively used in conjunction with other indicators, such as order block indicators, and more. Currently designed for MT4, it will later be adapted to function on MT5. We also offer the opportunity to customize the robot according to your trading strategy.
FREE
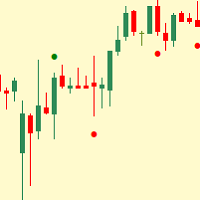
Simple indicator that shows external ( outside ) bars. In certain cases, external bars can be seen as strong trend bars instead of range bars. This can be observed when a with-trend external bar occurs at a reversal from a strong trend. It will help you notice more easily different patterns like - Inside-outside-inside, Inside- Inside -inside, outside - Inside -outside, etc. Works perfectly with my other free indicators Internal bar and Shadows
Inputs: How many history bars to calculate on loa
FREE
WONNFX create arrow tester. Сonstructor/Tester. Tester for buffer indicators. Converting a buffer indicator into an arrow signal on the chart. Combining two buffer indicators into one arrow signal. Filter by candle color. You can move the arrow signal several bars forward (useful in cases where the indicator gives signals 2-3 bars late
"WONNFX create arrow tester" is a tool designed specifically for traders who use buffer indicators in their trading strategies. This tester converts the buffer
FREE

Active Price Lines
Indicator gives you full custom control over the Bid and Ask price lines, both color and style. Color control is also customizable based on increased or decreased price by the tick.
Options include: Show both the Bid line and the Ask line Set unique color for each Set unique line style for each Set unique color for increased price (by the tick) Show only Bid line Show only Ask line
Rider Capital Group
FREE

This indicator displays two important pieces of information on the MT4 chart: Current Spread - Trading cost measured in points, helping traders assess optimal entry timing when spread is low. Time Countdown - Remaining time (minutes:seconds) until the current candle closes and a new candle forms, supporting candle-based trading strategies. Information is displayed as compact text in a chart corner (default top-right), with customizable position, color, and font size. The indicator updates in rea
FREE

Индикатор SFT Fibo Smart Pivot - это мощное торговое средство, основанное на золотом сечении Фибоначчи, которое помогает определить ключевые уровни поддержки и сопротивления на рынке. Этот индикатор обладает способностью выявлять важные ценовые уровни, которые могут стать точками входа и выхода из сделок. Он позволяет трейдерам более эффективно анализировать рынок и принимать более обоснованные решения. Вычисляет несколько уровней поддержки и сопротивления, что позволяет трейдерам видеть целый с
FREE

A lightweight, non-intrusive on-chart floating dashboard for MetaTrader 4 (MT4) and MetaTrader 5 (MT5) . It provides critical market telemetry and live account status directly inside the chart window with interactive drag-and-drop and minimize functionality. Key Features Interactive Drag & Drop: Click anywhere on the dashboard panel to reposition it seamlessly across the chart window. Automatic boundary detection keeps the panel within the chart frame. Smart Minimize / Expand Toggle ( _ / + ): C
FREE

L'indicatore Go Trend è un indicatore personalizzato per MetaTrader 4 (MT4) basato su una logica di ZigZag con tre livelli di periodi diversi.
Questo indicatore è progettato per identificare i punti di inversione del prezzo (massimi e minimi) su diversi timeframe, aiutando i trader a individuare potenziali trend e punti di ingresso/uscita nel mercato.
Funzionalità Principali Identificazione dei Punti di Inversione (ZigZag) L'indicatore utilizza una logica di ZigZag per tracciare linee che coll
FREE

Aurora P&L Dashboard — Free
Aurora P&L Dashboard puts your profit and loss right on the chart — so you can close the crowded terminal window and still keep the overview.
Live on your chart:
Today — realized P&L since midnight (server time)
N days — realized P&L over a period you set
Positions — number of open positions and total lot
Floating — current open P&L
Two modes:
Account-wide — all symbols together
Single symbol — type any symbol (e.g. EURUSD, USDJPY), or leave blank for the chart
FREE

Multi Timeframe Indicator сочетает в себе множество функций и может считаться универсальным помощником трейдера в принятии решений. Основной его задачей является отображение вплоть до десяти индикаторов одновременно, используя всего один маленький квадрат на каждый индикатор. Среди индикаторов, доступных для отображения, - Awesome Oscillator, CCI, DeMarker, MACD, RSI, RVI, Stochastic, Percent Range Ларри Вильямса, Bulls Power и Bears Power. Важной функцией индикатора является возможность отслеж
FREE

Индикатор Slope Channel для MetaTrader
Ищете инструмент для анализа рыночных тенденций, который подходит для любого стиля торговли? Slope Channel – ваш надежный помощник в определении направленного движения цены и ключевых уровней рынка! Что такое Slope Channel? Slope Channel – это инновационный индикатор, который строит наклонный канал на графике, автоматически рассчитывая его параметры на основе локальных экстремумов. Этот инструмент выделяет оптимальный вариант канала, позволяя вам бы
FREE
QuantumAlert CCI Navigator is a free indicator available for MT4/MT5 platforms, its work is to provide "alerts" when the market is inside "overbought and oversold" regions in the form of "buy or sell" signals. This indicator comes with many customization options mentioned in the parameter section below, user can customise these parameters as needful. Join our MQL5 group , where we share important news and updates. You are also welcome to join our private channel as well, contact me for the pri
FREE

Пересечение Скользящих Средних (v1.00) — это инструмент технического анализа и динамического управления для MetaTrader 4, предназначенный для отслеживания рыночных трендов на основе взаимодействия двух скользящих средних. Он позволяет изменять все рабочие параметры прямо на графике без необходимости открывать окно настроек индикатора. Общее описание функций панели Управление скользящими средними (Строки 1 и 2) Выбор периода (-10, -1, +1, +10): Быстрое увеличение или уменьшение периода расчета с
FREE

Индикатор Стрелки (Сигналы на Покупку/Продажу) – простой, но мощный инструмент!
Версия продукта : 1.01
Тип индикатора : Сигналы разворота тренда
Поддерживаемые таймфреймы : Все (Рекомендуется: H1, H4, D1) Ключевые особенности : Сигнал на покупку : Зелёная стрелка вверх () под свечой
Сигнал на продажу : Красная стрелка вниз () над свечой Точное определение разворотов тренда – основано на проверенной стратегии SMA.
️ Чистый график – минималистичный, ненавязчивый стиль ото
FREE

////////////////////////////////////////////////////////////////////////////////////
Улучшенная версия стандартного индикатора Standard Deviation.
Теперь это адаптивная и сглаженная линия.
Настройка не совсем простая - но я надеюсь что вы справитесь. Понять показания этого индикатора очень просто, смысл такой же как и у обычного Standard Deviation .
/////////////////////////////////////////////////////////////////////////////////////
Надеюсь этот индикатор очень Вам пригодится в успеш
FREE

The MACD (Moving Average Convergence Divergence) indicator is one of the most widely used technical analysis tools by traders worldwide. Created by Gerald Appel in the 1970s, the MACD is an indicator that helps investors identify the trend direction, trend strength, and possible trend reversal points. The MACD indicator is composed of a histogram that shows the difference between the 12-period exponential moving average and the 26-period exponential moving average. The top part of the histogram
FREE
Velvet RSI is intended for use with the Velvet advanced ordering layer. It is a modified version of the RSI indicator provided by Metaquotes and all of the data it displays is accurate and verified, when it is detected by the ordering layer. In order to place orders with the Velvet RSI indicator, the ordering layer must be installed and running. Ordering from the Velvet RSI indicator requires that "Velvet Ordering Layer" ( found here ), version 1.0 or higher, be installed and running. When de
FREE

The Hurricane Cave Indicator shows different trade areas based on price action. It looks in the past and works out patterns that can enforce support and resistance as targets. When price breaks out of a trade area you can target just inside the next trade area. If you can't see the target just go to a slower time frame, it means the price hasn't been there for a long time. The Hurricane Cave Indicator is designed to be an add on to The Hurricane Forex Indicator also available in the Meta Trader
FREE
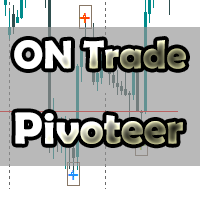
Introducing the Pivot Point Selector Indicator: Your Ultimate Tool for Custom Pivot Levels Are you ready to take your trading to the next level? Say hello to the Pivot Point Selector Indicator, a game-changing tool that puts you in control of your pivot levels. This innovative indicator empowers you to choose three specific points that will determine the pivot level calculations, giving you unparalleled customization and precision in your trading strategy. Key Features and Benefits: Custom Pivo
FREE

Zentrade — это ваш переход на профессиональный уровень. Это индикатор, который даёт вам устойчивость, ясность и точность, чтобы вы могли торговать с уверенностью, зная, что ваш сигнал не исчезнет, а ваша логика не будет нарушена.
Никакой Перерисовки. Никогда. Сигналы BUY и SELL генерируются мгновенно на текущей свече и закрепляются навсегда. Что вы видите, то и есть реальность.
Неизменная Логика. Прошлые сигналы не удаляются и не изменяются. Вы можете анализировать историю с полной увер
FREE
Simple indicator that shows your history in pips and profit. You can use it to follow your progress on the positions. It shows you the trade progress only for the symbol that the indicator is on and only for your trade history. Label text is updated when order is closed. The text can be displayed on each corner, it is in the parameters.
Basic input parameters: Label color Font size Conrner position Anchor position Note: corner and anchor have to be the same position.
FREE

Сигнал Тройного Слияния (Confluence): Ловим Идеальный Разворот Одиночные индикаторы часто грешат ложными срабатываниями, собирая «рыночный шум». Но когда три совершенно разных по логике инструмента одновременно указывают в одну точку — это уже весомый аргумент для входа. Данный сигнал построен на принципе Confluence (слияния факторов) , соединяя силу осцилляторов с дневными ценовыми границами. Что включает в себя сигнал Сигнал объединяет три независимых эшелона анализа: RSI (Фильтр макро-настро
FREE
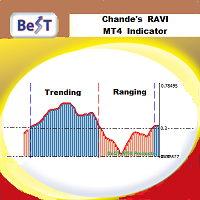
BeST_Chande RAVI (Range Action Verification Index) is an MT4 Indicator that is based on the corresponding indicator developed by Tushar Chande which is mainly based on market momentum while focuses on identifying ranging and trending markets.
By default RAVI is defined by the formula: RAVI = Absolute value (100 x (SMA(7) – SMA(65)). Also by default there is an arbitrary reference level of 3% that means a market is ranging if the RAVI is less than 3%, or trending strongly if it is is greater th
FREE

FuturePriceM15 - один из немногих индикаторов, который делает прогноз цены прямо на ценовом графике. Алгоритм расчета индикатора основан на быстром преобразовании Фурье. Имея колебательное поведение цены, функция Фурье прогнозирует ее поведение в дальнейшем. Индикатор устанавливается обычным образом на график с торговым инструментом указанным в переменной symbol с периодом M15 , данный временной период является самым оптимальным для работы с любыми торговыми символами. После установки, индикато
FREE
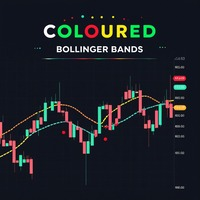
Coloured Bollinger Bands The Coloured Bollinger Bands indicator is an enhanced version of the standard Bollinger Bands, offering customizable features to suit your trading needs. It uses the classic Simple Moving Average (SMA) as the middle band, and allows you to easily change the appearance of the bands, including the option to select colors and line types, ensuring better visual clarity and adaptability on your charts
FREE
Осциллятор FxSProWPR генерирует сигналы для подтверждения ТРЕНДА, а также для подтверждения возникновения новых тенденций.
Параметры индикатора NumberBars - Число баров отображения индикатора. Большое количество баров может существенно замедлить работу торгового терминала. SignalAlert - Alert-сигнал тренда. SignalSound - Звуковой сигнал тренда. Сигнал будет звучать при превышении гистограммой величины уровня 15.
Правила для подтверждения входа в позицию Зеленая гистограмма - ВОСХОДЯЩИЙ ТРЕНД (
FREE

Displays previous months Highs & Lows. You can set the number of months to display levels for, also the line style, color and width. This is very useful for traders using the BTMM and other methods like ICT. I'll be creating similar indicators for MT5 for the BTMM. Send me your suggestions to my Telegram: https://t.me/JDelgadoCR Take a look at my other products at: https://www.mql5.com/en/users/jdelgadocr/seller
FREE

Индикатор PipTick Fibo позволяет автоматически отображать уровни коррекции Фибоначчи, которые являются значимыми уровнями поддержки и сопротивления. Диапазоном для расчета индикатора может быть дневная, недельная, месячная или любая выбранная пользователем сессия.
Levels - уровни 100 % (Максимум) диапазона предыдущей сессии. 0 % (Минимум) диапазона предыдущей сессии. 76,4 % диапазона предыдущей сессии. 61,8 % диапазона предыдущей сессии. 50 % диапазона предыдущей сессии. 38,2 % диапазона предыд
FREE

Just INDY is a simple, and easy to use trend and reversal indicator. It will continuously monitor the movement of the price actions searching for new trends establishing or strong reversals at extreme overbought, and oversold levels.
Parameters Signal Perios
Sent Notification Please Test it with Strategy Tester and see how it work.
Happy Trading...
FREE

Данная версия индикатора работает только в потоке тиковых данных. Таким образом мы видим только текущую ситуацию с момента запуска. Рекомендую использовать классическую версию Real-Time Currency Valuation . Индикатор рассчитывает силу восьми основных валют, а также может рассчитать силу любой другой валюты, металла или CFD.
Основные особенности Умеет отображать только необходимые на данный момент валюты, таким образом не перегружая Вас лишней информацией и уведомлениями. Имеет встроенный набор
FREE
Индикатор информирует о том, когда закроется текущий бар и откроется новый бар. ВРЕМЯ является важным элементом торговых стратегий. Индикатор BarTimerPro поможет вам КОНТРОЛИРОВАТЬ ВРЕМЯ . Простой в использовании: поместите на график и если нужно задайте “будильники”. В тестере индикатор не работает
Основные Возможности
4 режима работы: Показывает время прошедшее с момента открытия текущего бара (11) Показывает время оставшееся до закрытия текущего бара (11) Обновление индикатора каждый Ти
FREE

CCFp (Complex_Common_Frames percent) is a measure of currency strength.
Shows the total rate of change of “short-term moving average” and “long-term moving average” for each currency.
Supports eight major currencies: USD, EUR, JPY, CHF, GBP, AUD, CAD and NZD.
1). Displays the currency name at the right end of the graph.
2). You can change the display color of each currency.
3). Moving average smoothing type (ENUM_MA_METHOD) can be selected.
4). Price constant (ENUM_APPLIED_PRICE) can be c
FREE
Технический индикатор представляет собой более продвинутую версию индекса относительной силы (RSI), который применяет принципы конвергенции-дивергенции скользящей средней (MACD) к индикатору двойного сглаживания RSI (DS RSI). Индикатор выводится путем вычисления разницы между двойным сглаженным RSI и простой скользящей средней (SMA) DS RSI. Цель индикатора-обеспечить более точные сигналы на покупку и продажу, чем стандартный расчет RSI.
MACD получается путем вычитания 12-периодной экспоненциал
FREE

Indicator to be placed in the same folder as Dash to activate the alert filter with Heiken Aish. After downloading the indicator, copy it to the same folder so Dash can read the indicator. It is not necessary to insert it into the chart, this is only for Dash to search for signals and inform the direction of buying and selling of the Indicator. Check if the indicator's path is correct within Dash.
FREE
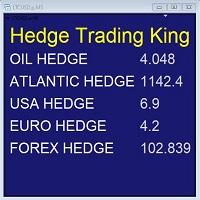
Hedge Trading Monitor is my indicator that instantly monitors the difference or ratio between two assets useful for hedge trading. How to use it + Download the indicator + Apply the indicator on an open chart + You can change the assets using the settings. Distribution + It is distributed only on MQL5.vom + Free license (FREE) - Contact me privately on MQL5.com: send me a message
FREE
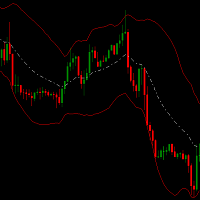
Channel hero indicator is a special channel which helps you to detect oversold/ overbought areas. It can be a complementary indicator for your strategy.
It can be combined with bollinger bands . When price breaks above bollinger bands and upper channel hero band is above bollinger band and also
the white line (middle channel hero line) is above middle BB then this point has big possibility to go up. A good closing point can be when middle channel hero line cross below middle bollinger bands.
FREE
Time to Trade Trading timing indicator is based on market volatility through 2 ATR indicators to determine the timing of a transaction. The indicator determines the times when the market has strong volatility in trend. When histogram is greater than 0 (blue) is a strong market, when histogram is less than 0 (yellow) is a weak market. Should only trade within histograms greater than 0. Based on the histogram chart, the first histogram value is greater than 0 and the second histogram appears, this
FREE
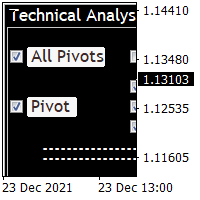
Technical Analysis 4 in 1 give you Pivot points, Resistances, Supports, Fibo, OHCL all together with any timeframe and you can back as you want in candles Pivot points have been a trading strategy for a long time. Using this method, you can understand where the market is going in a day through a few simple calculations. you can switch on/off any line you want. please check the pictures to understand more about this indicator.
FREE
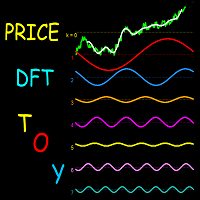
This indicator is a useful tool for visualising cyclic components in price. It calculates the Discrete Fourier Transform (DFT) of a price chart data segment selected by the user. It displays the cycles, the spectrum and the synthesised signal in a separate window. The indicator is intended as a learning tool only, being unsuitable for providing actual trade signals. Download the file - it is a free toy. Play with it to understand how signals can be transformed by controlling their cyclic comp
FREE
O Chart Control é um indicador que permite de forma rapida e pratica alterar o timeframe e ativo do grafico, possibilitando que voce possa fazer todas as suas analises em apenas um grafico sem precisar abrir vários, além disso voce pode escolher o entre os temas claro e escuro para o qual melhor se adapta a sua preferencia.
MT5: https://www.mql5.com/pt/market/product/109444
FREE

Introducing Momentum Jurik—an innovative indicator designed to optimize your forex trading strategy by incorporating custom moving averages based on the Momentum indicator with the MetaTrader 4 indicator, Momentum.
Jurik moving averages are renowned for their precision and reliability in analyzing price movements in the forex market. They provide traders with smoother representations of price action, reducing noise and offering clearer signals for identifying trends and potential reversals.
T
FREE
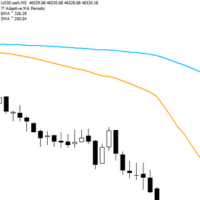
Adaptive Flow MAs is a moving average indicator designed to naturally adjust to market movements. Unlike traditional averages, it dynamically adapts its periods based on recent volatility and the current trend. The EMA closely follows rapid price swings to capture every impulse, while the SMA remains smoother, providing a stable and reliable reference. With a clean display showing the current adaptive periods, this tool helps traders feel the “flow” of the market without visual clutter. It’s cr
FREE

The risk-to-reward ratio is used for assessing the potential profit (reward) against the potential loss (risk) of a trade. Stock traders and investors use the R/R ratio to fix the price at which they'll exit the trade, irrespective of whether it generates profit or loss. A stop-loss order is generally used to exit the position in case it starts moving in an opposite direction to what a trader anticipated.
The relationship between the risk and reward helps determine whether the potentia
FREE

Индикатор SkyNet EMA подскажет вам когда следует открывать длинную или короткую сделку на основе ценового действия и пересечений экспоненциальных скользящих средних, например, с периодами 14 и 50. Просто установите его на график, и он будет отслеживать возникновение возможностей для продажи на графике инструмента, а при их появлении нарисует красную стрелку на графике. Также он будет искать возможности для покупки, а при обнаружении их нарисует зеленую стрелку на графике. Индикатор можно использ
FREE
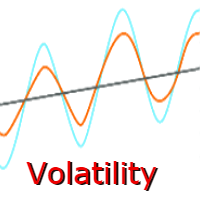
С помощью данного инструмента теперь нет необходимости проверять волатильность интересующих вас валютных пар на сторонних вебсайтах с целью определения среднего диапазона движения цены. Индикатор Truly Volatility предназначен для определения волатильности и расчета среднего движения цены в часовой, либо дневной период. Данные отображаются в отдельном окне в виде гистограммы и текстовых значений. Использовать индикатор можно как альтернативу тому же ATR, но возможностью более детального анализа.
FREE
Traders Dynamic Index (TDI) Signal Input parameters: signal mode: set it to true if you want to plug it into STAT (Signal Tester and Trader) arrow shift: distance between fast EMA line to arrow on chart middle band filter price line filter RSI period RSI price method Volatility period MA period 1 MA period 2 Averaging method You can find the best setting for 4 hour EURUSD on this video
FREE
EMA Above Below Bid price Технический индикатор в помощь трейдеру. Данный индикатор, показывает расположение пяти ЕМА,
пяти средних скользящих, относительно цены формирующей японские свечи или бары (цена Bid ).
О понятии ЕМА.
Скользящая средняя (moving average, MA) — это дополнительная линия на графике цены актива.
Внешне она повторяет график цены, но с небольшим запозданием и более гладко, без колебаний. Основные характеристики:
1. Показывает тренды. Если скользящая устремлена ввер
FREE

The Starting Points indicator for MetaTrader 4 is a technical analysis tool that shows the monthly, weekly, and daily starting points, as well as the 1000-point and 500-point levels, in the forex market. The indicator is displayed as a series of horizontal lines that represent the starting points and levels. Benefits of Using the Starting Points Indicator Identify potential trend changes: The Starting Points indicator can help traders identify potential trend changes by highlighting areas wher
FREE
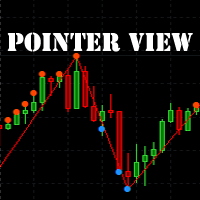
This is an indicator based on a standard ZigZag . The indicator puts points on the chart where the ZigZag has drawn another top or bottom. Everyone knows that the ZigZag indicator redraws its values. The Pointer View marks these values. The indicator gives an alert when a new point appears. Parameter Applied Price - expands the possibilities of building the indicator. It is possible to build at OPEN , CLOSE and standard HIGH/LOW prices. Input parameters
----------- Depth - period of the
FREE

EMA indicator based on BTMM In BTMM, common EMA colors include Yellow for EMA 5, Red for EMA 13, Light Blue/Aqua for EMA 50, White for EMA 200, and Dark Blue for EMA 800. These color-coded EMAs represent different market timeframes and are used to identify trends, potential reversal points, and areas of support and resistance. consist of
Yellow (Mustard): EMA 5 Red (Ketchup): EMA 13 Light Blue (Water): EMA 50 White (Mayonnaise): EMA 200 Dark Blue (Blueberry): EMA 800 White
FREE
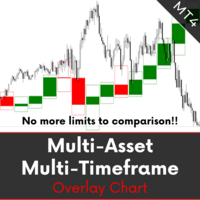
MA MTF Overlay Chart is software that allows you to overlay the candlestick chart of a financial instrument with a second candlestick chart of the same one, or of another, financial instrument, by setting a different timeframe from that of the basic chart. The software is very simple to use and the input parameters are listed below.
Input parameters: Overlay chart set-up Financial instrument : financial instrument that you want to overlay on the base chart Time period : secondary instrume
FREE
YOU CAN NOW DOWNLOAD FREE VERSIONS OF OUR PAID INDICATORS . IT'S OUR WAY OF GIVING BACK TO THE COMMUNITY ! >>> GO HERE TO DOWNLOAD
V1 Scalper is an easy to use tool designed for trend scalping. It tries to spot good entry points in a major trend by using swing high and lows formed along the trend . This tool can be used on Fx Pairs , Indices , Commodities and stocks. Not often but in some signals , the arrow might repaint on the current candle so extra confirmation tools are advised for tr
FREE

Каждому трейдеру знаком этот ритуал: открыть настройки индикатора, изменить число, нажать OK, прищуриться на график, решить, что всё не так, и снова открыть настройки. У Relative Vigor Index задаётся всего одно число — период, — но даже один такой заход в диалог каждый раз стоит вам того же цикла «поменял и вглядываюсь», когда хочется сравнить 10 с 14 на своём инструменте. RVI Live Tuner с этим покончил. Это классический двухлинейный RVI (сам RVI и его Signal), который настраивается прямо на гра
FREE

Каждый трейдер знает этот ритуал: открыть настройки индикатора, изменить число, нажать OK, всмотреться в график, решить, что не то, и снова открыть настройки. Если вы торгуете на MetaTrader 4, вы делаете это годами — а DeMarker так и остаётся тихим измерителем перекупленности/перепроданности, до которого у большинства трейдеров не доходят руки: он навсегда остаётся на стандартных 0.30/0.70, потому что проверка любого другого значения стоит одного захода в диалог настроек. DeMarker Live Tuner с э
FREE
Recommended broker to use the indicator: https://tinyurl.com/5ftaha7c Indicator developed by Diogo Sawitzki Cansi to show possible trade points. Do not repaint. The results displayed in the past are exactly what happened. We also use it to hold trades longer and not get out on false reversal signals which are actually just a profit taking of trades and no one is trying to reverse the direction of the trend. Indicator Parameters: PERIOD: Period for analyzing the buying or selling force to fin
FREE

1. Месячные, недельные и дневные опорные точки рассчитываются с начальными и конечными данными для каждого периода.
2. Это обеспечивает простую линию на графике, чтобы определить, где находятся опорные точки и уменьшить погрешность расчета.
3. Индикатор поможет очень быстро определить основные опорные точки инструмента, даже если вы не понимаете, как рассчитать опорные значения.
4. Вы также можете сравнивать недельные и дневные пивоты, чтобы лучше понять положение цены.
5 Этот индикатор помо
FREE

Индикатор отображает на графике важные технические уровни. Эти уровни выступают поддержкой или сопротивлением для движения цены. Наиболее важные уровни кратные 100 и 50 пунктам. Также можно вывести уровни кратные 25 пунктам. При достижении ценой уровня выводится алерт или пуш-уведомление. Версия для MT5 https://www.mql5.com/ru/market/product/69740 Настройки
Show Levels 100 pips - показать уровни кратные 100 пунктам Show Levels 50 pips - показать уровни кратные 50 пунктам Show Levels 25 pips -
FREE
Индикатор ChartOverlay несёт в себе две основные функции 1. Oтзеркаливания - то есть к примеру из EURUSD он сделает USDEUR 2. Oтображения графика цены выбранного финансового инструмента (с выбранным периодом) в подокне основного графика. Этот инструмент позволяет трейдерам легко анализировать взаимосвязь между различными валютными парами и активами, предлагая уникальные функции настройки и визуализации. Основные функции: Отображение графика цены: Индикатор отображает график цены выбранного инстр
FREE
Идет подготовка EA версии. Можете отправить личное сообщение "оповестите о EA версии". EA будет универсален с множеством настроек для торговли по различным индикаторам.
Новый EA позволит так же торговать по данному индикатору.
К примеру разрешая сигналы после Х сигналов/баров до Х сигналов/баров в одном направлении, до смены направления.
Если Break Out произошёл до/после сигнала другого индикатора.
Набирать прибыль на каждом следующем сигнале выше/ниже предыдущего. Отправьте личное сооб
FREE

***IMPORTANT: This free indicator works with the paid for Strong Weak Forex Expert Advisor. The EA also depends on the following custom indicators: Strong Weak Heiken Ashi Strong Weak Symbols Strong Weak Values Strong Weak Indicator Download them for free in the Market. The EA will not work without it. These are all custom indicators which the Strong Weak Forex Expert Advisor relies on to generate trading signals. If you have any problems with installation send me a message.
FREE

This pointer is supplied of a double smoothing in such way to succeed to be more reactive of a blunt Moving Average but without tracing the noises of bottom of the market. Its use will have to be exclusively turned to the search and to the identification of the trend in action (even if graphically it could seem an indicator that indicates an inversion of the prices) because the first useful signal is had to the opening of the successive bar to that one that has made to invert the sense of the
FREE

Всем привет, мои друзья, сябрыыы. Я трейдер, 20 лет опыта. Хочу продемонстрировать свой индикатор. Индикатор создан на базе в тесной кооперации с индикатором arrows_template. Данный индикатор рисует на графике инструмента (любого) индикатор AO(Awesom) поверх. Видите сам AO на графике. Видите пересечение зоны нуля, Блюдце и т.д.. Если будут подсказки, корректировки. Пишите смело, всех пошлю.......Шутка До свидания.
FREE
Узнайте, как легко и просто купить торгового робота в MetaTrader AppStore - магазине приложений для платформы MetaTrader.
Платежная система MQL5.community позволяет проводить оплату с помощью PayPal, банковских карт и популярных платежных систем. Кроме того, настоятельно рекомендуем протестировать торгового робота перед покупкой, чтобы получить более полное представление о нем.

Вы упускаете торговые возможности:
- Бесплатные приложения для трейдинга
- 8 000+ сигналов для копирования
- Экономические новости для анализа финансовых рынков
Регистрация
Вход
Вы принимаете политику сайта и условия использования
Если у вас нет учетной записи, зарегистрируйтесь