Смотри обучающее видео по маркету на YouTube
Как купить торгового робота или индикатор
Запусти робота на
виртуальном хостинге
виртуальном хостинге
Протестируй индикатор/робота перед покупкой
Хочешь зарабатывать в Маркете?
Как подать продукт, чтобы его покупали
Бесплатные технические индикаторы для MetaTrader 4 - 21

Introducing RSI Jurik—an innovative indicator designed to revolutionize your forex trading strategy by combining custom moving averages based on the Relative Strength Index (RSI) with the MetaTrader 4 indicator, RSI.
Jurik moving averages are renowned for their accuracy and reliability in analyzing price movements in the forex market. They provide traders with smoother representations of price action, reducing noise and offering clearer signals for identifying trends and potential reversals.
FREE

Introducing Momentum Jurik—an innovative indicator designed to optimize your forex trading strategy by incorporating custom moving averages based on the Momentum indicator with the MetaTrader 4 indicator, Momentum.
Jurik moving averages are renowned for their precision and reliability in analyzing price movements in the forex market. They provide traders with smoother representations of price action, reducing noise and offering clearer signals for identifying trends and potential reversals.
FREE
This indicator displays the historical spread values on the chart. This is an extremely useful tool for watching the spread rise and fall, allowing you to enter the market at just the right time. This indicator will help you stay out of the market when the spread begins to rise and help you get into the market as the spread begins to fall again.
ON SALE FOR FREE, GET IT FREE FOR A LIMITED TIME ONLY
FREE

This is a multi time frame demand and supply indicator for MT4 platform. You can use multi time frame demand and supply levels on smaller time frames. Additionally you can choose to kill every level has has been tested. you have narrow bands that is you can select the whole demand and supply level or just a narrow section Finally, you also get price range for the zones. Awesome
FREE
Индикатор Daily Average Retracement Dashboard позволяет одновременно отслеживать несколько валютных пар. Этот индикатор предназначен в основном для стратегий, торгующих по ценовым коррекциям на основе уровней сопротивления 3/4 и уровней поддержки 3/4. После установки индикатора на график, он скроет график и отобразит валютные пары в виде таблицы. В таблице показано несколько полей с данными, которые помогут трейдеру узнать, когда анализировать валюту и торговать на откатах. Индикатор показывает
FREE

Индикатор строит две простые скользящее средние по ценам High и Low. Линия MA_High отображается, когда скользящая направлена вниз. Она может быть использована для выставления стоп ордера для позиции на продажу. Линия MA_Low отображается, когда скользящая направлена вверх. Она может быть использована для выставления стоп ордера для позиции на покупку. Индикатор используется в эксперте TrailingStop . Параметры Period - период расчета скользящей среднейю Deviation - коэффициент сдвижения/раздв
FREE

Binary options tester Торговая панель для тестирования своих стратегий по правилам бинарных опционов. Возможности: Выставлять время экспирации в секундах. Задавать размер ставки. Задавать размер депозита. Задавать процент прибыли с сделки. Заключать несколько сделок подряд. Отслеживать время до закрытия опциона. График тиков с уровнями сделок дублируется на дополнительное окно для точности. Позволяет работать как в режиме тестирования так и в режиме реальных котировок. Программа дает представлен
FREE
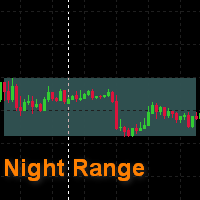
Простой вспомогательный индикатор, который рисует ночной диапазон. Время начала и время конца рабочего дня указываются в часах, настраивается цвет прямоугольников. Помогает просматривать историю в поисках закономерностей, исключая непредсказуемое ночное время. Может использоваться для поиска прорыва ночного диапазона. Рисуется как фон и не перекрывает график и другие индикаторы.
FREE
I create this this Free Indicator to help you to plot your BUY / SELL Average and BEP level in your chart. Just drag to your chart, and you can see the level and plan better to your trade. It's usefull if you have averaging position or even hedging position, so you can plan your trade better and no need to calculate manually again. Use it for free, and please leave comment if you feel this usefull.
FREE

Индикатор в виде гистограммы показывает восходящий и нисходящий тренды. Данный инструмент рекомендуется использовать в качестве фильтра. Основываясь на его показаниях можно отследить начало, окончание и продолжение тренда. Этот дополнительный инструмент подойдет для любой торговой системы. Параметры Period — период индикатора; Bars — количество баров для отображения на истории.
FREE

Have you ever wondered which currency is the strongest at any particular time? Or which currency pair is trending the most. Well, the currency strength meter helps with just that. It compares USD , EUR , AUD , CHF , GBP , CAD and NZD depending on the timeline you have chosen in settings, and ranks them on the number of pips each has moved compared to the rest. N/B: All currency charts of the above pairs must have loaded. You can do this by highlighting all major and minor currencies
FREE

Описание Продукт основан на применении скользящей средней к индикатору Momentum. Подтвержденные пересечения скользящей средней с линией Momentum отмечаются стрелками на графике. При пересечении скользящей средней снизу вверх отображается стрелка на покупку и наоборот. Стрелки не перерисовываются, так как индикатор использует лишь подтвержденные значения и ожидает закрытия свечи перед тем, как вывести стрелку на график. Индикатор также может выдавать алерты при появлении стрелок. Предусмотрены 3
FREE
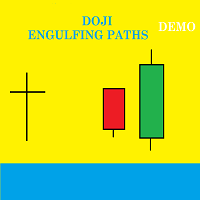
Общие сведения Индикатор Doji Engulfing Paths отображает на графиках сигналы и данные о дожи и паттернах "Поглощение". Это позволяет следовать за трендом на форексе и биржах. Вы можете использовать все возникающие торговые возможности как при сигнале разворота, так и при сигнале продолжения тренда. В этой демо-версии сигналы доступны только с двадцатой свечи.
Особенности Благодаря быстрому исполнению индикатор позволяет получать информацию о новых паттернах дожи на графике, начиная с последней
FREE

The Hurricane Cave Indicator shows different trade areas based on price action. It looks in the past and works out patterns that can enforce support and resistance as targets. When price breaks out of a trade area you can target just inside the next trade area. If you can't see the target just go to a slower time frame, it means the price hasn't been there for a long time. The Hurricane Cave Indicator is designed to be an add on to The Hurricane Forex Indicator also available in the Meta Trader
FREE

OCTO TACK TREND INDICATOR
Summary/Description: Trend indicator showing signals to execute orders in favor of the current trend Get ready to have the best trend indicator you've ever tried. No repainting in any way, guaranteed It generates clear signals and always in favor of the trend (see screenshots) You just have to wait for the alert to indicate it and earn pip Are you tired of indicators that never work? Here we have the solution, try the free version and if you want to have more signals
FREE
TIRED OF HAVING TO CALCULATE THE LOTSIZE EVERY TIME?
This indicator will do it for you, WHATEVER ASSET YOU CHOOSE in 10 seconds !!!
INSTRUCTIONS
The things to do in order to activate this indicator will take around 10 seconds once you understand how to use this indicator properly.
Here are the steps to follow:
Place the indicator on the chart of the asset you want to trade on.
Go to " Inputs ".
Enter where you want to set the stop loss .
Choose risk in $ .
You can also
FREE
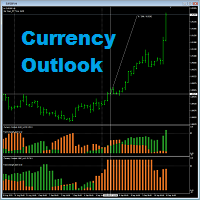
Currency Outlook is an indicator that can help us "Trade the right pair in the right direction and at the right time". This indicator analyzes prices of all cross currency pairs of the selected currency and report the result to us in form of double colours histogram diagram. The maximum height of the histogram diagram of the indicator is 100. The indicator is exclusively programming for AUD, CAD, CHF, EUR, GBP, JPY, NZD and USD. A feature for calculating trade lot size has been added to th
FREE

Реализация индикатора рыночного цикла описанного Раджи Хорнер в книге "FOREX на 5 часов в неделю: как зарабатывать трейдингом на финансовом рынке в свободное время" . Текущее состояние рынка можно определить посредством анализа угла наклона экспоненциальной скользящей средней (EMA) работающей на периоде 34 бара. Если наклон EMA определяется как направление часовой стрелки на циферблате: от 12 до 2 часов, следует считать, что присутствует восходящая тенденция; от 2 до 4 часов, рынок консолидирует
FREE

My Account Brokers Details This indicator displays the account data and broker terms regarding its operation. For example, broker name, account number, financial leverage, account currency, automatic trading approval, minimum lot, lot step, maximum number of lot, margin call, stop out and many other important data. It is easier to display such data on the chart in one moment with a click of the mouse, than to look for it in the contract or call the broker.
FREE

Индикатор для синхронизации и позиционировании графиков на одном и более терминалах одновременно. Выполняет ряд часто необходимых при анализе графиков функций: 1. Синхронизация графиков локально - в пределах одного терминала при прокрутке, изменении масштаба, переключении периодов графиков, все графики делают это одновременно. 2. Синхронизация графиков глобально - тоже самое, но на двух и более терминалах, как МТ4, так и МТ5. 3. Позиционирование графика на заданном месте при переключении периодо
FREE

The risk-to-reward ratio is used for assessing the potential profit (reward) against the potential loss (risk) of a trade. Stock traders and investors use the R/R ratio to fix the price at which they'll exit the trade, irrespective of whether it generates profit or loss. A stop-loss order is generally used to exit the position in case it starts moving in an opposite direction to what a trader anticipated.
The relationship between the risk and reward helps determine whether the potent
FREE

Commodity Channel Index and Moving Average [CCI MA] A combination of CCI and MA to create a crossover trading setup Input parameters: signal mode: set it to true if you want to plug it into STAT (Signal Tester and Trader) arrow shift: distance between fast EMA line to arrow on chart price line filter CCI period CCI price method Moving average period Averaging method upper level lower level You can find the best setting for 4 hour EURUSD on this video
FREE

Индикатор реализован для определения классического канала движения цены, который используется на крупных биржевых площадках. Не перерисовывается Синий уровень - это уровень поддержки Красный уровень - это уровень сопротивления Белый уровень - является Pivot-уровнем Настройки Period_SEC - ввод значения периода . Примечание: Индикатор определяет уровни только на пятизначных котировках! Метод торговли: Открытие позиций осуществляется от уровней , именно на их значениях происходит отскок цены
FREE

Простейший информационный индикатор, показывающий время до открытия следующей свечи или бара.
О понятии таймфрейм Таймфрейм - это промежуток времени, рассматриваемый в техническом анализе свободных финансовых рынков (это же касается и глобального валютного рынка), в течение которого происходит изменение цен и иных рыночных данных, в период построения ценовых графиков. Самым маленьким таймфреймом является так называемый тик. Таймфрейм - это интервал времени, используемый для группировки котиров
FREE

Introducing the “Symbol Cost Info MT4” indicator – your ultimate tool for staying ahead in the forex market! This innovative indicator is designed to empower traders with real-time cost information, directly on their charts. Here’s why every trader needs the “Symbol Cost Info MT4” in their arsenal: Real-Time Spread Monitoring : Keep a close eye on the spread for any currency pair, ensuring you enter the market at the most cost-effective times. Pip Value at Your Fingertips : Instantly know t
FREE

Necessary for traders: tools and indicators Waves automatically calculate indicators, channel trend trading Perfect trend-wave automatic calculation channel calculation , MT4 Perfect trend-wave automatic calculation channel calculation , MT5 Local Trading copying Easy And Fast Copy , MT4 Easy And Fast Copy , MT5 Local Trading copying For DEMO Easy And Fast Copy , MT4 DEMO Easy And Fast Copy , MT5 DEMO
The homeopathic indicator is also called the CCI indicator. The CCI indicator was propos
FREE

Данный индикатор предназначен для бинарных опционов. Построен на авторской дивергенции индикатора CCI. Сигнал на продажу: Появление на графике стрелки вниз. Сигнал на покупку: Появление на графике стрелки вверх.
Входные параметры History - Количество баров для расчета в истории. Period CCI - Период технического индикатора CCI Up border - граница перекупленности для вычисления дивергенции Down border - граница перепроданности для вычисления дивергенции Price - цена расчета индикатора Alerts - А
FREE

Time to Trade Trading timing indicator is based on market volatility through 2 ATR indicators to determine the timing of a transaction. The indicator determines the times when the market has strong volatility in trend. When histogram is greater than 0 (blue) is a strong market, when histogram is less than 0 (yellow) is a weak market. Should only trade within histograms greater than 0. Based on the histogram chart, the first histogram value is greater than 0 and the second histogram appears, this
FREE

Indicator showing the breakout after at least X candles of the same sign, followed by an opposite candle. PARAMETERS: BARS TO SHOW = Story of Indicators (0 = all bars) Consecutive Bars for Breakout = How many Bars of the same direction and after a Bar with opposite direction Minimu Point between H/L = To consider a bar valid, she must have a Minimun Hi/Lw value Minimu Point between O/C = To consider a bar valid, she must have a Minimun Open/Close value Graphics are self-explanatory
FREE

In physics, "Jerk" is the third time-derivative of position, with acceleration being the second derivative and velocity the first derivative. In technical analysis, the first derivative of price is the price momentum, with the second derivative,acceleration, being seldom used and the third derivative virtually unknown. The magnitude frequency response of a digital differentiator is a positive-slope straight line passing through zero frequency. Therefore, every instance of a digital signal differ
FREE
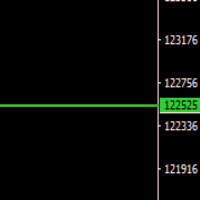
Simple Market Line Price Color
This indicator allows you to see the market's aggregation by buying or selling on the price line.
when it is attacked the sale turns into a color when it is attacked the purchase takes on another color
Indicator Parameters
indicator_colorUP - Color of UP price aggregation indicator_colorDown - Color of Down price aggregation indicator_WIDTH - WIDTH Line in chart
Good Trades
FREE
Binary Options Assistant (BOA) FLAME Signals Indicator provides signals based on the combination of: RSI, MACD & Stochastic Indicators
Stop missing trades, stop jumping from chart to chart looking for trade set-ups and get all the signals on 1 chart! U se any of the BOA Signals Indicator with the Binary Options Assistant (BOA) Multi Currency Dashboard .
All BOA Signal Indicator settings are adjustable to give you more strategy combinations. The signals can be seen visually and heard a
FREE

EUR INDEX
The Currency Index Project is ONE part of a thorough Forex study. Many people do not know the theoretical basis that drives currency exchange rates to move on the market. With this set of tools you will be able to have a more complete view of the entire market by analyzing not only the single currency of an exchange, but all the exchange rates that make up that currency by looking at a single window!
The indicator faithfully represents the real index of a single currency present in
FREE

Индикатор сконвертирован из кода другого языка программирования программистом "sbtnc". MQL-версия упрощена, чтобы быть более полезной за счет меньшей сложности настроек.
Есть несколько подсказок от программиста по поводу индикатора:
Индикатор отслеживает и сообщает процент появления дневных вершин и низов по времени суток. В определенное время в течение торгового дня рынок разворачивается и отмечает максимум или минимум дня. Вершины и низы крайне важны при входе в сделку, поскольку они опр
FREE

Chart Time — очень простой индикатор, но он может быть очень важным помощником для контроля времени перед открытием сделки вручную. В индикаторе есть три варианта отображения времени на графике.
Входные параметры Show Time : выбор вариантов отображения времени. Local Time (локальное время компьютера), Server Time (время сервера брокера) или GMT. Рекомендации: Индикатор надо запускать на каждом необходимом графике.
FREE

SmartStochasticMt4 - универсальный индикатор для принятия торговых решений. Незаменимый инструмент для начинающих трейдеров, так как не имеет настроек и полностью готов к работе после установки.
Преимущества индикатора:
1. Работает с любым торговым символом
2. Работает на любом временном периоде
3. Не имеет настраиваемых параметров
4. Представляет полную картину торговой ситуации с разных временных периодов
5. Не запаздывает
Работа с индикатором
1. Установить индикатор
2. Исключить из
FREE
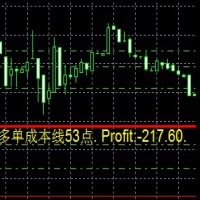
Dies ist ein Indikator
Dies ist ein Indikator, der immer die Auftragskosten und die Rentabilität in Echtzeit widerspiegelt
Besonders wenn es auf die Martin-Strategie angewendet wird, ist es bequemer 这是一个指标
这是一个时时反应订单成本 和实时 盈利值得 指标
尤其应用于 马丁策略的时候 更加方便 This is an indicator
This is an indicator that always reflects the order cost and real-time profitability
Especially when applied to the Martin strategy, it is more convenient
FREE

Moving indicator. It is written so that it doesn't signal when two moving averages cross. Easy to operate. It performed well on European and Asian currencies. Designed for long-term and medium-term types of trading. Индикатор мувингов. Написан так что даёт сигнал при пересечении двух скользящих. Прост в управлении. Хорошо себя показал на европейских и азиатских валютах. Рассчитан на долгосрочный тип торговли.
FREE

Velvet RVI is intended for use with the Velvet advanced ordering layer. It is based on the algorithm for the Relative Vigor Index, provided by Investopedia here . All of the data it displays is accurate and verified against the internal API function iRVI, when it is detected by the ordering layer. In order to place orders with the Velvet RVI indicator, the ordering layer must be installed and running. Ordering from the Velvet RVI indicator requires that "Velvet Ordering Layer" ( found here ),
FREE
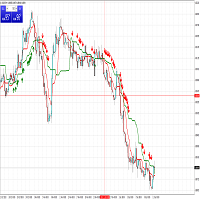
Two Advanced Moving Averages Are you looking for a indicator simple and effective? It will help you! Indicator use two MA to identify trends. User manual: If fast MA(red line) cross over slow MA (green line) and appear first signal buy arrow => you can long. If fast MA(red live) cross below slow MA (green line) and appear first signal sell arrow => you can short.
FREE

A tool for backtesting my ATR Trailing Stoploss Helper ( https://www.mql5.com/en/market/product/34103 ) Added on-screen buttons for manual backtesting: - Clicking on button SET, then click on a candle where you want to see how this indicator would draw the ATR trailing stop for that exact time. Parameter: DRAW_ATR_TRAILING_STOP_LEVEL_TIMEFRAME = PERIOD_H4; //timeframe to calculate the value of ATR DRAW_ATR_TRAILING_STOP_LEVEL_PERIOD = 10; //period of the ATR
DRAW_ATR_TRAILING_STOP_LEVEL_MULTIPL
FREE

Traditional Moving Average (SMA, EMA, SMMA, LWMA...) is very useful for identifying trends, but what will you do when you want to trade on lower timeframe, and you need to identify the bigger trend by a higher timeframe; Of course, you can make it by dividing your chart in separated windows, but your analytics will not be clear and intuitive ... That's why we build the Multi Timeframe Moving Average indicator.
With Multi Timeframe Moving Average ( MTF_Moving Average ), you can determine the M
FREE
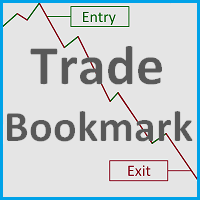
Этот инструмент поможет вам найти, пересмотреть и задокументировать ваши прошлые сделки, отмечая точки входа и выхода ценовыми метками. Он предназначен для помощи в анализе вашей торговли, например, чтобы найти сильные и слабые стороны вашей стратегии. Он также может помочь в написании дневника торговли, четко показывая историю ваших прошлых сделок, которые вы хотите пересмотреть. Для выбора только тех сделок, которые, например, были открыты определенным советником, можно указать магический номе
FREE
An indicator for analyzing different currency pairs simultaneously Forex is a complex market that requires several currency pairs to be analyzed simultaneously Determine the number of currency pairs yourself Determine the currency pair you want to analyze to analyze 4 of the most important and similar currency pairs at the same time. For direct and simple analysis, some currency pairs have changed (EURUSD>>>USDEUR) Do not doubt that to succeed in this market, you must analyze several currency pa
FREE
The product helps to find the highest peak and the lowest low. Help investors optimize profits. With a win rate of up to 80%. You do not need to adjust any parameters. We have optimized the best product. Your job just need to see and trade. Products with technological breakthroughs. Contact other products: https://www.mql5.com/en/users/hncnguyen/news.
FREE

Этот индикатор позволяет манипулировать видимостью графика в режиме реального времени. Правая сторона скрывается от пользователя. Виртуальная таймлайн может быть передвинута в любое место на графике. Также индикатор работает на закрытом рынке. Если вы используете визуальный анализ для торговли, то этот индикатор отличный инструмент для тестирования вашей стратегии. Он позволит не подглядывать в историю и быть честным перед собой в анализе.
Успехов!
FREE
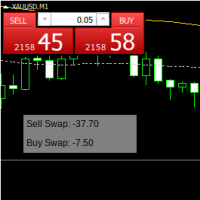
showSwap простой индикатор. показывает накопленный SWAP открытых ордеров и информацию об актуальном SWAP на рынке
можно указать магик ордеров, если 0, то все оредар. а так же координаты панели индикатора на графике, цвет фона и текста
В торговле на Форексе свопы могут быть как положительными, так и отрицательными в зависимости от разницы процентных ставок между двумя валютами, участвующими в торговле. Трейдеры могут либо получать, либо платить свопы в зависимости от того, удерживают ли они
FREE

Данный индикатор включает в себя различные виды скользящих средних. Индикатор содержит в себе следующий набор скользящих средних: CA (Кумулятивная скользящая средняя) MIN (Минимум за период) MAX (Максимум за период) SMA (Простая скользящая средняя) EMA (Экспоненциальные скользящее среднее) DMA (Двойное (двукратное) экспоненциальное скользящее среднее) TMA (Тройное (трёхкратное) экспоненциальное скользящее среднее) LWMA (Взвешенное скользящее среднее) SMM (Простая скользящая медиана) SMMA (Сглаже
FREE

Spin is an intrinsic form of angular momentum carried by elementary particles, composite particles (hadrons), and atomic nuclei.
Spin is one of two types of angular momentum in quantum mechanics, the other being orbital angular momentum. The orbital angular momentum operator is the quantum-mechanical counterpart to the classical angular momentum of orbital revolution and appears when there is periodic structure to its wavefunction as the angle varies.For photons, spin is the quantum-mechanica
FREE

Investment Castle Volatility Index has the following features: 1. This indicator shows the volumes of the current symbol and the market volatility. 2. This indicator is built-in in the Investment Castle EA which works as volatility index for the EA dynamic distance and opposite start. 3. Parameters available for optimization for each pairs. 4. Works with any chart.
FREE
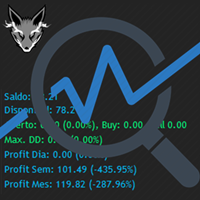
Track your overall trades! Monitor New Fox is an excellent indicator, which displays your current profits, being them monthly, weekly, and daily, that is, all profits obtained when you opened the mt4. Our brand new Monitor New Fox indicator is able to unlock all advanced features of MetaTrader 4. This indicator can graph with simple data key meta trader account data (Balance, Equity, Free Margin, Current Profit/Loss, Profit/Loss total, amount of open position(s) and size, etc.) and all this in a
FREE

This indicator draws on the chart high and low prices of different periods . And If you want, Indicator can alert you when the current price arrive these levels. Alert Options: Send Mobil Message, Send E-mail, Show Message, Sound Alert Time Periods: M1, M5, M15, M30, H1, H4, D1, W1, MN Inputs: TimeShift: You can set start hour for calculating. And that way you can see levels independently from broker server's time-zone. PipDeviation: You can set price sensibility for alert (Default: 3) Lines
FREE

Session Average Date Range: Analyze and average the low - high of specific trading sessions within custom date ranges, offering insights into price movements and market behavior over selected periods. The "Session Average Date Range" tool is an advanced analytical utility designed to empower traders and analysts by allowing them to dissect and evaluate the high and low range of specific trading sessions within a user-defined date range. This tool provides a flexible and precise approach to analy
FREE
RaysFX Trade Info Ciao a tutti, sono entusiasta di presentarvi il nostro ultimo indicatore, RaysFX Trade Info . Questo strumento è stato progettato per fornire informazioni dettagliate sulle vostre operazioni di trading direttamente sul vostro grafico MT4. Caratteristiche principali Informazioni in tempo reale : RaysFX Trade Info fornisce informazioni in tempo reale sulle vostre operazioni aperte e chiuse. Potete vedere il profitto in punti, in valuta e in percentuale. Personalizzabile : L’in
FREE

Индикатор запаса хода, означает среднестатистическое дневное движение цены. Для удобства визуально отображается на графиках, но с таймфреймом H4 и ниже. Индикатор перерисовывается ежедневно и учитывает гэпы. Дополнительная пунктирная линия означает 80% пройденного дневного движения. Важный инструмент в арсенале профессионального трейдера или того, кто хочет им стать. PrimeTools - это серия продуктов предназначенных для правильной и профессиональной торговли. [ PrimeTools Levels | PrimeTools Rang
FREE

Индикатор анализирует все символы из окна "Обзор рынка" и выбирает подходящие для торговли. В работе использутся пять наиболее эффективных и популярных индикаторов: Скользящая средняя ADX RSI Parabolic SAR MACD Для анализа рассчитываются два бара. Для работы достаточно запустить индикатор на одном графике. После запуска на графике отображаются блоки с данными по каждому из символов. Если блок окрашивается в коралловый или синий цвет, это указывает на изменение тренда, достаточное для совершения
FREE

Индикатор выводит информацию о: названии валютной пары и таймфрейме. текущей цене bid. времени до закрытия свечи. текущей разницы между ask и bid (спред). Также в индикаторе можно включить опцию вывода статистической информации по торговому обороту.
Показывает Имя, номер счета и валюту счета. Депозит в валюте счета. Баланс на текущее время и процент от баланса. Текущую прибыль и ее процент. Текущие сделки и процент от общего депозита. Прибыль/убыток по сделкам и процент от депозита. Индикатор
FREE

FRB Time - FRB Trader
Indicator that shows the server's time of operation. You can edit the font color and size of the timetable.
Settings font color Font size Background color
To move the Timetable, just click on it and move the mouse to where you want to leave it. After placing the Time where you want it, click again or press "ESC" and the time will stay where you left it.
FREE
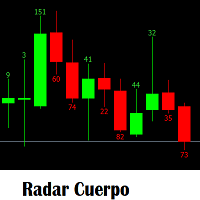
Indicador que sirve mirar el tamaño de velas segun el tamaño te genere alerta para hacer entradas manuales. Aprovechenlo al maximo que una plantea estrategia a vaces del tamñao de la vela anterior o de la misma vela actual. para entran a comprar y vender. Es un indicador que es necesario para cualquier analisis que se tome para una entrada nueva. Sera su herramienta preferida.
FREE
Indicador Gratuito desarrollado por Mr Beast Inversiones Mr Beast : Gestión de riesgo profesional. Brindo a la comunidad la entrada a productos de M Beast. Echar un vistazo a mis señales y expert advisors. Descuentos de hasta 70% Diclaimer: La negociación en Forex, CFD y Opciones conlleva un riesgo de pérdida sustancial y no es adecuada para todos los inversores. El alto grado de apalancamiento puede actuar en su contra y también en su favor, Antes de decidirse a operar en productos tan apalanca
FREE

Trend Panel Limited is an indicator that allows you to know the trend of a pair in a given timeframe using 2 moving averages. You can modify the period of the moving averages. Allows you to select which pairs you want to monitor in the input parameters. You also decide in what time period you want to follow up. In short, TrendPanel gives you the possibility of knowing the trend of a pair in a certain period of time without having to change the chart. Version limitations: You can only select 2 pa
FREE

MP Relative Bandwidth Filter (RBF) is created to be used to identify your trading zones based on volatility. This easy to use technical indicator attempts to compare between Bandwidth of higher length and ATR of lower length to identify the areas of low and high volatility: Relative Bandwidth = Bandwidth / ATR The Bandwidth is based on Bollinger Band which its length ideally needs to be higher and ATR length needs to be ideally lower. After calculating Relative Bandwidth, the Bollinger Band is
FREE

Relative Strength Index Cross [RSI Cross] A combination of 2 RSI to create a crossover trading setup Input parameters: signal mode: set it to true if you want to plug it into STAT (Signal Tester and Trader) arrow shift: distance between fast EMA line to arrow on chart price line filter fast RSI period slow RSI period RSI price method price upper level price lower level You can find the best setting for 4 hour EURUSD on this video
FREE

The End Point indicator is an indicator that predicts that the tired trend should now return. In this indicator law, we can easily understand that the trend which is in constant or continuous decline should now be reversed. to With these signals the user starts the trades.
Our Popular Products Super Oscillator HC Cross Signal Super Cross Trend Strong Trend Super Signal Suggestions Recommended time interval: M30, H1 Run with at least 20 pairs. Operate with a maximum of two pairs. For every coup
FREE

This indicator smoothes the value of CCI (Commodity Channel Index) and reduces its volatility. By using this indicator, the fluctuations created by the CCI indicator are reduced. The smoothed CCI value is placed in a buffer that you can use in your EA and strategy. Leave me a comment if you want By using this indicator, you no longer need to use the Moving Average indicator on the CCI indicator.
FREE

RaysFX Market Trend Histogram Il RaysFX Market Trend Histogram è un indicatore personalizzato per la piattaforma di trading MetaTrader 4. Utilizza il Commodity Channel Index (CCI) per identificare le tendenze del mercato e visualizza queste informazioni in un istogramma intuitivo. Caratteristiche principali: Identificazione delle tendenze: L’indicatore calcola il CCI per ogni periodo di tempo e lo utilizza per determinare se il mercato è in una tendenza al rialzo o al ribasso. Visualizzazione in
FREE
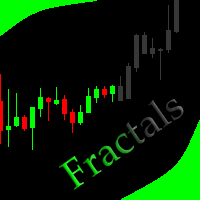
This indicator allows to hide Bill Williams Fractals (on all MT4 timeframes) from a date define by the user with a vertical line (Alone) or a panel (with "Hidden Candles"). Indicator Inputs: Indicator Color Indicator Width Information on "Fractals" indicator is available here: https://www.metatrader4.com/en/trading-platform/help/analytics/tech_indicators/fractals ************************************************************* Hey traders!! Give me your feeds! We are a community here and we hav
FREE

Индикатор вертикальных уровней работающий на таймфреймах М5 и М1. Разлиновывает период текущего дня и дня прошедшего. Данный индикатор наглядно покажет трейдеру, начало и конец часа текущего, также прошедших часовых периодов, тридцати минут и пятиминутных интервалов графика. Преимущество работы с данным индикатором в том, что трейдер, добавив индикатор на график валютной пары с включенным младшим таймфреймом, всегда будет в курсе того, где начнётся новый час.
О понятии времени и таймфрейм
Вс
FREE

Классический индикатор с расширенными возможностями для более точного отображения ситуации на рынке. Полностью доступны все настройки скользящих средних, такие как тип средней и цены по которым она строится. Также имеется возможность изменить вид отображения индикатора - линия или гистограмма. Благодаря дополнительным параметрам появилась возможность более тонкой настройки.
Отличительные особенности Не перерисовывается; Дополнительные параметры для точной настройки; Отображение в виде линии ил
FREE

Представляю эффективный инструмент определения разворота на таймфрейме H4. Сам индикатор устанавливается на график М30. Все параметры уже установлены. Правильное использование индикатора: К сожалению проверка в тестере не даст правильное представление об индикаторе, поэтому аренда на один месяц максимально доступна. Не нужно устанавливать файл на удалённый сервер. Установите его в терминал на локальном ком
FREE
MetaTrader Маркет - уникальная площадка по продаже роботов и технических индикаторов, не имеющая аналогов.
Памятка пользователя MQL5.community расскажет вам и о других возможностях, доступных трейдерам только у нас: копирование торговых сигналов, заказ программ для фрилансеров, автоматические расчеты через платежную систему, аренда вычислительных мощностей в MQL5 Cloud Network.
Вы упускаете торговые возможности:
- Бесплатные приложения для трейдинга
- 8 000+ сигналов для копирования
- Экономические новости для анализа финансовых рынков
Регистрация
Вход
Если у вас нет учетной записи, зарегистрируйтесь
Для авторизации и пользования сайтом MQL5.com необходимо разрешить использование файлов Сookie.
Пожалуйста, включите в вашем браузере данную настройку, иначе вы не сможете авторизоваться.