Guarda i video tutorial del Market su YouTube
Come acquistare un Robot di Trading o un indicatore
Esegui il tuo EA
hosting virtuale
hosting virtuale
Prova un indicatore/robot di trading prima di acquistarlo
Vuoi guadagnare nel Market?
Come presentare un prodotto per venderlo con successo
Indicatori tecnici gratuiti per MetaTrader 4 - 25

Trend Rising is a custom MT4 ( Metatrader 4 ) indicator, use best for scalping on TF M30 and below that analyzes the trend and momentum pattern using Bill William Indicators on multiple timeframes. As the result, It identifies the beginning and the end of the trend that works for most currency pairs. The Trend Rising indicator is developed based on Accelerator Oscillator and Awesome Indicator. Key Features Identify the beginning and the end of the trend as display with colors. Identify eas
FREE

1. Monthly, weekly and daily pivots are calculated with the beginning and ending data for each period. 2. This provides an easy line on the chart to identify where the pivots are and reduces error of calculation. 3. The indicator will help define very quickly the major pivots for the instrument even if you do not understand how to calculate the pivot. 4. You can also compare weekly and daily pivots so that you can better understand the position of price. 5 This indicator will help you trade more
FREE

Highly configurable Fisher Transform indicator.
Features: Highly customizable alert functions (at levels, crosses, direction changes via email, push, sound, popup) Multi timeframe ability Color customization (at levels, crosses, direction changes) Linear interpolation and histogram mode options Works on strategy tester in multi timeframe mode (at weekend without ticks also) Adjustable Levels Parameters:
Fisher Transform Timeframe: You can set the lower/higher timeframes for Stochastic. Fisher
FREE

Titolo del prodotto Smart RSI (MT4) – parte della serie SmartView Indicators Descrizione breve Indicatore RSI con un'esperienza utente unica sulla piattaforma MetaTrader. Offre capacità avanzate non disponibili in precedenza, come aprire le impostazioni con doppio clic, nascondere e mostrare gli indicatori senza eliminarli, e visualizzare la finestra dell'indicatore a dimensione intera del grafico. Progettato per funzionare perfettamente con il resto della serie SmartView Indicators. Panoramica
FREE

For all those traders interested or currently trading Ichimoku, you will not want to miss this article. Although I am heading out in a few hours with my girlfriend to Harbin Hot Springs, I wanted to write a brief introduction to Ichimoku Number Theory as there has been a lot of questions (and confusion) about Ichimoku settings, time frames, etc. The basis of Ichimoku as known to most is the 5 lines; Tenkan Line Kijun Line Senkou Span A (part of the Kumo) Senkou Span B (other part of the Kum
FREE
Indicatore Accumulation/Distribution (AD) con supporto multi-timeframe, segnali visivi personalizzabili e sistema di allerta configurabile.
Cos'è l'AD? L'indicatore Accumulation/Distribution (AD), sviluppato da Marc Chaikin, è un indicatore basato sul volume progettato per misurare il flusso cumulativo di denaro in entrata e in uscita da un titolo. Mette in relazione i cambiamenti di prezzo e volume, aiutando a identificare la forza dietro i movimenti di prezzo e le potenziali divergenze. La l
FREE

What is a tool ? This indicator use for comparison of 8 major currency from 28 pairs and multiple timeframes and calculates a score of strength from 0-100. How to use Place the indicator on any pair any timeframe, And entering only the value of X Y position to be displayed in the graph. Pair : Any Timeframe : Any Input Parameter Start X Position : Value of X on chart Start Y Position : Value of Y on chart Visit my products Target Profit Magic Target Profit All The Profit Tracker Currency
FREE

A flexible 2-Line MACD indicator The default MACD indicator inside MT4, limits you to using the MACD with a fast-EMA, slow-EMA, and signal-SMA. This MACD indicator allows you to set your own MA-Method choices for these 3 components, separately! You can select from SMA-EMA-SMMA-LWMA, and can even use a separate method for each 3 fast-slow-signal periods. A more featured version is available with colored candles+conditions, full alerts+conditions, line coloring, DEMA and TEMA options; MACD MAX
Fe
FREE

The indicator displays the size of the spread for the current instrument on the chart. Very flexible in settings. It is possible to set the maximum value of the spread, upon exceeding which, the color of the spread label will change, and a signal will sound (if enabled in the settings). The indicator will be very convenient for people who trade on the news. You will never enter a trade with a large spread, as the indicator will notify you of this both visually and soundly. Input parameters: Aler
FREE
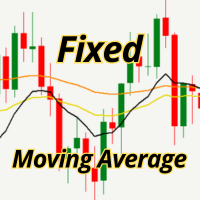
Display any moving average in its original timeframe, regardless of the chart’s timeframe.
What does it do?
This indicator allows you to view a moving average from any timeframe (M5, H1, H4, D1, etc.) directly on your current chart, preserving its original values from the timeframe you selected.
Practical example:
You are trading on the M5 timeframe.
You activate the H1 MA with this indicator.
You see exactly the same line you would see if you switched to H1.
Without changing the timeframe
Chara
FREE

Hello all. This indicator helps you to open a trade, when break out occurred, also you can add to your position and ride it if trend continued. I use it on 1-5 min chart, as you can use short stop loss. Also profit target should be small as well. It is better to enter few small position, so you can book some profit early and ride the rest for bigger gains. Look at the past to have a plan. Enjoy.
FREE

WindFlow HTF is a useful tool suited to use in conjunction together with my WindFlow indicator. This indicator will give you a background vision about the price action trend on a higher timeframe, so when it runs with the WindFlow indicator you have an almost complete trading solution. At this point, you only need some support/resistance analysis and a bit of focus to become a consistent trader.
The metaphorical "wind's ballet" Professional traders know that every timeframe is governed by its o
FREE
FTU Idioteca L'indicatore è per la piattaforma MT4, può essere utilizzato da solo ma meglio combinato con altri indicatori o strategie Combina vari indicatori come macd, adx per disegnare una freccia per suggerire l'ingresso o il cambio di tendenza Guarda un breve video introduttivo su YouTube: https://youtu.be/lCRJ3mFNyOQ Caratteristiche dell'indicatore: Vendi e acquista frecce Avviso visivo e sonoro Continuazione del trend/Segnale di cambiamento anticipato del trend Nuove caratteristiche: Lim
FREE

Fibonacci SR Indicator
This indicator creates support and resistance lines. This indicator is based on Fibonacci Retracement and Extension levels. It will consider many combinations of the Fibonacci levels and draw support/resistance lines based on these. This indicator uses tops and bottoms drawn by the ZigZag indicator in its calculations. The ZigZag can also be drawn on the chart, if necessary. The indicator considers many combinations of past reversal points and Fibonacci ratio levels, and w
FREE

FusionAlert StochRSI Master is an indicator available for MT4/MT5 platforms, it is a combination of RSI & Stochastic indicator which provide "alerts" when the market is inside "overbought and oversold" regions combined for both indicators, results in more precise and accurate signals to be used as a wonderful tool, in the form of "buy or sell" signals. This indicator comes with many customization options mentioned in the parameter section below, user can customise these parameters as needful. Jo
FREE

Gratis solo fino alla fine della settimana Il seguente indicatore deve essere utilizzato e contestualizzato secondo le vostre metodologie di trading. Offre ottimi spunti operativi e individua zone di repulsione sulle linee tracciate. È possibile personalizzare diversi parametri. L'indicatore traccerà tre livelli sopra e sotto il prezzo di apertura su D1, W1 e MN1. Fornirà l'ADR giornaliero e mostrerà altre due sessioni giornaliere (fascia EUROPA e fascia USA). Si possono modificare i colori del
FREE
This indicator collects and organizes spread data. It is an organic add-on to my news robot, ExpertNews , which can be downloaded here .
You can also watch a video about news trading using the ExpertNews robot. It is available on youtube .
Unfortunately, it is not possible to place the robot in the mql5.com store, because the automatic validation of ExpertNews by the mql5 service ends in failure. In reality, there are no errors in the robot.
Testing fails due to the fact that the advisor is
FREE

This indicator filters the Zigzag indicator to calculate the main support and resistance
levels.
Variables
minimum gap between peaks : is the distance (GAP) between the peaks of
the Zigzag
peaks sensitivity : Minimum number of nearby peaks
look back: it means that it has to test the last 50 peaks in the Zigzag
object name perfix: a prefix for level’s line name on chart
FREE

Latest Changes in 1.6 : Added Signal Modes input. Mode 1 : HPF positive go long blue, HPF negative go short red. Mode 2 : slow envelope only, HPF above upper envelope go long blue, HPF below lower envelope go short red. Mode 3 : HPF above both upper envelopes - go long blue, HPF below both lower envelopes go short red. Mode 4 : Go long blue if HPF crosses above upper slow, but fast upper should be below slow upper at the time, exit when HPF crosses below upper fast, reverse logic for short red
FREE
Candlestick Mod rapat.
Chart Candlesticks will stick together. make it look neat and tidy Switch between Candlestick and Line chart fixed. Instruction.
If you don't like the candles colors, you can do so by changing color. read below:
-Colors must be changed in the indicator setting.
-It won't change through the Chart properties to modify.
-After changing the color, save it as template so it wont change the colors to default value.
FREE

Dopo 7 anni, ho deciso di rilasciare alcuni dei miei indicatori e EA gratuitamente.
Se li trovate utili, per favore Mostrate il vostro supporto con una valutazione a 5 stelle! Il vostro feedback mantiene in arrivo gli strumenti gratuiti! Vedi anche gli altri miei strumenti gratuiti qui
_________________________________ Indice di Intensità Intraday (III) per un'Analisi Forex Accurata L'Indice di Intensità Intraday, sviluppato con cura in MQL4, è uno strumento all'avanguardia pr
FREE

The Investment Castle Chances indicator will show signals on the chart for entering a buy or sell trade. There are 2 types of signals for each direction as follows: Buy / Sell (Orange colored candlesticks) Strong Buy (Green colored candlesticks) / Strong Sell (Red colored candlesticks) You may place a buy trade once you see the Buy arrow or vise versa, or you might prefer to wait for a further confirmation “Strong Buy” / “Strong Sell”. This indicator works best with the high time frames H1, H
FREE
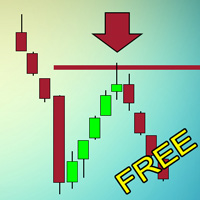
Индикатор, который ищет качественные точки входа в рынок и отображает их в виде стрелок. Действует по сложному алгоритму. Сначала ищет на графике специальные уровни, которые обязательно должны быть пробиты импульсом. Если цена возвращается к этому уровню в виде свечи с длинной тенью и маленьким телом и касается уровня только тенью - возникает точка входа. Не перерисовывается! Лучше всего выглядит и отрабатывает на Н1.
Может использоваться как: Индикатор уровней, где цена будет останавливат
FREE

Candle Time At Price — Precision Countdown Directly Beside the Candle Candle Time At Price is a lightweight, smart, and visually elegant indicator that displays the remaining time of the current candle right next to price — exactly where your eyes are focused. It’s designed for traders who value clean charting, precision, and zero distractions. Key Features: Real-Time Countdown — Displays the exact time left before the current candle closes. Price-Anchored Display — The timer moves wi
FREE
The RSI S-RoC indicator differs from the standard RSI in that it takes into account the price rate of change when calculating values. When the price moves in a trend, the indicator produces good entry signals oncethe price touches its levels. The level values can be configured in the indicator settings. They can also be modified and adjusted directly in the indicator window. You can also set on a chart signal lines. Once they are crossed, the indicator will produce a sound alert or play a user
FREE
The indicator based on (Williams` Percent Range) analyzes the signal line touches along the channel walls and forms zones for deciding on the direction of the price movement. For convenience, an alert function is built in. You can also enable and disable the desired zones. Several indicators with different settings can be used on one chart. This will help you choose the best strategy.
FREE

Harami is a two candle pattern with recent candle formed inside the previous candle's high and low . It represents indecision in the market and is used for breakout price action trading strategy. This indi fires all signals to a dashboard on the chart including pop_up alert, push to phone notification and email. Harami has two types, bullish and bearish pattern. Enter long for bullish Harami and enter short for bearish Harami. Inputs : Currency Symbols: EURUSD,GBPJPY,USDJPY,USDCAD (default) , u
FREE
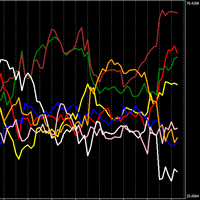
Indicatore Potente che mostra la forza della singola valuta. Piu è in alto, più è forte la valuta, viceversa, più è in basso, più è debole. Strategia di Trading N1: Aprire posizione sugli incroci delle linee, se una incrocia verso l'alto e l'altra verso il basso, aprire la posizione sulla valuta che va verso l'alto. Strategia di Trading N2: Aprire posizione comprando la valuta più forte e vendere la valuta più debole. Nelle impostazioni, è possibile cambiare il time frame, io uso quello di defau
FREE
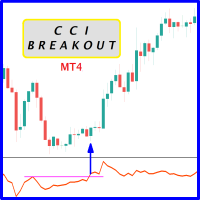
Probability emerges to record higher prices when CCi oscillator breaks out oscillator historical resistance level when exhibit overbought values. Since, oscillator breakout of support and resistance have similar effect as price breaks support and resistance levels, therefore, its highly advised to confirm price breakout with oscillator breakout; certainly, will have the same output in short trades. Concept is based on find swing levels which based on number of bars by each side of peak or trough
FREE
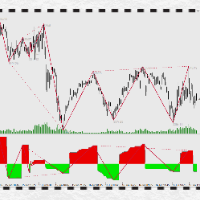
万能背驰指标简介(DivergenceLines) 注意注意,这个指标不能单独运作,对以下两个指标有依赖,请确保先获得以下两个指标后才购买本指标! 1) 动力之梯(PowerTrapezoid) (力度评估副图指标,本指标) 2) 万能分段(LinesSegment) (线段划分主图指标) 。 3)万能背驰(DivergenceLines,本指标) (比较力度背离主图指标)。 指标原理: 通过获取动力之梯指标的筹码堆积值,依照万能分段指标为依据,对同向线段向前回朔,进行一一对比,当后面线段力度比前面力度小时,定义为背驰(背离),背驰的两个高点(或两个低点)之间可以连接一条背驰线,当某个高点(或低点)连接的背驰线越多,这个点就构成了多个单级别背驰区间套。
FREE

The Awesome Oscillator (AO) Signal Candle Indicator is an indicator used to measure market momentum. Awesome Oscillator (AO) Signal Candle Indicator will change bar's color when set overbought or oversold levels reach. Colored Candles, based on Awesome Oscillator (AO) Signal.
-If the indicator is above zero, the market is bullish. -If the indicator is below zero, the market is bearish. -If the market is bullish, you can take a stand with green candle signals. -If the market is bearish,
FREE

High-Precision Volatility Notifier V1.10 Developed by: Grazia-system-com Title: Stop Chasing Volatility: Get Notified Only When the Real Breakout Starts. The professional, noise-filtered tool that transforms your MT4/MT5 into a smart, proactive monitoring system. Never miss an institutional-level move again. Why This Detector Is Different (Dual-Layered, Noise-Filtered Intelligence) Most volatility tools use fixed thresholds that fail in dynamic markets. Our Notifier eliminates false signals
FREE

Trend indicator Trend Esay MTF is an indicator that draws arrows directly on the price chart. Like every trend indicator, it works well with good price movement and worse in a flat. A feature of this indicator is the ability to send alerts both in the terminal and on a smartphone. The indicator menu contains the number of bars in the history of the indicator and period value for determining the trend. The "trend" function has been added to the indicator menu, which filters the indicator signals
FREE

Piccolo indicatore gratuito per rilevare determinati schemi grafici, spalla testa spalla/rovescio, triplo alto/basso, coppa, bandiere e altro... L'ho progettato tempo fa, rileva le figure in m1, m5, m15, m30 e h1.
Spero vi sia utile perchè non scambio molto con questo indicatore, ne ho pochi altri che cercherò di mettere online velocemente forse lo troverete utile, buoni amici di scambio.
FREE

Introduction This Indicator Is Based On Average Price/Maximum Price Moves, And Using Moving Bollinger Bands And Moving Averages.
The Advantage Of Using It With YOUR own Analysis Will Confirm Potential Supports And Resistances While it Compliments With Your Analysis
The Indicator Is Non-Repainting
AND Along With Our Special Trend METRE that Changes With The Conditions OF A Bullish Or Bearish Trend....
Recommend Time-Frames: H1 H4 M15
Usage: The Indicator Is Very Profitable If Use
FREE

Индикатор отображает различными цветами на фоне графика три торговые сессии. Открытие - закрытие Лондон, Нью Йорк, Токио по умолчанию. Применение Для успешной торговли важно знать начало и конец торговых сессий с наибольшей ликвидностью, так как именно в это время цена делает самые большие движения.
Особенности Настройки по умолчанию - торговые сессии по Лондону, Нью Йорку, Токио. Возможность выставить свои рамки тоговых сессий Алерт при открытии сессии Показ открытия дня по GMT Настройки для
FREE
Binary Options Assistant (BOA) BURN Signals Indicator provides signals based on Ana Trader Binary Options Strategy. Indicators: MACD & Stochastic
Stop missing trades, stop jumping from chart to chart looking for trade set-ups and get all the signals on 1 chart! U se any of the BOA Signals Indicator with the Binary Options Assistant (BOA) Multi Currency Dashboard .
All BOA Signal Indicator settings are adjustable to give you more strategy combinations. The signals can be seen visually and
FREE

This scanner shows the trend values based on crossovers of two moving averages for up to 30 instruments and 8 time frames. You can get alerts via MT4, Email and Push-Notification as soon as the direction of the trend changes. This is the FREE version of the indicator: https://www.mql5.com/en/market/product/29159
Important Information How you can maximize the potential of the scanner, please read here: www.mql5.com/en/blogs/post/718074
You have many possibilities to use the scanner. Here are tw
FREE
FastTMALine_mth_PRT is non-redrawn channel indicator and can be used to identify trend and support and resistance levels.
Indicator settings allow you to assign a specific coefficient to each price channel, which makes it possible to narrow or expand each channel separately. The FastTMALine_mth_PRT indicator is a multicurrency instrument, so the choice of a timeframe depends solely on the trader’s preference. FastTMALine_mth_PRT indicator can be used on any time frame, so you can eas
FREE

Fibonacci retracement is really one of the most reliable technical analysis tools used by traders. The main problem with using these levels in trading is that you need to wait until the end of the impulse movement to calculate the retracement levels, making difficult to take a position for limited retracement (0.236 or 0.382). Fibo Dynamic solves this problem. Once the impulse movement is identified the retracement levels are automatically updated allowing very dynamic trading in trends with onl
FREE
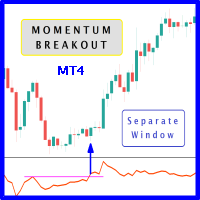
When prices breakout resistance levels are combined with momentum oscillator breaks out its historical resistance levels then probability emerges to record farther prices. It's strongly encouraged to confirm price breakout with oscillator breakout since they have comparable effects to price breaking support and resistance levels; certainly short trades will have the same perception. Concept is based on find swing levels which based on number of bars by each side to confirm peak or trough and in
FREE

This powerful tool helps you to easily access Fibonacci tools at different times and in different markets. This tool has the ability to send signals based on Fibonacci as well as setting alarms to be aware of broken Fibonacci levels. Among the capabilities of this tool are the following:
Identifies market trends Fibonacci auto design If Fibonacci levels are broken, it sends a message Send Fibonacci signal
Manuals: After selecting the target market, run the tool In the input settings according
FREE

The Spots Indicator can be used for Entering and Exiting your trades based on the common candlestick patterns such as: engulfing, hanging man, doji etc. It is designed to publish desktop and mobile notification every time a signal is triggered. However, it is worth noting that this indicator is recommended to be used with other indicator for confirming the entries. It is best to use it with the Investment Castle Trend Lines indicator and the Supply and Demand indicator
FREE

Ho creato questo semplice indicatore mentre stavo imparando a conoscere TheStrat di Rob Smith e l'ho trovato così utile, ho pensato di condividerlo con te. Se lo trovi utile, guarda gli altri indicatori che ho pubblicato su MQL5. L'indicatore disegna semplicemente una singola linea sul grafico che mostra il livello di prezzo selezionato da un periodo di tempo più elevato. Usando le impostazioni hai il pieno controllo sull'intervallo di tempo visualizzato ma, per impostazione predefinita, calco
FREE
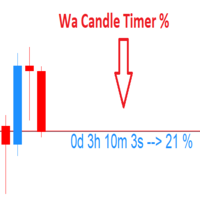
Wa Candle Timer Percentage MT4 is an indicator which shows the user how much time is remaining until the next candle will form. The percentage of the evolution of the current candle is also displayed. The user can set the percentage that the candle timer will change the color. These are the settings: 1- The percentage that the candle timer will change the color. 2- Color of Candle Timer when it's BELOW the percentage set by the user. 3- Color of Candle Timer when it's ABOVE the percentage set b
FREE

The tool that will help you calculate the lot accurately for the risk you need, if you want to risk 1% of your account, just enter the entry, target and stop values and you will have the lot size to use and only lose the chosen percentage. You can also choose a fixed value. This tool will help you with consistency, because you can only be consistent if you operate consistently and enter with fixed loss values, it is an INFALLIBLE way to be consistent!!!!
FREE
Its primary motive is to overlay horizontal lines spaced according to multiples of the Average True Range (ATR), centered on a reference price from defined periods such as trading sessions, candlestick counts, or 12-hour intervals. This facilitates the identification of potential support and resistance levels or expected price ranges. Additionally, it marks major forex trading sessions (Sydney, Tokyo, London, and New York) with arrows to provide contextual awareness of market hours, enhancing d
FREE

Time to Trade Trading timing indicator is based on market volatility through 2 ATR indicators to determine the timing of a transaction. The indicator determines the times when the market has strong volatility in trend. When histogram is greater than 0 (blue) is a strong market, when histogram is less than 0 (yellow) is a weak market. Should only trade within histograms greater than 0. Based on the histogram chart, the first histogram value is greater than 0 and the second histogram appears, this
FREE

万能线段划分指标简介: 万能线段划分是依照两根相互缠绕的均线,依金死叉为标准,将金死叉两边的高低点进行连接开成线段划分。本指标可以设定不同参数多级别叠加使用。 万能分段的原理: 在任意一组均线组成的均线系统中,均线之间的相互缠绕,形成的金死叉是有位次关系的。这点,作者在这里算是首次对外公开这个秘密。上图的均线系统中,走势处于一个较大级别的振荡行情中,均线之间相互缠绕比较频繁,金死叉的数量较多,所以,情况比较复杂。 我们知道,均线可按其周期大小进行位次排序。上图均线依照周期从小到大排序为:MA10,MA30,MA60,MA144,MA233,依照这组均线的位次关系,将每相邻两根均线金死叉做上标注。如:MA10&MA30金死叉标注为“1”,MA30&MA60金死叉标注为“2”,MA60&MA144金死叉标注为“3”,MA144&MA233金死叉标注为“4”。我们将两相邻均线金死叉完全标注完毕后,发现图上还有部份金死叉并未被标注到,这些未被标注到的金死叉全部是非相邻均线之间发生的金死叉。我们依照以上方法,可以识别出均线组之间金死叉的级别位次关系。市场行情的发展是依照此级别位次关系,从小到大
FREE
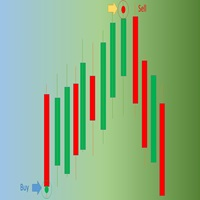
Wave_Entry_Alerts_In_EUR.mq4 is a custom indicator developed by Azad Gorgis for MetaTrader 4. This indicator is designed to provide alerts based on ZigZag patterns, specifically tailored for trading on the (EUR/USD) symbol.
Key Features: - Chart Window Indicator: The indicator is designed to be displayed on the main chart window. - Arrow Signals: The indicator generates arrow signals on the chart, indicating potential reversal points based on ZigZag patterns. - Customizable Parameters: Traders
FREE

SPREADEX e' un indicatore per MT4 e MT5 che indica la distanza dell'ASSET dal GP. il GP e' il prezzo del vero valore dell'ASSET sottostante ottenuto per stima. Il GP e' come una calamita, attira il prezzo dell'ASSET con alta probabilita' ed all'interno della stessa giornata di trading. Quindi SPREADEX indica quali sono gli asset piu distanti dal GP al momento in tempo reale. Fornendo un punto di vista al TRADER su quali asset concentrarsi e cercare eventuali segnali di inversione dei prezzi per
FREE
O indicador com alertas do Setup de Larry Williams que conseguiu fazer U$ 10.000 virar U$ 1.100,00 em um campeonato de Trade em 1987 e comprovou fazendo a filha, que é atriz, fazer o mesmo estrago no mercado! A média de 9 para cima é compra, para baixo é venda, simples assim! Com alertas de sons e visual de compra, venda e flat, você se mantendo posicionado até a o alerta inverso a sua posição. Aconselhável usar de H1 para cima.
FREE

This is a multi time frame demand and supply indicator for MT4 platform. You can use multi time frame demand and supply levels on smaller time frames. Additionally you can choose to kill every level has has been tested. you have narrow bands that is you can select the whole demand and supply level or just a narrow section Finally, you also get price range for the zones. Awesome
FREE

Aroon and Moving Average A combination of Supertrend and Moving Average to create a converging trade setup Input parameters: signal mode: set it to true if you want to plug it into STAT (Signal Tester and Trader) arrow shift: distance between fast EMA line to arrow on chart turn on price line filter turn on moving average signal for converging setup aroon period MA period MA averaging method MA pricing method upper level limit (Aroon) lower level limit (A roon ) You can find the best setting
FREE
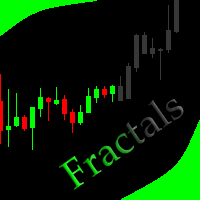
This indicator allows to hide Bill Williams Fractals (on all MT4 timeframes) from a date define by the user with a vertical line (Alone) or a panel (with "Hidden Candles"). Indicator Inputs: Indicator Color Indicator Width Information on "Fractals" indicator is available here: https://www.metatrader4.com/en/trading-platform/help/analytics/tech_indicators/fractals ************************************************************* Hey traders!! Give me your feeds! We are a community here and we hav
FREE

It is a demo version of Advanced Arrow indicator It works only on GBPJPY but the full version works on all currency pairs.
Features Simply it gives you entry point ,SL line and 4 TP lines or less. Once SL-TP lines are shown with the arrow, they remains as they are until signal change. It is historical indicator. No Repaint.
Indicator parameters Indicator Version : choose V5 or V6. TP 1 Line color : TP1 color. TP 2 Line color : TP2 color. TP 3 Line color : TP3 color. TP 4 Line color : TP4 colo
FREE
How To Trade
Execute your trades in 3 Easy Steps!
Step 1: Trade Setup Entry Buy = If daily open market Above Line PIVOT or can Price has touched and closed the candle above Resistance1. Entry Sell = If daily open market Under Line PIVOT or can Price has touched and closed the candle above Support1. Step 2: Set Stop Loss Stop loss BUY ----> You can set stop loss on Line Pivot or Support1. Stop loss SELL ----> You can set stop loss on Line Pivot or Resistance1. Step 3: Set Take Profit Take profi
FREE
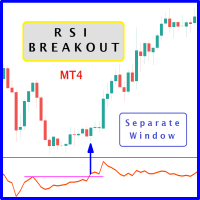
The likelihood of farther price movement increases when the Relative Strength Index oscillator "RSI" breaks through its historical resistance levels in conjunction with prices breakout of resistance levels. It's strongly encouraged to confirm price breakout with oscillator breakout since they have comparable effects to price breaking support and resistance levels; similar perception is applied to short trades. Concept is based on find swing levels which based on number of bars by each side to co
FREE
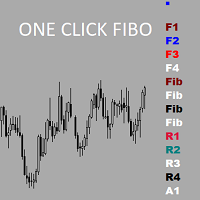
Утилита предназначена для упрощения графического анализа.Настроив один раз , можно сохранить в шаблон,все настройки сохранятся.В настройках меняются уровни фибоначчи , цвета,стили и толщина линий также текстовые метки на кнопках.Есть возможность расширить функционал , добавить временные зоны Фибоначчи ,Фибо арки ,линии по углу ,продление прямоугольных зон до текущей цены.Присылайте рекомендации,все можно осуществить в рамках бесплатной утилиты.
FREE

Trend Graf - это инструмент позволяющий видеть тренд текущего момента,имея стартовые диапозоны которые появляются каждые шесть часов ,способен давать нам уровень предела коррекции как по тренду так и на смену ему.Работает на всех валютных парах!В настройках мы имеем смещение для проекции стартового диапозона от текущей установки ,для каждой валютной пары можно подобрать то смещение, которое лучшим образом будет показывать предел коррекции.Следующее обновление будет включать сигнальные указатели!
FREE
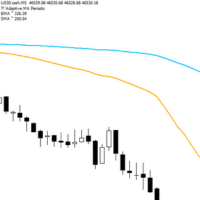
Adaptive Flow MAs is a moving average indicator designed to naturally adjust to market movements. Unlike traditional averages, it dynamically adapts its periods based on recent volatility and the current trend. The EMA closely follows rapid price swings to capture every impulse, while the SMA remains smoother, providing a stable and reliable reference. With a clean display showing the current adaptive periods, this tool helps traders feel the “flow” of the market without visual clutter. It’s cr
FREE

"Drivers Road Bands" indicator that is designed to be used in the 1H, 4H and 1D timeframes in the most ideal way. If we compare timeframes to roads and streets; main streets and highways with high traffic volume are similar to high-time timeframes in technical analysis. If you can interpret the curvilinear and linear lines drawn by this indicator on the graphic screen with your geometric perspective and develop your own buy and sell strategies; you may have the key to being a successful trader.
FREE

Multivaluta, indicatore multi-timeframe, che consente di vedere la tendenza basata sull'intersezione di 2 EMA senza clic aggiuntivi, cerca l'ultima intersezione su tutti i tempi contemporaneamente e scrive in alto a sinistra in quale direzione è diretta la tendenza della coppia di valute aperta, nonché da quanto tempo è stata l'ultima intersezione.
Sulla base di questo indicatore, è possibile aprire ordini se tutte le tendenze più sono dirette in 1 direzione e uscire dalle operazioni quando la
FREE

Les opportunités d'arbitrage triangulaire RedeeCash montrent les triades de devises disponibles et chaque configuration de position commerciale de devise en tant que variable globale, sous la forme de
AAA/BBB, CCC/AAA, CCC/BBB : AAA/BBB -1|0|1
AAA/BBB, CCC/AAA, CCC/BBB : CCC/AAA -1|0|1
AAA/BBB, CCC/AAA, CCC/BBB : CCC/BBB -1|0|1
où la valeur est la direction commerciale de OP_BUY ou OP_SELL. Si la direction du commerce indique -1, alors aucun commerce ne devrait avoir lieu pour cette paire d
FREE

This simple information indicator shows the name of the current day and past working days, months and years.
On the concept of time and timeframe It is common knowledge that a timeframe is a time interval considered in technical analysis of free financial markets, during which the price and other market data changes occur when the price charts are plotted. In the MetaTrader 4 trading terminal, these periods are separated by vertical dashed line, which can be enabled or disabled by simply pressi
FREE
Rectangle Control простой индикатор который отображает на графике панель для рисования прямоугольников с различными настройками, будет удобен тем кто рисует на графике зоны поддержки, сопротивления. Прямоугольник можно нарисовать с заливкой или без, различной толщины и цвета. А также выбрать таймфрейм на котором нарисованный прямоугольник будет отображаться. При нажатой кнопке алерт будет срабатывать оповещение (если прямоугольник находиться ниже цены на верхнем его краю, если прямоугольник нах
FREE

Questo indicatore ti consente di scoprire quanto il prezzo può passare sulla barra corrente. Cerca la media ATR per le precedenti 5 barre e disegna 2 limiti di prezzo. Puoi usarlo su qualsiasi periodo di tempo di qualsiasi strumento.
Sulla base di questo indicatore, è possibile impostare i livelli di stop loss e profitto, nonché utilizzarlo in altre buone strategie.
Non dimenticare di utilizzare la gestione del rischio durante il trading!
FREE

Investment Castle Support and Resistance Indicator has the following features: 1. Dictates the direction of Buy or Sell trades based on Support and Resistance Levels automatically . 2. Candles stick colors will change to Red for Sell and Blue for Buy (Default settings, user can change from the inputs). 3. This indicator is built-in the Support & Resistance based Investment Castle EA which works with Psychological Key Levels "Support & Resistance".
FREE

Titolo del prodotto Smart Bollinger Bands (MT4) – parte della serie SmartView Indicators Descrizione breve Indicatore Bollinger Bands con un'esperienza utente unica sulla piattaforma MetaTrader. Offre capacità avanzate non disponibili in precedenza, come aprire le impostazioni con doppio clic, nascondere e mostrare gli indicatori senza eliminarli, e visualizzare la finestra dell'indicatore a dimensione intera del grafico. Progettato per funzionare perfettamente con il resto della serie SmartView
FREE

Titolo del prodotto Smart ADX (MT4) – parte della serie SmartView Indicators Descrizione breve Indicatore ADX con un'esperienza utente unica sulla piattaforma MetaTrader. Offre capacità avanzate non disponibili in precedenza, come aprire le impostazioni con doppio clic, nascondere e mostrare gli indicatori senza eliminarli, e visualizzare la finestra dell'indicatore a dimensione intera del grafico. Progettato per funzionare perfettamente con il resto della serie SmartView Indicators. Panoramica
FREE
MetaTrader Market - i robot di trading e gli indicatori tecnici per trader sono disponibili nel tuo terminale di trading.
Il sistema di pagamento MQL5.community è disponibile per tutti gli utenti registrati sul sito MQL5.com che effettuano transazioni su MetaTrader Services. Puoi depositare e prelevare denaro usando WebMoney, PayPal o una carta di credito.
Ti stai perdendo delle opportunità di trading:
- App di trading gratuite
- Oltre 8.000 segnali per il copy trading
- Notizie economiche per esplorare i mercati finanziari
Registrazione
Accedi
Se non hai un account, registrati
Consenti l'uso dei cookie per accedere al sito MQL5.com.
Abilita le impostazioni necessarie nel browser, altrimenti non sarà possibile accedere.