 MetaTrader 5
 Эксперты
 Индикаторы
 Библиотеки
 Утилиты
 Виджеты
 Правила
Смотри обучающее видео по маркету на YouTube
Как купить торгового робота или индикатор
Запусти робота на
виртуальном хостинге
виртуальном хостинге
Протестируй индикатор/робота перед покупкой
Хочешь зарабатывать в Маркете?
Как подать продукт, чтобы его покупали
Бесплатные технические индикаторы для MetaTrader 4 - 39
 На основании сигналов технических индикаторов из списка ниже вы сможете принимать решения относительно открытия или закрытия сделки в платформе MetaTrader 4.
Работа индикаторов заключается в математическом преобразовании цены и/или объемов финансового инструмента для прогнозирования изменений цен.

The Toronto Stock Exchange Session's Hours
This indicator facilitates observing the currency pair's quotations during subsequent parts of the stock exchange session live. Before the session starts, a rectangle is drawn on the chart but not filled in with color. It means the extent of the session duration. Before the first bar enters the rectangle of the session, a sound signal or pop-up window will notify us that the session will just start. When the price graph crosses the edge of the session
FREE
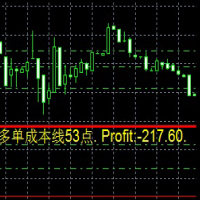
Dies ist ein Indikator
Dies ist ein Indikator, der immer die Auftragskosten und die Rentabilität in Echtzeit widerspiegelt
Besonders wenn es auf die Martin-Strategie angewendet wird, ist es bequemer 这是一个指标
这是一个时时反应订单成本 和实时 盈利值得 指标
尤其应用于 马丁策略的时候 更加方便 This is an indicator
This is an indicator that always reflects the order cost and real-time profitability
Especially when applied to the Martin strategy, it is more convenient
FREE

IMP
The Panel presents a number of indicators in abbreviated form: 2 oscillators, 2 trend and 1 volume indicator. Location - upper left corner.
Indicators values and colors can be customized by the user. Combined with other market analysis, can greatly improve trading results. This Indicator is a suitable tool for beginners and professional traders as one.
Metta Trader 4 Indicator Version _1.0
FREE
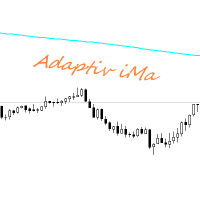
Adaptiv Ma это индикатор средняя линия значение которой выставляется в меню и применяется на тейфрейме Н4. В последствии она адаптируется к выбранному определенному таймфрейму. В меню индикатора задаются следующие параметры 1. Период индикатора 2.Метод определения Ма. 3. Стиль Ма. 4.Толщина линии Ма. 5.Цвет линии Ма.
При переключении между таймфреймами автоматически переключается значение периода Ма для адаптации к новому таймфрейму. Пишите насколько вам была полезен такой индикатор.
FREE

This is a tool to measure the velocity of the price. It's completely free, you can download and use. "Way: distance of price after one tick." "Speed: price velocity after one tick." p/s: The time for the price to jump 1 tick will not be fixed, you should know this. If Way > 0, the indicator will change color to Green If Way < 0, the indicator will change color to Red || I am a 3D artist and I love math and programming! ||
FREE
Всем привет. И снова, я, Вадим Сергеевич Лепехо, трейдер(частный) опыт 20 лет около. Forex в основном. Предлагаю Вам оценить, протестировать, опробовать индикатор. И дать свою оценку, заключение, РЕЗЮМЕ....)))). Итак, как он работает. Очень прост в понимании. Алгоритм такой. Индикатор на графике(chart) рисует кружки снизу сверху, разных цветов. Ждем когда появится на фоне одних красных кружков 1, 2, ну на крайняк 3 кружка зеленого цвета и + обязательно должен появится следом опять кружок красног
FREE
O indicador é uma ferramenta desenvolvida para o MetaTrader, projetada para auxiliar na análise detalhada do comportamento do preço em relação a uma média móvel específica. Ao ser anexado ao timeframe diário, o ele realiza cálculos e monitora, em timeframes menores, quantas vezes o preço toca determinados níveis de afastamento durante o dias além de calcular a média dos toques.
MT5: https://www.mql5.com/pt/market/product/111710
FREE

Magneto Power MA - трендовый осциллятор. Основан на классическом индикаторе moving average, но при этом имеет нестандартный способ интерпретации. Здесь нет никаких фокусов с пересечениями мувингов, только гибридная работа MA и волатильности инструмента. При этом при должной настройке может составить конкуренцию дорогим и сложным аналогам. По гистограмме индикатора легко определить текущую тенденцию, а так же исчерпало себя движение цены или ещё нет. Настройки индикатора аналогичны классическому
FREE
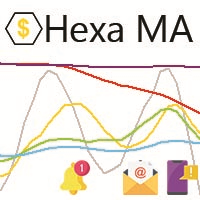
"The trend is your friend, until the end when it bends". The "Hexa MA" custom indicator is a trend following indicator. It uses 6 Moving Averages to spot the trend and follow, and also to filter the bad signals for the fast Moving Averages. The basic is simple, yet the strategy is powerful.
Recommended settings for the indicator : - Moving Average periods : SMA 5, SMA 10, SMA 20, SMA 50, SMA 100, SMA 200. - Timeframe : M15 is the default. But any timeframe can be used. - Currency pair : Since i
FREE
Indicator that displays the current price and the percentage of loss or gain, compared to the previous day.
The benefits you get : Possibility to choose your favorite crosses. Never redesigns, does not retreat, never recalculates. Works on forex and CFD, timeframe from M1 to monthly. Easy to use.
Parameters : FontSize = 20; font size FontType = "Tahoma"; character type Angle = Bottom_Right; angle view (top right .. top left sect ..) Show_Price = true; view the Bid Show_Var = true; see the dif
FREE
Dynamic Trading Dashboard for MT4 This powerful MT4 trading dashboard offers traders a comprehensive view of current and historical trading performance in an intuitive and visually organized format. With its precision-engineered design, the dashboard provides a seamless blend of real-time insights and historical analysis. This trading dashboard is perfect for meticulous traders who seek a precise, all-encompassing tool to manage open and closed positions while gaining insights into past perform
FREE
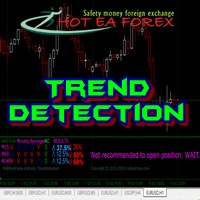
Recognizing trends is one of the most important analytical skills in trading. Not only technical traders, those who are fundamentally leaning to make the forex trend as the basis of analysis to determine entry trading. However, learning how to look at forex trends is not as simple as it seems. If you want signal accuracy to estimate the direction of the next price, then there are advanced methods in learning how to look at forex trends that you need to know. Strategy SIMPLE HOw to read trend mar
FREE
This indicator displays the historical bid and ask prices on the chart. This is an extremely useful tool for watching the spread rise and fall, as well as watching to see whether or not the bid and ask prices are converging or diverging. This tool will allow you to enter the market at just the right time. This indicator will help you stay out of the market when the spread begins to rise and help you get into the market as the spread begins to fall again.
ON SALE FOR FREE, GET IT FREE FOR A LIMI
FREE
Используете в торговле динамические диапазоны (типа Bollinger Bands или Envelopes)? Обычно для подобных расчетов используется фиксированный период, но насколько это соответствует природе рынка? В самом деле, график цены состоит из последовательности сменяющих друг друга процессов: трендов и флетов. При этом о внутренней логике развития обычно можно говорить только внутри одного и того же процесса. Соответственно, природе рынка лучше будут соответствовать динамические диапазоны, построенные для п
FREE
The Ergodic is an oscillator based on William Blau's True Strength Index, which is based on Momentum to which double smoothing has been applied. 100* EMA(EMA(Momentum) / EMA(EMA( |Momentum|)) The Ergodic adds a moving average to the TSI which will act as a Signal Line. This oscillator can be used to identify trend reversal zones, or trend continuation phases.
VERY USEFUL WHEN USED IN CONJUNCTION WITH THE CURRENCY INDEX.
L' Ergodic è un oscillatore basato sul True Strenght Index di William Bla
FREE

FXDragunov.MyThemes. Forex Chart Color Themes.
Chart templates are responsible for chart layout and for contents of technical indicators applied to them.
Chart templates are used: When customizing an opened chart window. When customizing settings of a new chart window. When customizing a chart opened via the “New chart” window.
Original code by FXDragunov Indonesia
FREE
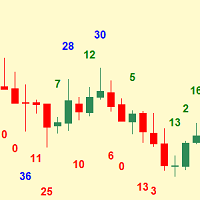
Simplest indicator for bar shadows. Very useful for Kangaroo Tail strategy.
"Shadows" - this is the distance from high and close of the bull bar and low and close of the bear bar. The purpose of the shadow is to show you if the bar is strong or not. Whether it is internal to the trend or is external. It even helps determine if a trend is starting. Input arguments: How many prevoius bars to calculate Value that should be passed to trigger the alarm How many times to repeat the alarm (Put 0 if yo
FREE
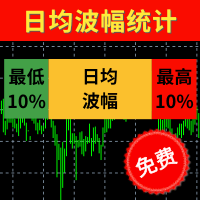
【最低10%】 统计过往100天蜡烛图的波幅并进行排序,最低10%的波幅以点数显示。 【日均波幅】 统计过往100天蜡烛图的平均波幅,并以点数显示。 【最高10%】 统计过往100天蜡烛图的波幅并进行排序,最高10%的波幅以点数显示。 【今日】 今日波幅以点数统计,箭头的位置是今日波幅相对于历史总体波幅的位置。越靠近左侧说明今日波幅越小,越有侧说明波幅越大。 波幅指标最适合用来审视当日距今为止波幅的大小,使用方法如下: 若今日时间尚早而且今日波幅尚较低,说明今日可能行情尚未启动,还有入场机会。 若今日时间尚早但今日波幅已经超过80%,说明今日趋势行情可能已经结束,接下的行情可能反弹。 若今日时间较晚,而且今日波幅已经超过60%,说明今日行情可能已经走完。 当日的止盈点位+当日已完成波幅最好不超过最高10%的波动点数。 当日的止损点位+当日已完成波幅最好超过最高10%的波动点数。 当然该指标是基于过往的100日数据进行统计,并不代表接下来今日的波幅一定不会创新低或者创新高,其作用是给日内交易者的入场时机和日内交易空间提出判断依据。 更多细节请看 http://www.sygdpx.co
FREE
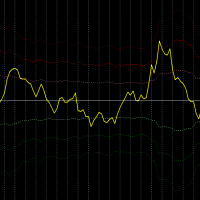
Description:
This indicator measures how far the price is away from Moving Average or multiple Moving Averages (from Lowest MA Period to Highest MA Period). also you can apply weighted factor that increase / decrease from lowest MA to highest MA period.
Inputs:
Lowest MA Period Highest MA Period Weighted factor for Lowest MA Period Weighted factor for Highest MA Period MAs method MAs applied price ATR Period 1st band factor 2nd band factor 3rd band factor indicator Applied price
FREE
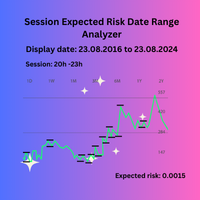
Session Expected Risk Date Range Analyzer: Analyzes price data across specified date ranges to provide detailed insights into financial risk and volatility, using each bar's price metrics for accurate risk assessment.
The Session Expected Risk Date Range Analyzer is a sophisticated tool designed to offer traders and analysts detailed insights into the expected financial risk across specific date ranges. Unlike traditional session-based analysis, this indicator focuses on calculating risk metr
FREE

Данный индикатор помогает трейдеру принять окончательное решение. Когда уже определились, в какую сторону будет разворачиваться цена, остаётся как можно точнее определить сам разворот. Именно эту задачу и выполняет индикатор "Konkov". Индикатор устанавливается на графики М1 и М5. Параметры индикатора: для графика М1 time_frame1 5 time_frame2 5 time_fra
FREE

Индикатор Adaptive MA представляет из себя нехитрую модификацию скользящих средних (MA) - позволяет отобразить на графике линию среднего значения от нескольких MA. В параметрах вы сможете задать любое количество периодов MA, сколько параметров - столько скользящих средних примет участие в расчете.
С одной стороны может показаться, что ничего нового не изобретено и смысла в данном подходе нет. Но подождите расходиться. Как известно, тенденции бывают разной периодичности. А вы пробовали совмещать
FREE
Индикатор Fractals Direction ST Patterns MT4 является модификацией индикатора Fractals Билла Вильямса и позволяет задавать любое количество баров для нахождения фрактала. Также в настройках имеется возможность устанавливать количество пунктов для определения направления тренда. Направление вверх определяется если последний верхний фрактал выше чем предпоследний верхний фрактал. Направление вниз определяется если последний нижний фрактал ниже чем предпоследний нижний фрактал. Этот простой индикат
FREE

TREND MATE is an useful indicator that will support your decision to trade according to the current trend. It is possible to configure alert and push notification to receive when entering to first candle for bull / bear trend. If you want to use this indicator for a EA, use the function iCustom as follows:
DOWNTREND : iCustom(NULL,0,"Trend_Mate",0,0) . If downtrend result is "1", otherwise is "0".
UPTREND : iCustom(NULL,0,"Trend_Mate",1,0) . If uptrend result is "1", otherwise is "0".
For an
FREE

ALBA Backtest Calibrator: The Ultimate GMT & DST Detection Engine Stop guessing. Start engineering your trades. In the realm of algorithmic trading, a single hour of deviation in your backtest time can completely obliterate your Expert Advisor's trading logic, especially for session-dependent strategies. Welcome to the ALBA Backtest Calibrator , a mathematically precise dashboard engineered to calculate your broker's exact GMT offset and Daylight Saving Time (DST) shifts with 100% accuracy. Des
FREE

Detailed post explained:
https://www.mql5.com/en/blogs/post/759269
This is a slope indicator for Bollinger Bands indicator. It provides slopes for BB top band, center band (main) and Lower Band. You can also set a threshold value for Center line to control Red/Green slope histogram lines. Settings:
You can choose which line you need the slope and Threshold Alerts for in Drop down.
Slope Thresholds: for Alerts. Please note that Alerts only happen when Threshold is crossed. e.g.: If Threshold
FREE
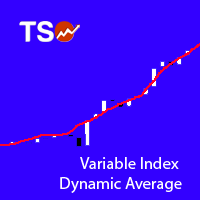
Скользящая Средняя с Динамическим Периодом Усреднения (Variable Index Dynamic Average, VIDYA) - это оригинальная методика вычисления экспоненциальной скользящей средней (EMA) с динамически меняющимся периодом усреднения, разработанная Тушаром Чендом (Tushar Chande). Период VIDYA зависит от волатильности рынка, указанный осциллятором Chande Momentum Oscillator (CMO).
Сигналы индикатора VIDYA формирует сигналы на покупку и продажу, когда цена пересекает полосы вверх и вниз. Когда цена пересекает
FREE

GBP INDEX
The Currency Index Project is ONE part of a thorough Forex study. Many people do not know the theoretical basis that drives currency exchange rates to move on the market. With this set of tools you will be able to have a more complete view of the entire market by analyzing not only the single currency of an exchange, but all the exchange rates that make up that currency by looking at a single window!
The indicator faithfully represents the real index of a single currency present in a
FREE

NZD INDEX
The Currency Index Project is ONE part of a thorough Forex study. Many people do not know the theoretical basis that drives currency exchange rates to move on the market. With this set of tools you will be able to have a more complete view of the entire market by analyzing not only the single currency of an exchange, but all the exchange rates that make up that currency by looking at a single window!
The indicator faithfully represents the real index of a single currency present in a
FREE

Индикатор Currency Explorer позволяет вам знать с рассчитанной точностью силу и слабость каждой валюты и торговать, применяя необходимые стратегии. Наши модели машинного обучения рассчитывают силу/слабость каждой валюты на основе нескольких факторов помимо поведения цены. Индикатор предоставляет количественное значение силы восьми наиболее популярных основных валют (EUR, USD, JPY, GBP, AUD, NZD, CAD и CHF) от 0 до 100 на пяти любых таймфреймах, выбранных пользователем. Кроме таймфреймов, можно в
FREE

iMACD in iMA - индикатор для изменения цвета iMA, когда iMACD находится выше нуля (растущий тренд) или ниже нуля (падающий тренд). Это полезный инструмент для отслеживания растущего и падающего iMACD на iMA.
Параметры MA_Periods — период iMA. MA_Method — метод расчета iMA. MACD_FastEMA — быстрая EMA для MACD. MACD_SlowEMA — медленная EMA для MACD. MACD_SignalSMA — сигнальная SMA для MACD. MACD_ApliedPrice — цена для построения MACD. BarsCount — количество баров для показа линии. ReverseSignals
FREE

This is a custom MT4 indicator called “Elsna Moving Average” . It plots three moving averages (MA1, MA2) on the chart with customizable periods, shifts, methods, and applied prices. MA1 & MA2 can optionally be used to create fill areas (histogram-like shading) based on a color-fill setting You can show or hide each MA individually. The indicator is designed for trend identification and visualization , helping traders see MA relationships and potential support/resistance zon
FREE
What is so remarkable about the Nema general PRT indicator? It calculates all known derivatives of "EMA" (you know some: DEMA - or, more simply, EMA of the 2nd depth level, TEMA - EMA of the 3rd depth level...DecEMA ...and so you can dive into your research up to level 50...) If you set the depth = 1, then it will be an analogue of "EMA"; I repeat - depth 2 = "DEMA"; depth 3 = "TEMA"...Experiment - check the behavior of the created average at other depths. The indicator also has the abili
FREE
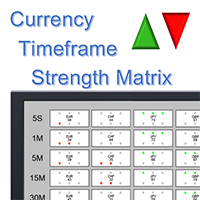
Примечание: этот продукт является ограниченной бесплатной версией индикатора Currency Timeframe Strength Matrix . Он работает только на валютах AUD, CAD и CHF, а не на всех 8 валютах. Поддерживаются только таймфреймы 5S, 1M, 5M вместо всех 8 (5S, 1M, 5M, 15M, 30M, 1H, 4H, 1D).
Что это такое? Currency TimeFrame Strength Matrix - это простая и подробная карта рынка Форекс, которая показывает состояние происходящего на рынке Форекс в данный момент. Индикатор отображает характеристики силы и импул
FREE

Analyze volatility by clicking on a specific candlestick, which triggers the display of horizontal grid lines centered around the candlestick’s closing price, spaced by multiples of the calculated ATR. A vertical line highlights the selected candlestick, and an optional text label can display the ATR value in pips above the candlestick. The indicator is lightweight, using no buffers, and relies on chart objects for visualization. It includes error handling for invalid candlestick selections and
FREE
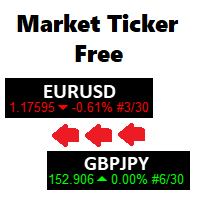
A scrolling Market Ticker that displays price changes from all symbols in the Market Watch list. Provides an easy snapshot of symbol prices, and keeps scrolling automatically while you trade and analyse the chart.
Options include: - MTF, eg choose to show price changes of the daily chart, or the hourly - use the live candle or the recently completed - font and background coloring
FREE

Это демонстрационная версия PipsFactoryDaily Этот индикатор зависит от цен High и Low валюты за последний день, использует секретные уравнения для рисования 10 линий.
Особенности Вы будете знать по какой именно цене вам лучше войти на рынок. Вы будете знать, когда выходить из рынка. Вы будете знать, что вам следует делать в рынке: Покупка Продажа Тэйк Профит, имеются три уровня для фиксации прибыли Поддержка Сопротивление Риск при покупке Риск при продаже
Типы сигналов и используемые таймфрейм
FREE
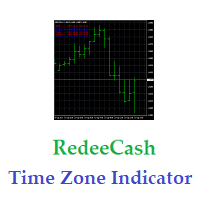
Этот индикатор будет отображать активные и неактивные торговые сессии, а также устанавливать глобальные переменные в зависимости от того, активна ли торговая сессия (1) или неактивна (0). Используя библиотечную функцию iCustom, вы можете вызвать этот индикатор из советника или скрипта следующим образом: // Вызвать пользовательский индикатор iCustom ( Symbol (), PERIOD_D1 , "Market/RedeeCash_TimeZone" , 0 , 0 ,Blue,Red); // получить значения глобальных переменных double NewYorkSessionIsActive = G
FREE
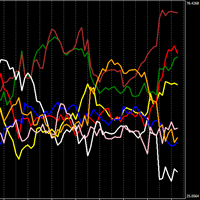
Мощный индикатор, показывающий силу отдельной валюты.
Чем он выше, тем сильнее валюта, и наоборот, чем он ниже, тем она слабее.
Торговая стратегия N1: Открывайте позицию при пересечении линий, если одна пересекает вверх, а другая вниз, открывайте позицию по валюте, которая растет.
Торговая стратегия N2: Откройте позицию, покупая самую сильную валюту и продавая самую слабую валюту.
В настройках можно изменить таймфрейм, я использую по умолчанию (ТАЙМФРАММ 1 ЧАС) и с периодом 24. Я также испо
FREE

Треугольные арбитражные возможности RedeeCash показывают доступные валютные триады и настройки каждой валютной торговой позиции в виде глобальной переменной в формате
ААА/ВВВ, ССС/ААА, ССС/ВВВ: ААА/ВВВ -1|0|1
ААА/ВВВ, ССС/ААА, ССС/ВВВ: ССС/ААА -1|0|1
ААА/ВВВ, ССС/ААА, ССС/ВВВ: ССС/ВВВ -1|0|1
где значение представляет собой направление сделки OP_BUY или OP_SELL. Если направление торговли указывает -1, то для этой валютной пары не должно происходить никаких сделок.
Треугольная арбитражная то
FREE

Using multiple timeframes for analysis with Multi Timeframe Bollinger Bands can provide several significant benefits for traders: Comprehensive Market View: By applying Mtf Bands Standard across different timeframes, traders gain a broader perspective on market dynamics. This allows them to identify trends, patterns, and potential reversal points that might be more apparent or consistent across various scales. Enhanced Pattern Recognition: Multiple timeframes help in identifying repeating patte
FREE

Индикатор отображает сетку в виде "пчелиных сот" или правильный шестиугольник. Альтернатива стандартной сетке торгового терминала. Описание настроек индикатора: color_comb - цвет сетки width - ширина, пример: 22 для экрана с разрешением 1920*1080, 15 для экрана с разрешением 1366*768 и т.д. height - высота, пример: 6 для экрана с разрешением 1920*1080, 4 для экрана с разрешением 1366*768 и т.д.
FREE

CFN - Multi MA & EMA Indicator for MT4 – with Alerts Enhance your technical analysis with the Multi MA & EMA Indicator – a powerful tool designed for traders who rely on Moving Averages and Exponential Moving Averages to spot trends, entries, and exits. Key Features: Supports up to 5 Moving Averages (MA) & 5 Exponential Moving Averages (EMA):
Plot multiple MAs and EMAs simultaneously on your chart, fully customizable with individual periods. Custom Colors & Styles:
Each MA and EMA l
FREE
Это демо-версия индикатора PipsFactoryInd , работающая только на паре NZD/USD. При этом полная версия работает со всеми валютными парами.
Это набор индикаторов 3 в 1. Он включает в себя: PipsFactoryDaily Ссылка PipsFactoryWeekly Ссылка PipsFactoryMonthly Ссылка
Индикатор использует максимум и минимум цены символа за последний день/последнюю неделю/последний месяц (в зависимости от настроек), а также применяет некие секретные уравнения для построения 10 линий.
Что вы сможете делать с помощью на
FREE

Название продукта Smart Alligator (MT4) – часть серии SmartView Краткое описание Индикатор Alligator с уникальным пользовательским опытом на платформе MetaTrader. Предоставляет расширенные возможности, ранее недоступные, такие как открытие настроек двойным кликом, скрытие и отображение индикаторов без удаления, и отображение окна индикатора на весь размер графика. Разработан для работы вместе с остальными индикаторами серии SmartView. Обзор Серия SmartView предлагает уникальный и отличительный п
FREE

Название продукта Smart Momentum (MT4) – часть серии SmartView Краткое описание Индикатор Momentum с уникальным пользовательским опытом на платформе MetaTrader. Предоставляет расширенные возможности, ранее недоступные, такие как открытие настроек двойным кликом, скрытие и отображение индикаторов без удаления, и отображение окна индикатора на весь размер графика. Разработан для работы вместе с остальными индикаторами серии SmartView. Обзор Серия SmartView предлагает уникальный и отличительный пол
FREE

This is a Bot which send notifications every hour at your MT4 platform. The notification consists of four part. <<Clock>> + Your Message + Symbols + profit + Total # of Orders + Total profit Here is an example : 21:00 Hodor: #US30 $+40.31 GOLD $-5.31 Total 5 Orders $+35.00 If there is no order : 21:00 Hodor: HODOR signals: https://www.mql5.com/en/signals/977796
There is a private message parameter where you can enter your own message also. Hodor_Comment_OnOff_Flag removes the "Hodor i
FREE
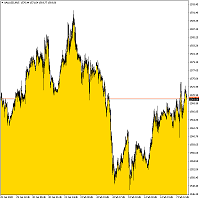
Индикатор устанавливает нижний фон определенного цвета до текущей цены в зависимости от настроек. Описание настроек индикатора: MODE - три варианта отображения индикатора: Low - отображение до минимальной цены, Open/Close - отображение до цены открытия или закрытия в зависимости что ниже, MA - отображение до скользящей средней. PeriodMA - период скользящей средней.
FREE

This indicator alerts you when/before new 1 or 5 minute bar candle formed. In other words,this indicator alerts you every 1/5 minutes. This indicator is especially useful for traders who trade when new bars formed.
*This indicator don't work propery in strategy tester.Use this in live trading to check functionality.
There is more powerful Pro version .In Pro version,you can choose more timeframe and so on.
Input Parameters Alert_Or_Sound =Sound ----- Choose alert or sound or both to notify y
FREE

Индикатор FX Secretary - это мини ассистент для МТ-4. В его функциональные обязанности входит - оповещение трейдера о закрытии сделок с прибылью или же с убытком. В настройках лишь один параметр, в котором можно менять язык голосового сообщения. Пока что индикатор говорит лишь на двух языках. В дальнейшем возможно расширение функционала и с увеличением языков и набором слов. Пользуйтесь на здоровье!
FREE
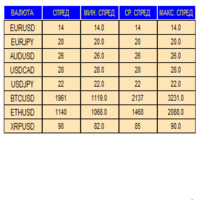
Индикатор в виде панели для отслеживания и сбора статистики по спредам из указаного списка пар. Достаточно открыть один график и установить индикатор для сбора статистики по всем указанным парам. Панель после завершения работы записывает значения в файл, что позволяет не перерывать сбор статистики после завершения работы.
Входные параметры:
-Интервал обновления спреда по парам (сек) Позволяет указывать с какой периодичностью проводить сбор статистики (позволяет снизить нагрузку) -Список пар С
FREE
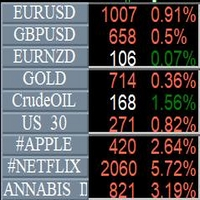
Info Symbol is an indicator that will allow you to monitor up to 9 different markets. Just enter the name of the symbols and the number of decimal places. With a single click you can switch from one market to another, it will take two clicks for a chart with an expert attached to it. With this indicator, you will know how many points or pips that the monitored markets have gained or lost since the beginning of the day and you will also have the percentage.
FREE
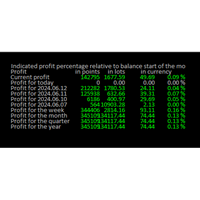
Онлайн-дневник: Этот индикатор разработан, чтобы помочь трейдерам отслеживать прибыль и убытки за различные временные периоды, такие как текущая прибыль, прибыль за сегодня, прибыль за вчера и так далее, до прибыли за текущий год. Индикатор предлагает несколько вариантов настройки, таких как расчет процентной прибыли относительно баланса на начало дня, недели, месяца, квартала или года. Он также позволяет настраивать размещение текста и цвета в соответствии с потребностями пользователя.
FREE

RJT SALAMANDER, the indicator as in a video game
VERSION 2
Pilot your PRICE spaceship inside the cavern and avoid the collision against the stalactites (green) and stalagmites (red), dodging these obstacles to win.
When these objects are forming (or disappearing) then you must make the decision how to move your ship (just like in a video game)
Depending on the market and the size of the candles/bars you can adjust the calculation of stalactites and stalagmites (based on the last bars) in the
FREE
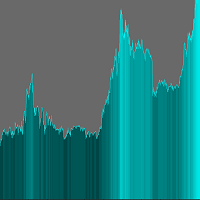
The indicator adds an overlay to the graph to create a histogram.
There are no parameters to set.
On the chart you can choose the color in the upper right corner by clicking on the appropriate brick.
The histogram is shaded depending on the price value.
Remember to set a line chart (shown in the screenshot). ........................... I invite you to purchase.
FREE

The Bombay Stock Exchange Session's Hours
This indicator facilitates observing the currency pair's quotations during subsequent parts of the stock exchange session live. Before the session starts, a rectangle is drawn on the chart but not filled in with color. It means the extent of the session duration. Before the first bar enters the rectangle of the session, a sound signal or pop-up window will notify us that the session will just start. When the price graph crosses the edge of the session
FREE

The Hong Kong Stock Exchange Session's Hours
This indicator facilitates observing the currency pair's quotations during subsequent parts of the stock exchange session live. Before the session starts, a rectangle is drawn on the chart but not filled in with color. It means the extent of the session duration. Before the first bar enters the rectangle of the session, a sound signal or pop-up window will notify us that the session will just start. When the price graph crosses the edge of the sessi
FREE
The Shenzhen Stock Exchange Session's Hours
This indicator facilitates observing the currency pair's quotations during subsequent parts of the stock exchange session live. Before the session starts, a rectangle is drawn on the chart but not filled in with color. It means the extent of the session duration. Before the first bar enters the rectangle of the session, a sound signal or pop-up window will notify us that the session will just start. When the price graph crosses the edge of the sessio
FREE

The London Stock Exchange Session's Hours
This indicator facilitates observing the currency pair's quotations during subsequent parts of the stock exchange session live. Before the session starts, a rectangle is drawn on the chart but not filled in with color. It means the extent of the session duration. Before the first bar enters the rectangle of the session, a sound signal or pop-up window will notify us that the session will just start. When the price graph crosses the edge of the session
FREE

Todays High and Low
This indicator draws lines at the highest price of the day and at the lowest price of the day. Both lines are ended with labels with the maximum and minimum prices written. Lines and labels are moved according to the chart progress in real time. The indicator works on all chart time intervals. You can change and set colors and shift the chart. The indicator allows you to observe the price movement on the chart and not lose sight of the price maxima and minima achieved.
FREE
ARR indicator is similar to ATR but it returns percent range in relation to open price of given bar. It is mostly useful for cryptocurrency symbols where ATR ranges from years ago can't be directly compare with current values. First buffer (red dotted line) represents percent range of single bar and second buffer (white solid line) represents simple average of defined number of last bars. Only one input, PERIOD relates to number of bars used for average calculation (in default equals to 14).
FREE

This indicator is an utility for have always under control, how much time is left at the end of the bar setted.
The utility show on the lower right of the chart, the countdown to the end.
When the remaining seconds is = to the seconds set in the input, the color of remaining seconds on chart, change color and play a warning sound to warn you that the bar is about the end. When the remaining seconds is < to the seconds set in the input, the utility play a beep to warn you that the bar is in co
FREE

Moving indicator. It is written so that it doesn't signal when two moving averages cross. Easy to operate. It performed well on European and Asian currencies. Designed for long-term and medium-term types of trading. Индикатор мувингов. Написан так что даёт сигнал при пересечении двух скользящих. Прост в управлении. Хорошо себя показал на европейских и азиатских валютах. Рассчитан на долгосрочный тип торговли.
FREE
Velvet MACD is intended for use with the Velvet advanced ordering layer. It is a modified version of the MACD indicator provided by Metaquotes and all of the data it displays is accurate and verified, when it is detected by the ordering layer. In order to place orders with the Velvet MACD indicator, the ordering layer must be installed and running. Ordering from the Velvet MACD indicator requires that "Velvet Ordering Layer" ( found here ), version 2.0 or higher, be installed and running. Whe
FREE

This indicator smoothes the value of CCI (Commodity Channel Index) and reduces its volatility. By using this indicator, the fluctuations created by the CCI indicator are reduced. The smoothed CCI value is placed in a buffer that you can use in your EA and strategy. Leave me a comment if you want By using this indicator, you no longer need to use the Moving Average indicator on the CCI indicator.
FREE
Индикатор "INFO Spread Swaзp Info Panel" для MT4, вспомогательный инструмент для торговли.
- Индикатор показывает текущий спред и свопы валютной пары, к которой он прикреплен. Также идикатор показывает: 1. Дату и время сервера 2. Название сервера 3. Название влютной пары. 4. Спред 5. Своп 6. Открытые позиции 7. Отложенные ордера 8. Максимальная просадка после открытия индикатора 9. 30% от депозита. (можно менять) Можно менять положение, размер, цвет шрифта, расстояние между строками.
FREE

As the title says, this is an indicator that shows the current open market (session). It has 4 sessions with customizable schedule : 1. London session, 2. New York session, 3. Sydney session, 4. Tokyo session.
Indicator inputs: - The color of each session. - The open time and close time of the sessions. - The line width.
The objective of the indicator, is to follow each sessions, observe at what times are multiple sessions open, and thus take the chance of the high market movements.
FREE

Не ИИ (Not AI). Индикатор (счетчик) тикового объема, прошедшего на покупку и продажу. Представляет интерес для выявления зон поддержек и сопротивлений. Работает на активном рынке. Не перерисовывается. Вначале, когда индикатор только присоединен к графику, в его окне ничего не отображается. По мере накопления «живой» истории тиков, он начинает отрисовывать гистограмму объемов. Зеленые столбики показывают количество изменений цены на покупку, красные – на продажу. Синяя ломаная линия, проходящая п
FREE
Version History Date Version Changes 07/09/2022 1.10 Initial released Description The RedeeCash RSI is your typical RSI indicator with the three latest RSI calculations exposed as global variables for easier integration with scripts and expert advisors. Code Sample To invoke this indicator from an EA or script, call the iCustom metatrader function, iCustom ( Symbol (), PERIOD_CURRENT , "Market/RedeeCash RSI" , 14 , 1 , 0 ); string RSIVarName = StringConcatenate ( Symbol (), "_rsi" ); string RSIP
FREE

Have you ever lost your mind? Cause you open multiple positions try to revenge the market or sometime open double, triple position to maximize the profit? if you are win it is okay, but how about if you lose? So "MaxOrdersWarning" may remind your consciousness not to open too many orders in the same time.
How to use - Drag and drop Indicator on your chart. - Set the limitation number of your position ( per Chart Symbol that you open )
Then what's next?
If you reaches the limit, the background
FREE
MetaTrader Маркет - уникальная площадка по продаже роботов и технических индикаторов, не имеющая аналогов.
Памятка пользователя MQL5.community расскажет вам и о других возможностях, доступных трейдерам только у нас: копирование торговых сигналов, заказ программ для фрилансеров, автоматические расчеты через платежную систему, аренда вычислительных мощностей в MQL5 Cloud Network.

Вы упускаете торговые возможности:
- Бесплатные приложения для трейдинга
- 8 000+ сигналов для копирования
- Экономические новости для анализа финансовых рынков
Регистрация
Вход
Вы принимаете политику сайта и условия использования
Если у вас нет учетной записи, зарегистрируйтесь