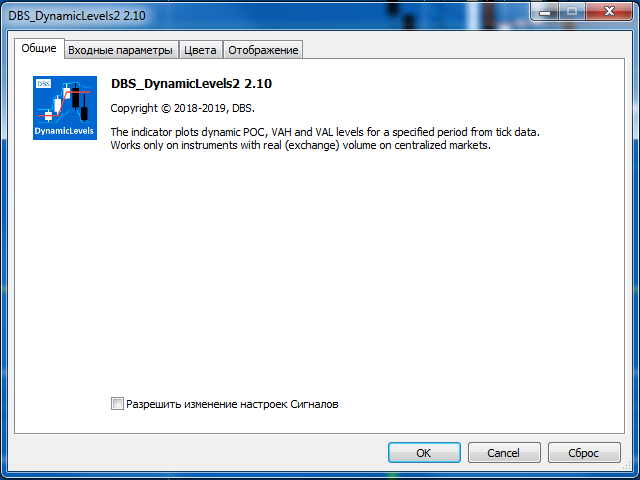
DBS Dynamic Levels
- Indicadores
- Versão: 2.10
- Ativações: 5

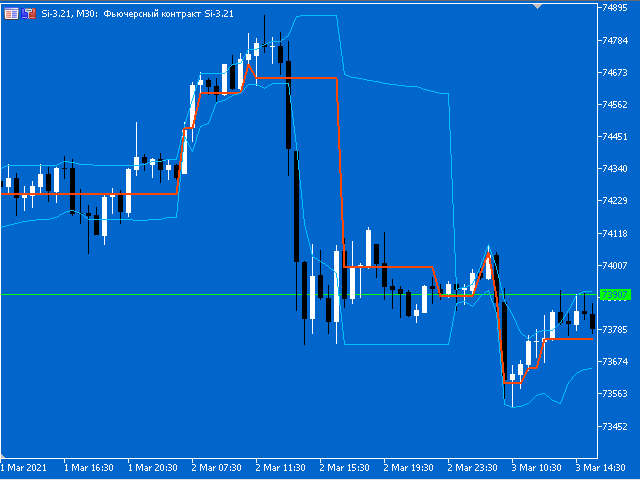
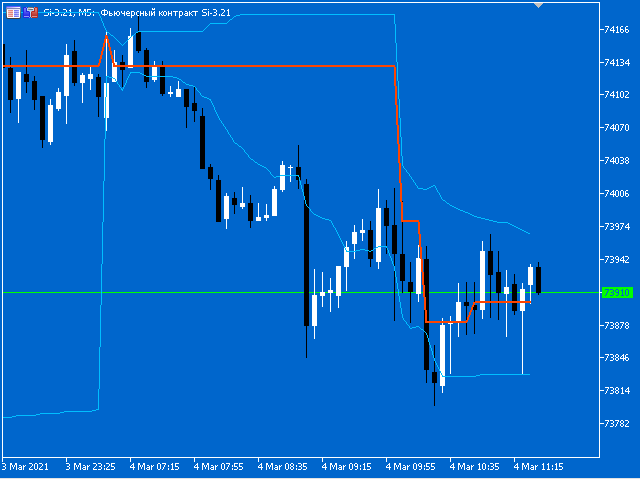
The indicator plots dynamic POC, VAH and VAL levels for a specified period from tick data.
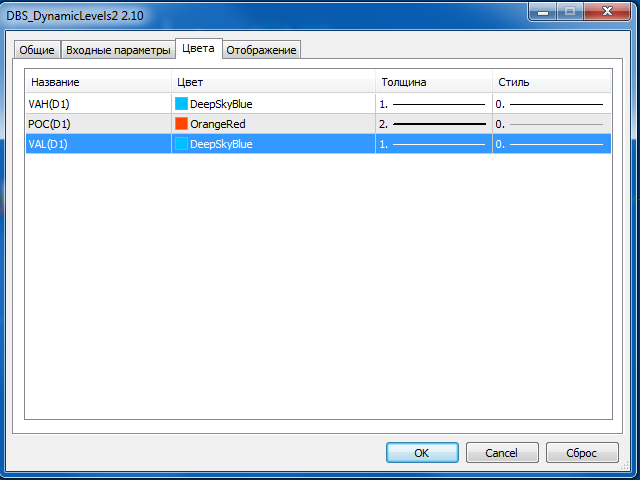
POC - Point Of Control, the price at which the maximum volume has accumulated over a certain period of time (POC in the volume profile).
VA - Volume Area, the zone of the fair value of the asset. VAH - Volume Area High. VAL - Volume Area Low.
The DBS_DynamicLevels indicator plots dynamic levels where the calculation point is the maximum volume level (POC) and zone VAH / VAL. The indicator shows the history of the position of the maximum volume, which allows you to understand the development of the situation in time.
The value of the indicator lies in the fact that you can see the development of the volume profile in the dynamics of the period in terms of changes in the price of maximum accumulation (POC). The indicator allows you to detect levels "hidden" by time, to show the movement of volume within a day / week / month.
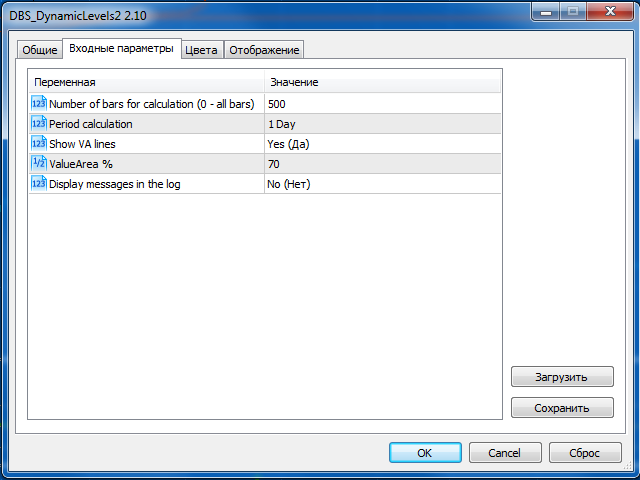
The indicator is calculated from the tick history, therefore, to speed up the calculations and reduce the load on the system, the number of bars for calculation is specified in the parameters.
Input parameters:
- Number of bars for calculation (0 - all bars) - the number of bars for calculating the indicator.
- Period calculation - period for calculating the indicator (cannot be less than the current period of the chart)
- Show VA lines - show VA (Volume Area) lines or not
- ValueArea % - percentage for calculating VA lines
- Display messages in the log - display messages in the terminal log window