Stochastic Break Point
- Indicadores
- Versão: 1.0
- Ativações: 5
Stochastic Break Point is based on the stochastic oscillator and moving average to find the points in which the currency will probably go in a defined direction.
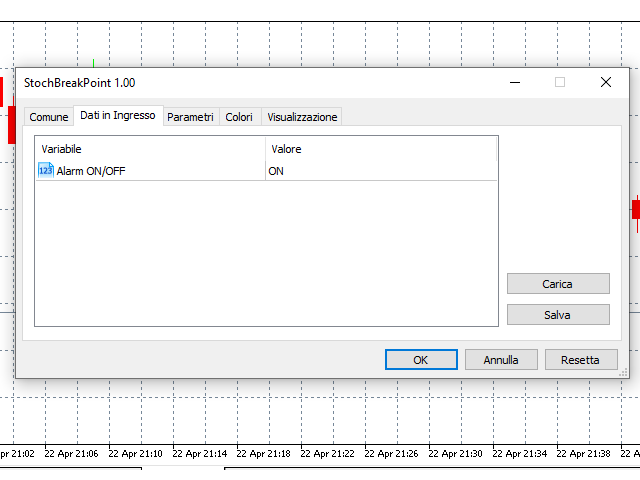
Inputs:
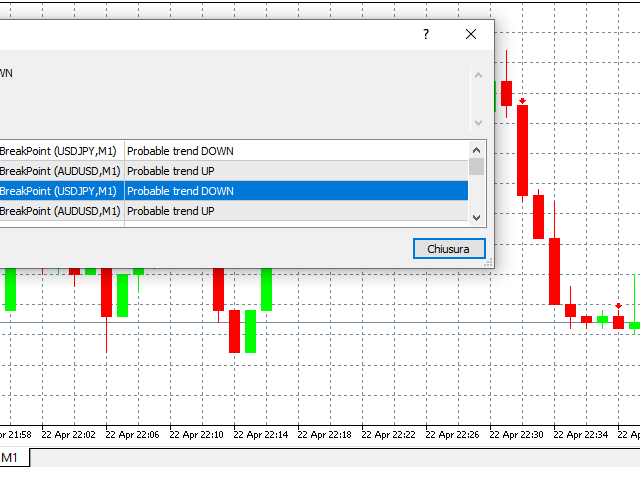
- Alarm ON/OFF: turn on or off alarm on screen.
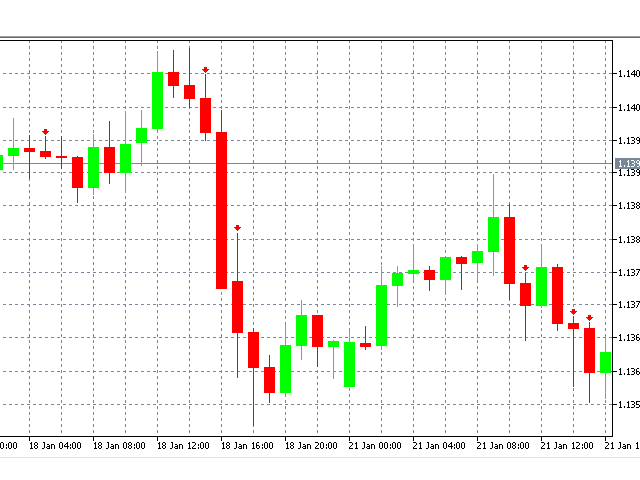
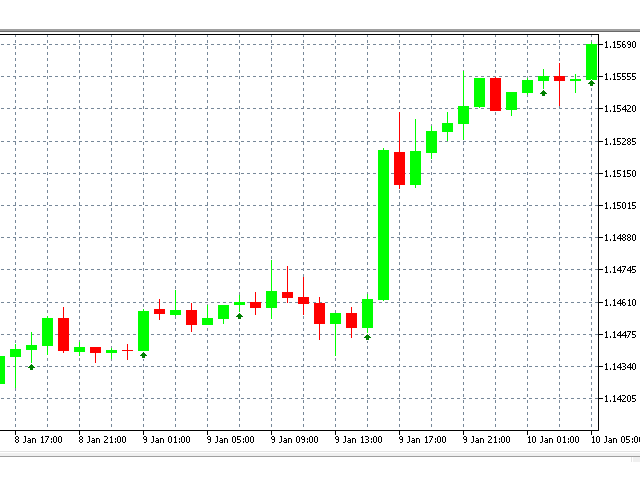
The indicator draws an arrow pointing the direction to follow based on when the stochastic line cross the signal line and in which direction it does it, filtered by the moving average direction.
Stochastic Break Point can help you to choose the moment to do your trades in a specific direction, strengthening your trading strategy.