RBC Range Bar Chart
- Indicadores
- Versão: 1.2
- Atualizado: 28 novembro 2021
- Ativações: 5

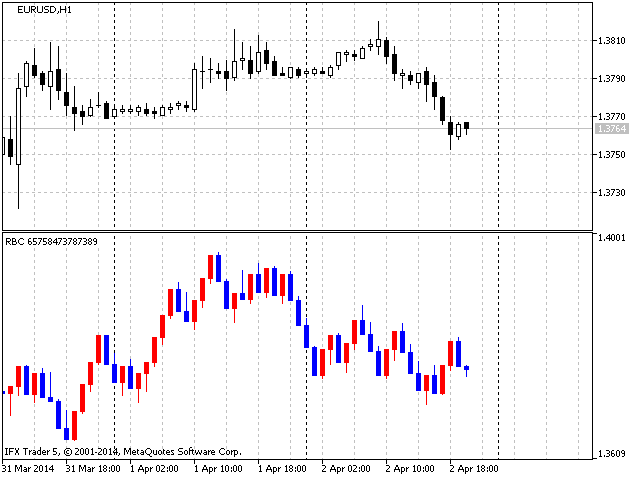
RBC Range Bar Chart é um indicador clássico de gráfico de variação de barras. O indicador apresenta variações de preço para plotar um gráfico: variação das Máx/Mín dos preços é uma clássica opção para análise, também temos a Abertura, Máxima, Mínima e Fechamento dos preços Na primeira opção dois valores de preço são analisados ao mesmo tempo, enquanto na segunda opção apenas um preço é usado. Convencionalmente, as variações das barras são desenhadas usando dados de tick, mas mesmo os dados de tick não estão disponível no servidor, plotagem do gráfico somente é possível baseado nos dados das barras a partir dos timeframes padrões. Você deve ter em mente que quanto maior o timeframe, mais grosseiro o gráfico plotado. O indicador implementa a seleção pelos timeframes padrões.
Na primeira execução você deve pressionar a tecla R ou aguardar pelo parâmetro "Update period chart" (atualizar período do gráfico), especificado nas configurações. Isto iniciará a plotagem do gráfico. Se o indicador obtém um erro de cópia, isso significa que a cópia dos dados do servidor está em andamento, o que pode levar algum tempo e você deve tentar novamente mais tarde.
- Se você selecionar um intervalo de tempo muito grande para efeitos de análise (parâmetro "Start date analysis"), a plotagem do gráfico pode demorar muito, pois o indicador está copiando uma grande quantidade de dados a partir do início do servidor;
- Ao analisar o indicador no Testador Estratégia, a data de início do teste deve ser de cerca de uma semana ou um mês mais cedo do que a data desejada pelo trader (dependendo do parâmetro "Step" configurado).
Configuração do Indicador
- Magic number - número único de identidade do indicador, é necessário se vários indicadores são executados simultaneamente (cada indicador deve ter seu próprio número mágico);
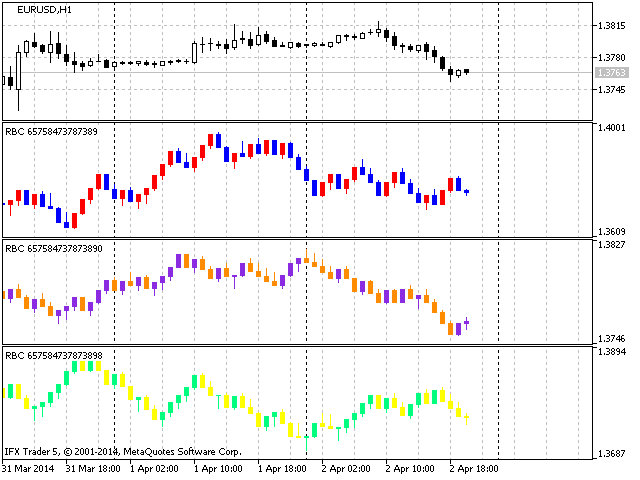
- Period of the analyzed data - o indicador de plotagem do gráfico é baseado em dados de barras a partir de diferentes intervalos de tempo (quanto maior o timeframe, mais grosseiro é a criação dos gráficos);
- Update period chart - definir um tempo de atualização específico para evitar o recálculo do gráfico em cada tick;
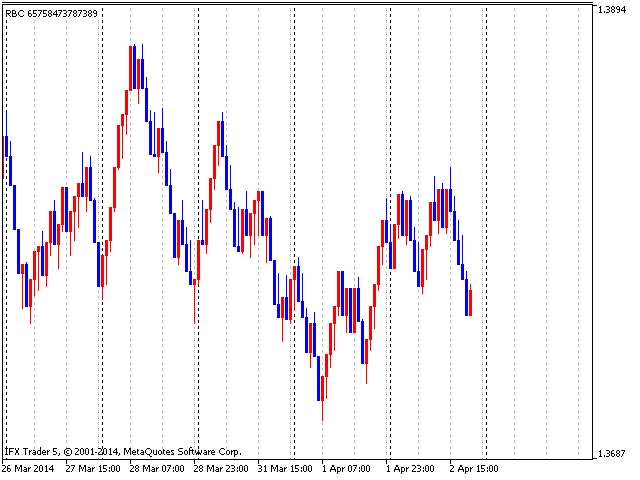
- Start date analysis - o indicador somente analisa e plota gráficos a partir de uma data especifica;
- Type price for building - como mencionado anteriormente, o indicador pode plotar gráfico com base em preços diferentes (Máx/Mín, Abertura, Máxima, Mínima, Fechamento);
- Step - é o parâmetro mais importante do RBC Ranger Bar Chart, determina o tamanho do movimento necessário para desenhar a variação das barras.