Currencies Cleaner
- Utilitários
-
Francesco Rubeo
 Minerva Management is a company composed by software engineers, especially in MQL4 by 6 years, and 6 years experienced traders.
 - Versão: 1.2
- Atualizado: 7 dezembro 2018
- Ativações: 20
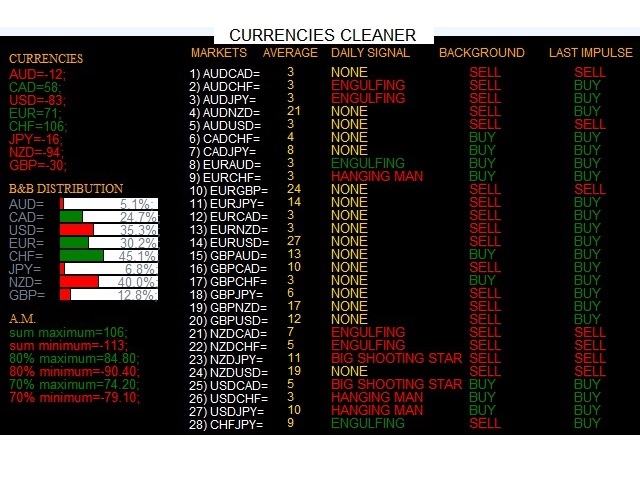
Currencies Cleaner panel will give you an overview of all the most traded market's currencies in a single click.
First of all the panel will refresh all your charts, opening them four times in all timeframes needed.
1 - CURRENCIES
It uses a complex algorithm to study the movement of 17 different indicators. It means that the algorithm not only "reads" the actual value of an indicator, but also creates a probability of success using the position of this value on the indicator and the last movement of the same indicator. After doing this (for each one of the indicators), the algorithm will study the smaller timeframes of the markets, measuring how many times a market has broken the volatility of the indicator on top and on the bottom. The final part consists in isolating the markets of a particular currency and gathering all the probabilities studied before, giving us a numerical results.
Currencies with positive numbers means that one currency, statistically, will have a bull market. On the other hand, currencies with negative numbers means that this currency, statistically, will have a bear market. The higher is the absolute value, the higher is the probability of success.
2 - A.M. and B&B DISTRIBUTIONS
Now we have the second information, the answer to the question: How I read those previous numbers?
You'll get the answer reading this:
B&B Distributions tells you how much bears and bulls are distributed in markets.
A.M. gives us the maximum and minimum value reachable by a single currency, showing also the 80% and the 70% of those values.
The nearer a currency is to the maximum or the minimum of the A.M., the more the currency, statistically, will follow the analysis during the following day. So if the value is (of the absolute value) less than the 70% of the minimum or less the 70% of the maximum, we have a lower probability to obtain our target.
3 - AVERAGE
The panel shows which moving average, statistically, is cut or touched by the market, starting a trend. So we have an higher probability to enter in a market which is starting a trend. Obviously, the lowest is the average value, the lowest are the pips of the target.
4 - DAILY SIGNAL
This panel shows candlesticks patterns in Daily time.
Patterns for Long:
ENGULFING, HAMMER, BIG HAMMER, LONG LINE, INVERTED HAMMER.
Patterns for Short:
ENGULFING, SHOOTING STAR, BIG SHOOTING STAR, LONG LINE, HANGING MAN.
P.N.: These figures are seen in the panel only if market has touched or broken the average.
5 - BACKGROUND
It simply shows the last candlesticks patterns info on the market in weekly time chart.
6 - LAST IMPULSE
An impulse is a ZigZag movement created by the market, called "swing". A market which has the last swing long, has the previous short and vice versa. The highest swing in pips is the Last Impulse.
If you click on a Symbol name, the current chart will switch to that symbol.
Input parameters
Louisiana inputs:
- Magic Buy: Set magic number for buy orders.
- Magic Sell: Set magic number for sell orders.
- Slippage: Set slippage.
- Louisiana Background Color: Set background color.
- Louisiana Front Color: Set front color.
- Buy Orders Color: Set your favourite color for buy orders.
- Sell Orders Color: Set your favourite color for sell orders.
- Louisiana Language: Set your favourite language for your assistant: English, Italian and Spanish.
Currencies Cleaner inputs:
- color_scheme - the color scheme of the panel (background and text color):
- white_on_black
- black_on_white
- yellow_on_green
- blue_on_gray
- bull_signals_color - the color of the text in the panel that indicates a bull signal.
- bear_signals_color - the color of the text in the panel that indicates a bear signal.
- sunday_cleaner - some brokers have a D1 candle built by only two hours, so this partial D1 candle may wrongly influence the analysis.
- true - choose true if you start the panel on Monday and you have the Sunday candle.
- false - choose false if you start the panel not on Monday.
- "list of symbols name" - in case your broker uses non standard symbols name (for example, EURUSDp instead of EURUSD), here you can put the symbols name used by your broker.
Setup
This panel is an EA. So you have to install it in your MQL4/Experts folder.
Panel minimal resolution is 650x420.