Scoutmark SMC Scanner
- Indicadores
- Versão: 1.0
- Ativações: 10

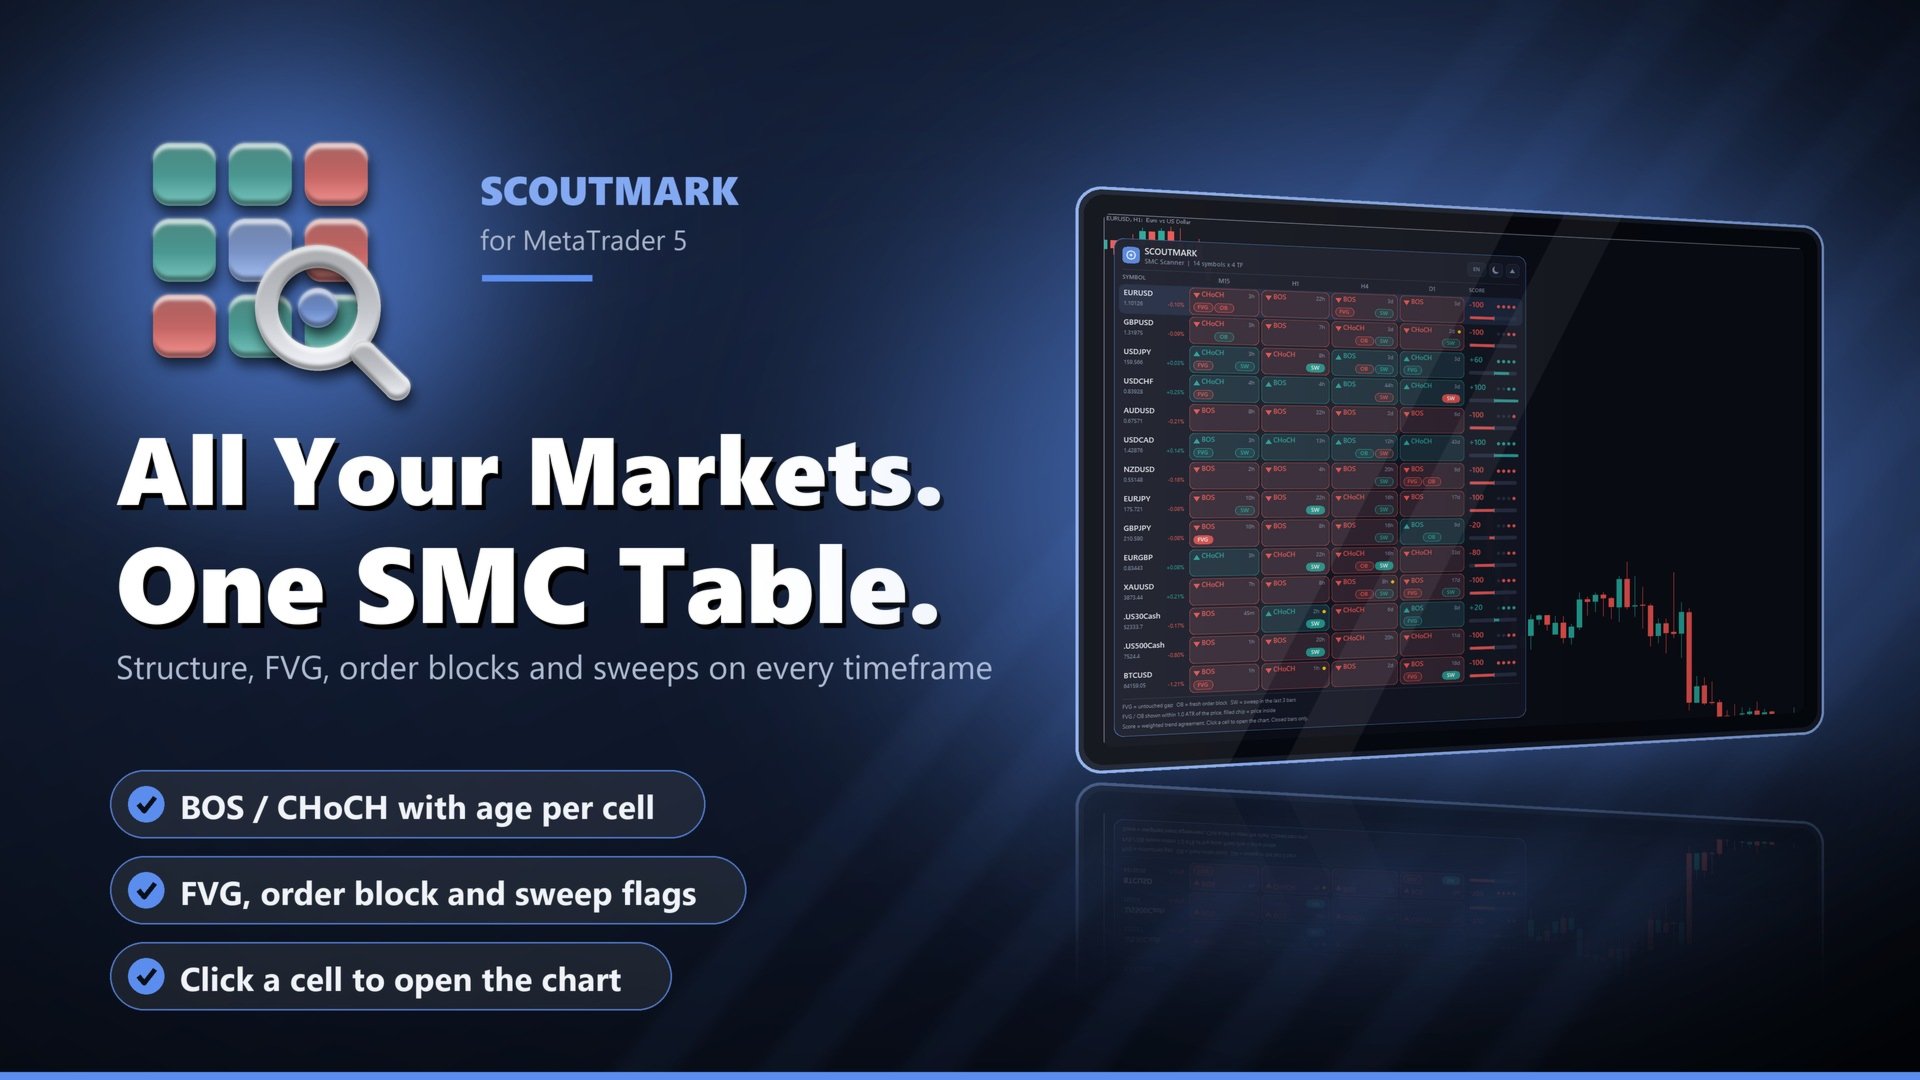
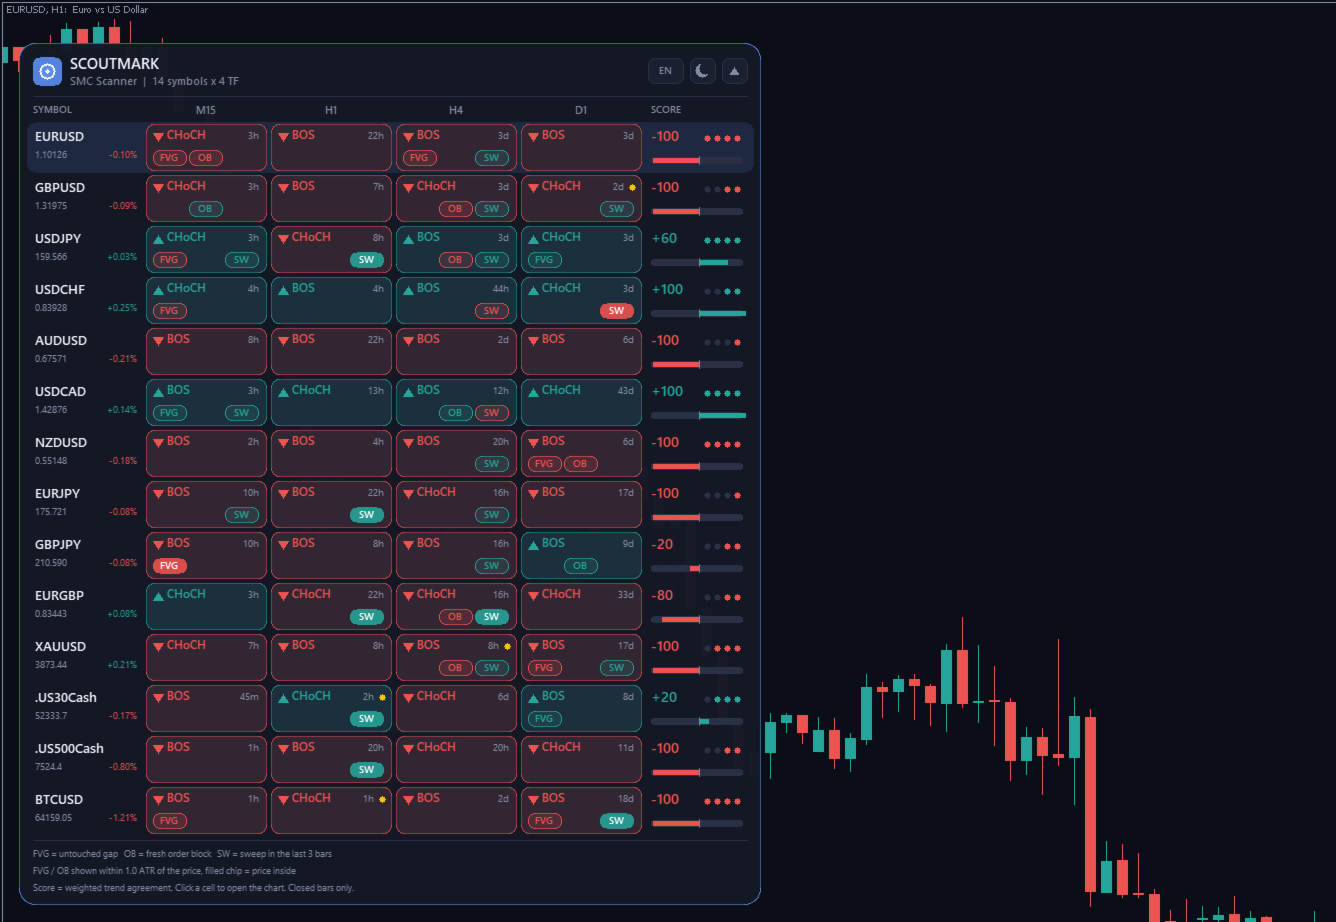
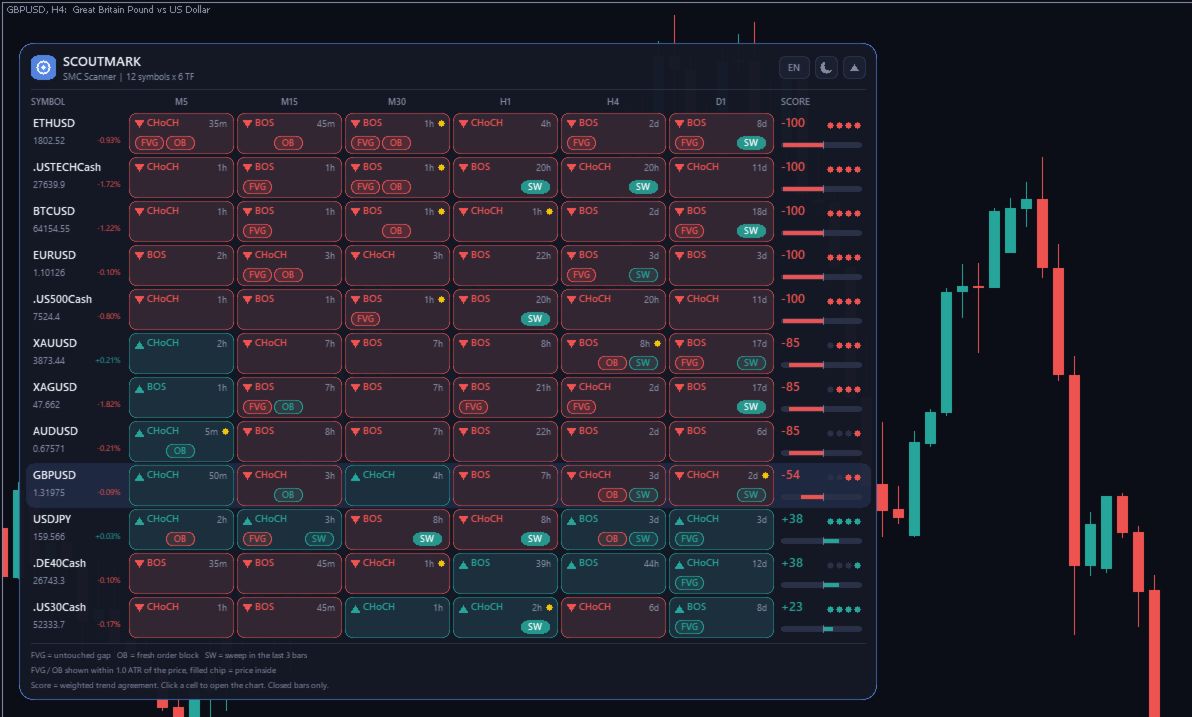
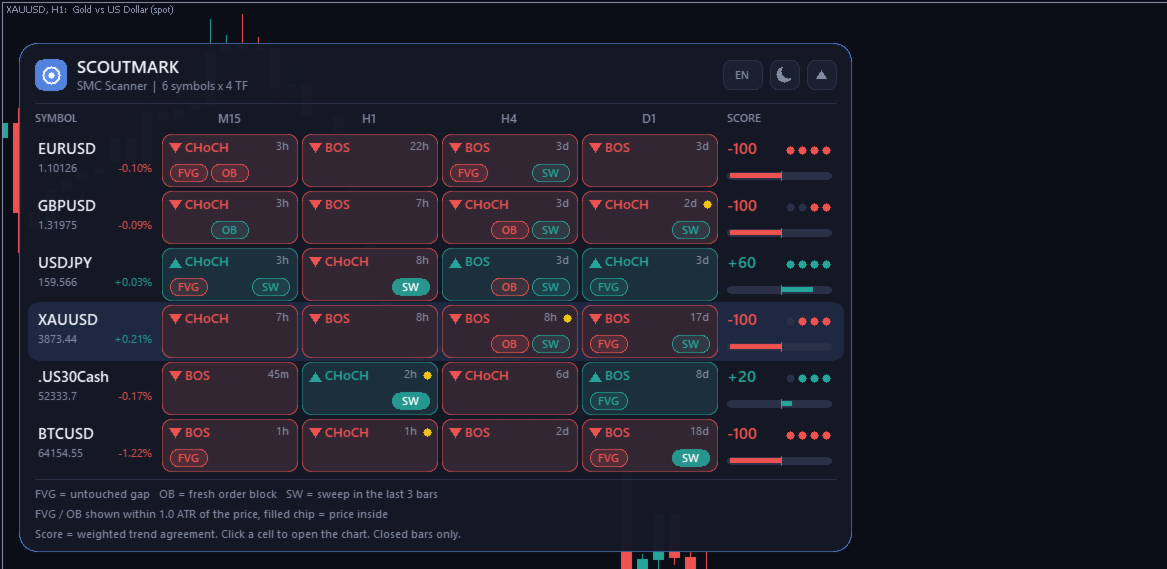
Scoutmark SMC Scanner shows the smart money structure of all your markets in one table. Every row is a symbol, every column a timeframe. Each cell tells you in one look where the structure stands, what is close to the price and whether liquidity was just taken. Click a cell and the chart opens on that symbol and timeframe.
Analysis tool. No signals, no profit promises.
What Every Cell Shows
1. Structure
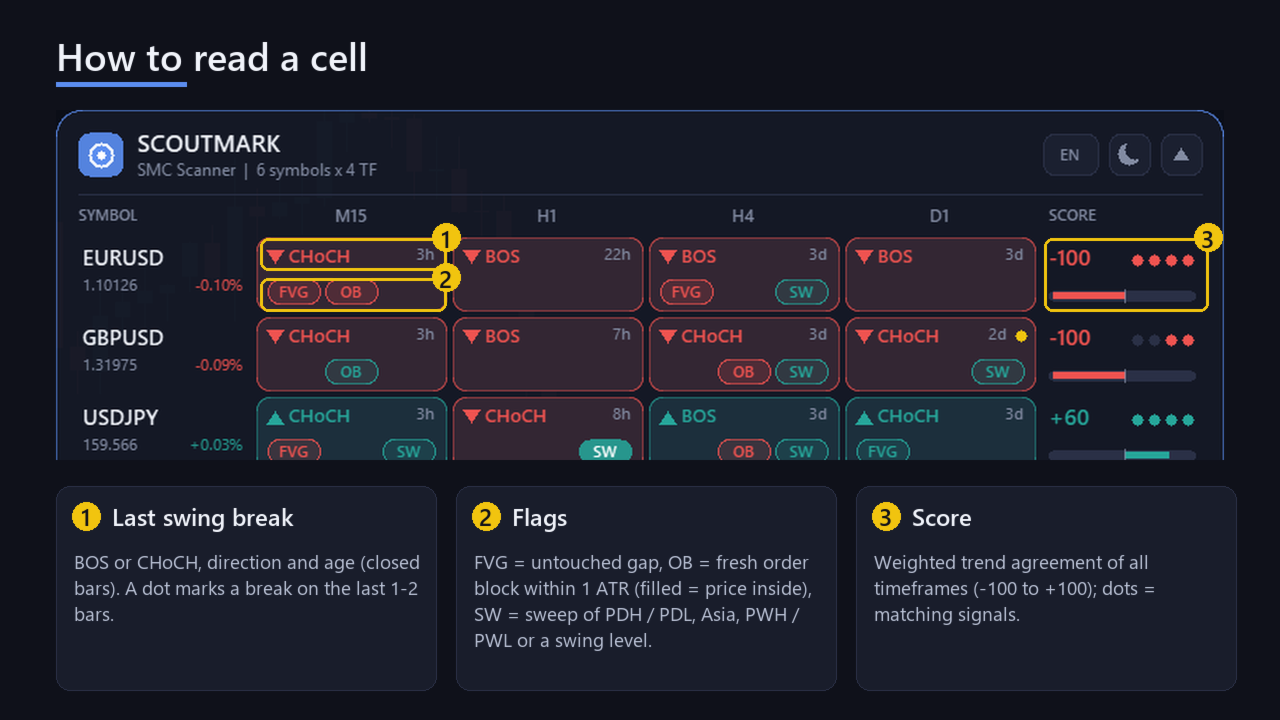
- The last swing break of that timeframe: BOS (break of structure) or CHoCH (change of character), its direction and its age (minutes, hours or days since the break).
- The cell is tinted in the direction of the structure. A small dot marks a break on one of the last two closed bars.
2. Fair value gap (FVG)
- An untouched 3-candle gap (minimum size as a fraction of ATR) within your reach distance of the current price (default 1.0 ATR).
- The chip is filled when the price is inside the gap right now.
3. Order block (OB)
- A fresh, not yet tested order block (last opposite candle of the leg that broke the structure) within reach of the price. Filled = price inside.
4. Liquidity sweep (SW)
- A candle wicks through a liquidity level and closes back. Levels: previous day high / low (PDH / PDL), Asia session high / low (00:00-06:00 GMT, timeframes up to H1), previous week high / low on D1 and above, equal highs / lows and swing highs / lows.
- Shown when the sweep happened in the last N closed bars (default 3). Filled = on the last closed bar.
Score Per Symbol
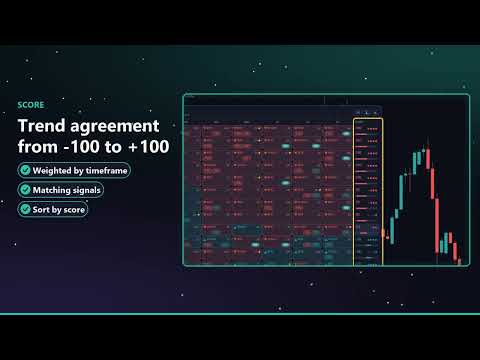
- Weighted trend agreement of all timeframes, from -100 (all bearish) to +100 (all bullish). Higher timeframes weigh more (M15 1, H1 2, H4 3, D1 4).
- Up to four dots show how many signals point the same way: a recent break, an FVG, an order block or a sweep in the direction of the score.
- Optional sorting by score, so the most aligned markets are on top.
- The score describes the current state of the chart. It is not a forecast.
Panel
- Up to 30 symbols (comma separated list, broker prefixes / suffixes such as "EURUSDm" or ".US30Cash" are found automatically, or empty = Market Watch) and up to 6 timeframes from M1 to W1.
- Pages when the list is longer than the rows per page; price and daily change per symbol.
- Click a cell: switch this chart, or open a new chart (your choice). Click the symbol: open it on the current timeframe.
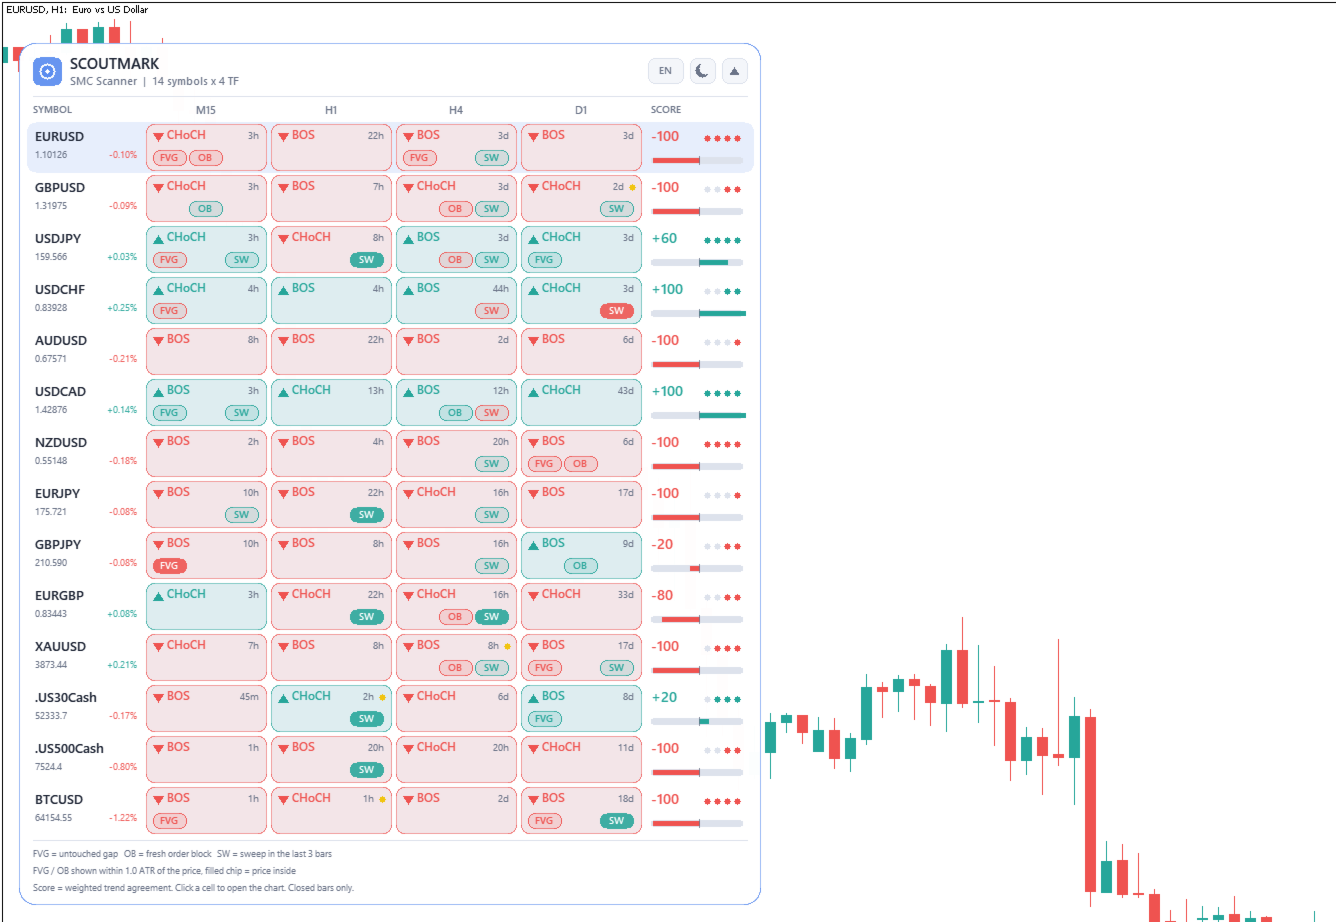
- Dark and light theme (automatic from the chart or by button), English / German (button), size 80-130 %, follows the screen DPI, movable and collapsible.
Alerts
Popup, sound, push and e-mail for a new CHoCH, a new BOS and a new liquidity sweep, on every symbol and timeframe of the table. Each event alerts once, when its bar has closed. A minimum timeframe for alerts can be set (default H1), so lower timeframes do not flood your phone. A sweep of the same level on the next bars is not repeated.
No Repainting On Closed Candles
Every cell is calculated from closed bars of its own symbol and timeframe, each bar once, in time order. A swing point is confirmed N bars later (default 5) and is never moved afterwards. Breaks, gaps, order blocks and sweeps are decided by bar closes. Only the "price inside" flag and the price column use the live price.
Light On Your Terminal
- A cell is recalculated only when a new bar of its timeframe has closed. The work is spread over timer steps (about 40 ms per step), so the chart stays responsive even with 30 x 6 cells. On the demo account a cell took 0.2-0.8 ms on average.
- Missing history is requested from the broker in the background. The cell shows "loading..." until the data is there, and "no data" if the broker does not provide the symbol.
Strategy Tester
In the Strategy Tester only the tested symbol is scanned (on all chosen timeframes). Checked before release on EURUSD H1, XAUUSD M15, GBPJPY M1, USDJPY D1, BTCUSD M5 and in visual mode: all cells loaded, no errors.
Inputs (main)
Symbols, timeframes, rows per page, row order, click action, swing strength (2-20), break confirmation (close or wick), bars per cell (200-2000), FVG minimum size, reach distance (ATR), sweep look-back, recent-break window for the score, server GMT offset (auto), alert types, minimum alert timeframe, popup / sound / push / e-mail, colours.
Good To Know (honest limits)
- An analysis tool. It shows the structure as it is; it does not predict the next move and is not a trading signal. Your decisions stay yours.
- Symbols must exist at your broker. The first load of many symbols can take some seconds while the history is downloaded.
- Asia session levels use a fixed window of 00:00-06:00 GMT; the server offset is detected automatically (can be set by hand).
- Order blocks and gaps are tracked within the analysed bars of each cell (default 500).
- No DLL, no web requests, no trading functions.
Free edition to try first: Scoutmark One (4 symbols, H1 and H4, same look, no alerts).