Tideline Core
- Indicadores
- Versão: 1.0

Currency strength of the 8 major currencies on one timeframe, with an open formula.
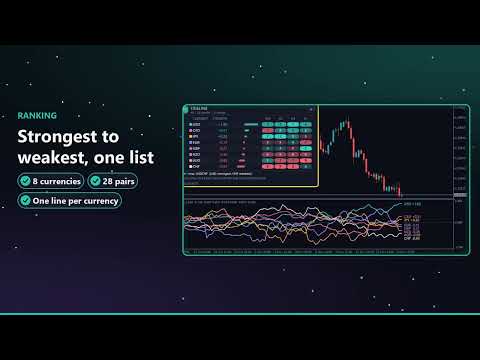
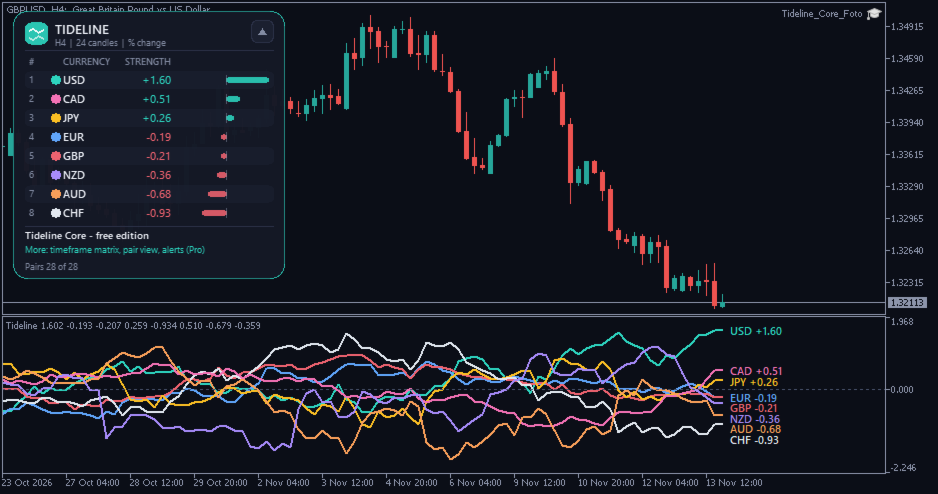
Tideline Core calculates the strength of USD, EUR, GBP, JPY, CHF, CAD, AUD and NZD from the 28 major and cross pairs and draws one line per currency in a sub-window. A panel ranks the eight currencies and shows a bar for each strength value.
It is an analysis tool. It does not open trades and it does not give buy or sell signals.
What you see
- One line per currency in the sub-window, each with its own colour. A label at the right edge shows rank, currency and value; labels move apart so they do not cover each other.
- Ranking panel: rank 1 (strongest) to 8 (weakest), the value and a bar for every currency. It can be collapsed and drawn at 90 to 150 % size. Light or dark colours follow your chart.
- Broker symbols are found automatically, including prefixes and suffixes such as EURUSD.r, EURUSDm or #EURUSD. If a pair is missing at your broker, it is skipped and the panel names the missing pairs.
How it is calculated
For every pair BASE/QUOTE the percent change over the lookback of L candles (default 24) is measured: p = (Close now / Close L candles ago - 1) x 100. The base currency receives +p and the quote currency receives -p. The strength of a currency is the average of these values over all of its pairs (seven pairs when all 28 are available). A currency is therefore strong when it rises against most others. The values are relative: they show how the currencies moved against each other.
No repaint
The value of a closed candle depends only on prices up to that candle (its close and the close L candles before). It is never recalculated afterwards, unless the broker changes its price history. On the running candle the line stays flat at the last closed value. Other symbols are lined up on the time axis of the first available pair, using the last known close.
Quick start
Attach it to any chart of any symbol; the chart only supplies the timeframe. The first start loads the history of up to 28 pairs, so the panel may show "loading history" for a few seconds. Change the lookback in the inputs to make the lines faster or slower.
Editions
This free edition shows 8 currencies on one timeframe. Tideline Currency Strength (Pro) adds a volatility-normalised method, a live candle option, a ranking matrix over four timeframes, a strongest-versus-weakest pair view and alerts for rank changes, crossings and thresholds.
Use in Expert Advisors and other indicators
Buffers 0 to 7 hold the strength of USD, EUR, GBP, JPY, CHF, CAD, AUD, NZD (in this order). Buffers 8 to 15 hold the rank of the same currencies (1 = strongest, 8 = weakest). Empty values mean "no data".
Strategy Tester
The indicator reads other symbols. In the tester the history of those symbols must be available; the tester downloads it on the first run, which can take time, and values may start later. Visual mode draws lines and panel.
FAQ
Why does the panel say "Pairs 24 of 28"? Your broker does not offer all pairs or names them differently. Set prefix and suffix in the inputs if the automatic detection does not find them.
Why do the lines start later than the chart? The number of candles to calculate is an input (default 1,500) and the lookback needs candles before the first value.
Resources: all pairs are read once per new candle, no DLL, no web requests.
Important
An analysis tool, not a signal service. Currency strength describes past price movement and does not predict it. No result is promised. Trading leveraged products carries a high risk of loss.
Input parameters
General: language, candles to calculate (1500), colour theme, label font size (8). Calculation: lookback in candles (24), broker prefix and suffix (empty = automatic). Lines: line width (2), labels on / off. Panel: on / off, start position X / Y, size. Colours: one colour per currency.
Pro edition: Tideline Currency Strength