Anchorline One

One anchor. One band. A clear view.

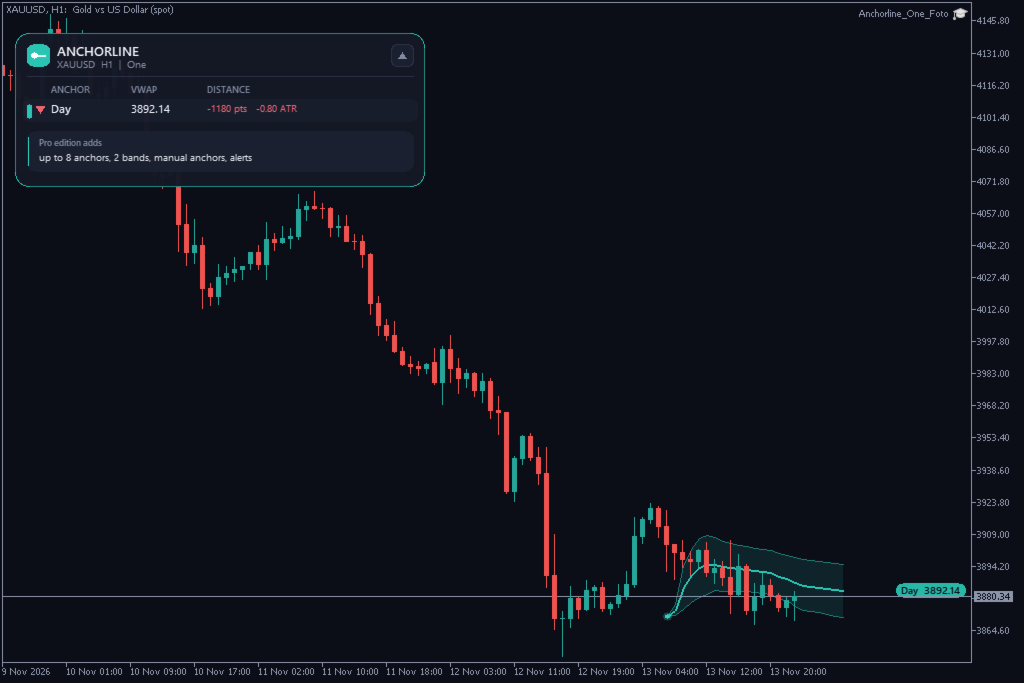
Anchorline One draws one anchored VWAP (volume weighted average price) on your MetaTrader 5 chart and a +/-1 standard deviation band around it. Choose the anchor: start of the day, week or month, or the last swing high or low. A small panel shows the VWAP, whether price is above or below it, and the distance in points and in ATR.

It is an analysis tool. It does not open trades and it does not give buy or sell signals.

What you see

  • One anchored VWAP line with a small dot at the anchor candle and a label at the right edge with the anchor type and the price.
  • A +/-1 standard deviation band with a soft fill.
  • Panel: VWAP, over / under status, distance in points and in ATR(14). Drag it, collapse it, choose 90 to 150 % size. Light or dark colours follow your chart.

How it is calculated

VWAP: the sum of price times volume divided by the sum of volume, from the anchor candle up to the current candle. The price is (High + Low + Close) / 3 by default; (Open + High + Low + Close) / 4, (High + Low) / 2 and Close can be chosen. Volume is tick volume by default; real volume can be chosen. On forex and CFD symbols tick volume describes activity, it is not exchange volume.

Band: the volume weighted standard deviation of the price around the VWAP.

Last swing: a candle whose high (low) is higher (lower) than the N candles before it and not exceeded by the N candles after it (N = strength, default 10). It is confirmed when those N candles have closed. The anchor is the newer of the last swing high and swing low.

No repaint

Each closed candle is added to the running sums exactly once, in time order. The VWAP and band values of a closed candle are never recalculated afterwards (unless the broker changes its price history). A swing anchor appears when the swing is confirmed, N candles after it, and is not moved afterwards. Day, week and month anchors show the current period and start again when a new period begins. Only the right end of the line and the distances in the panel follow the live candle.

Quick start

Attach it to any chart and choose the anchor in the inputs. It works on forex, metals, indices and crypto from M1 to D1.

Pro edition

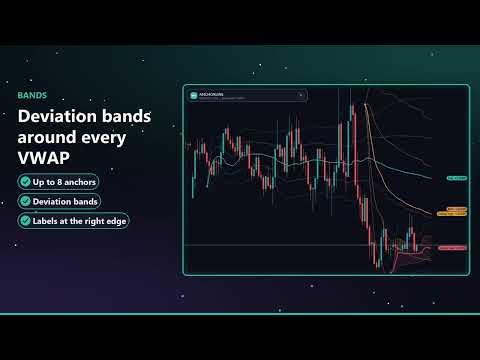
Anchorline Anchored VWAP adds up to 8 anchors at the same time, BOS, CHoCH, session and manual anchors set by click, +/-2 bands, switches per anchor in the panel and alerts.

FAQ

Why does a swing anchor appear a few candles late? A swing is only confirmed when the next N candles have closed.

Why did my day VWAP restart? Day, week and month anchors begin again with every new period.

Does it work in the Strategy Tester? Yes, in visual mode.

Resources: only new closed candles are added to the sums. No DLL, no web requests, no files.

Important

An analysis tool, not a signal service. An average price line and its band describe past price movement and do not predict it. No result is promised. Trading leveraged products carries a high risk of loss.

Input parameters

General: language, candles to load (3000), colour theme, label font size (8), price used (HLC3), volume used (tick). Anchor: day start, week start, month start or last swing, swing strength (10), +/-1 band on / off, fill on / off, line width (2), label on / off. Panel: on / off, start position X / Y, size. Colour: line colour.

Pro edition: Anchorline Anchored VWAP
Mais do autor
Clear structure. Clean gaps. No repaint. Zonecraft Structure is the free edition of Zonecraft SMC Suite. It draws market structure (BOS and CHoCH on swing and internal level), fair value gaps and trading sessions on your MetaTrader 5 chart and adds a small dashboard with the trend on four timeframes and the status of the latest order blocks. Everything is calculated from closed candles only and drawn as soft, semi-transparent zones with small labels that do not cover each other. It is an analysi
FREE
Daymark Session Timer combines three small tools in one light indicator: a countdown to the candle close, the Sydney, Tokyo, London and New York sessions as soft boxes on the chart, and the previous day high and low. A small panel shows the countdown, which session is open, the spread and the server time. The indicator never trades. Two problems it solves 1. Session boxes in the wrong place. Brokers use different GMT offsets and change them with daylight saving, and the cities change on other da
FREE
Magic Atlas Snapshot reads the closed positions of your account and shows net profit, win rate, profit factor, maximum drawdown and expectancy for each EA. It covers the three magic numbers with the most closed positions. It only reads history and places no orders on a live account. Magic Atlas Snapshot is the reduced version of Magic Atlas Journal. Same source, with the extra views and reports removed. Three problems it solves 1. Several EAs on one account and no idea which one earns. 2. Broker
FREE
Fleetdeck Account Overview is the reduced version of Fleetdeck Multi Account Monitor. It shows up to three MetaTrader 5 accounts that run on your computer in one panel on one chart: total equity, profit of the day and week, open profit and a traffic light for each account. It only reads and never opens, closes or changes a trade. Problems it solves You run several terminals and have to switch windows to see how they are doing. An account goes offline or Algo Trading is off after a restart, and y
FREE
Lotwise Risk Console works out the lot size from the risk you choose and the stop loss line you drag on the chart. You click Buy or Sell, and the manager can then look after the open position: break-even, partial closes, trailing, time exit. It never opens a trade by itself. It takes the lot calculation off your hands for every order. Example on a 10,000 USD account: 1 % risk and a stop of 191 points give 0.51 lot on EURUSD. The panel shows the money at risk (97.41 USD) and the possible gain at
Limitline Prop Monitor shows the limits of a funded or challenge account in one foldable panel on the chart and warns you before a limit is reached. If you enable the trade brake or the emergency stop, it can also close trades and delete orders that would break a limit. It does not open trades by itself. The reason I built it: the daily loss limit usually resets at the firm's own time, not at broker midnight, and open stops and pending orders count too. The panel does that arithmetic for you. In
Event Window Manager reads the economic calendar that is already built into your terminal and opens a protection window around important events. Inside the window it can warn you, block new trades, delete and later restore pending orders, and close positions or move them to break-even. Your other EAs can ask for its state through global variables. It needs no DLL, no WebRequest and no website. The calendar comes through your broker connection. One instance on one chart covers the whole account,
Magic Atlas Journal reads the closed positions of your account and sorts them by magic number, symbol, calendar day, weekday and entry hour. You see profit factor, win rate, drawdown and expectancy for each EA without a spreadsheet. It only reads history and places no orders on a live account. I use it when several EAs run on one account and the broker statement only gives one total. A profitable account can hide one EA that has been losing for weeks, and a flat account can hide one that works.
Twinlane Copier copies positions and pending orders from one MetaTrader 5 terminal to one or more other terminals that run on the same PC or VPS. The same EA works as Master or as Slave, and the terminals exchange a small snapshot file in the shared common folder. No DLL, no web request, no account passwords. It is built so that a copied trade is never opened twice: every copy carries the master ticket in its comment, the slave checks open positions and orders before it sends anything, and a sta
Fleetdeck shows the state of every MetaTrader 5 account that runs on your computer in one panel on one chart. You see total equity, profit of the day and week, open risk and the health of each account at a glance, and you get an alert when something is wrong. Fleetdeck only reads. It never opens, closes or changes a trade. Problems it solves You run several terminals (own accounts, funded accounts, demo) and have to switch windows to see how they are doing. An account goes offline, or Algo Tradi
Magic Brake
Markus Hentschel
Magic Brake watches every EA on your account, one row per magic number. It scores each EA from 0 to 100, tells you why, and, if you want it to, brakes only the EA that misbehaves: it closes its new trades, closes all of its trades, or sets the stop loss it forgot. Default mode is warn only. Problems it solves 1. You run five or ten EAs on one account. One of them starts doubling its lot after every loss or piles up a grid, and you only see it when the account equity has already dropped. 2. Some
Twinlane Copier One copies positions from one MetaTrader 5 terminal to one other terminal on the same PC or VPS. The same EA works as Master or as Slave. The terminals exchange a small snapshot file in the shared common folder. No DLL, no web request, no passwords. Twinlane Copier One is the reduced version of Twinlane Copier. It has no time limit. It is limited in these points: One slave account (the master binds itself to the first slave that answers). Lot mode: master lot multiplied by a fact
FREE
Daymark Chart Companion puts the timing of your trading day on the chart: a candle countdown on five timeframes, the four trading sessions with their average range, the levels of the previous day, week and month, today's range against the daily ATR and your own event times. Everything sits in one calm panel and every part can be switched off. The indicator never trades. It is built for traders who plan entries around session opens, candle closes and key levels. Example from the screenshots: GBPU
Clear structure. Clean zones. No repaint. Zonecraft SMC Suite 2.0 draws market structure, order blocks, fair value gaps, liquidity, sessions and premium / discount zones on your MetaTrader 5 chart. Every element follows a written rule, is calculated from closed candles only and is drawn as a soft, semi-transparent zone with a small label that does not cover other labels. A dashboard shows the trend on four timeframes, the nearest zones with their status and the reasons behind them, the running s
Anchored VWAP from structure, time and your own click. Anchorline Anchored VWAP draws up to eight volume weighted average price lines at the same time. Each line starts at a point you choose: the last swing high or low, the last BOS or CHoCH, the start of the day, week or month, the London or New York session start, or a candle you click. Standard deviation bands (+/-1 and +/-2) show how far price has moved away from each average. A compact panel lists every anchor with the distance from price i
Currency strength with an open formula: see which of the 8 major currencies leads and which lags. Tideline Currency Strength calculates the strength of USD, EUR, GBP, JPY, CHF, CAD, AUD and NZD from the 28 major and cross pairs and draws one line per currency in a sub-window. A panel ranks the eight currencies, shows a bar for each strength value and compares the rank on four timeframes (default M15, H1, H4, D1). It also names the pair that combines the strongest and the weakest currency, as a d
Tideline Core
Markus Hentschel
Currency strength of the 8 major currencies on one timeframe, with an open formula. Tideline Core calculates the strength of USD, EUR, GBP, JPY, CHF, CAD, AUD and NZD from the 28 major and cross pairs and draws one line per currency in a sub-window. A panel ranks the eight currencies and shows a bar for each strength value. It is an analysis tool. It does not open trades and it does not give buy or sell signals. What you see One line per currency in the sub-window, each with its own colour. A la
FREE
(Free edition: Pilotdeck One - same panel, risk calculator, one-click trading with drag lines and break-even.) Plan the trade on the chart, see the risk before you click, and let the panel handle the exits. Pilotdeck is a manual trade manager for MetaTrader 5. You drag Entry, Stop Loss and Take Profit lines on the chart; Pilotdeck calculates the lot size from your risk, shows money, percent, R:R and distance live next to each line, and sends the order with one click. After the entry it manages t
Pilotdeck One
Markus Hentschel
Plan the trade on the chart and see the risk before you click. Free. Pilotdeck One is the free edition of the Pilotdeck Trade Manager for MetaTrader 5. You drag Entry, Stop Loss and Take Profit lines on the chart; Pilotdeck One calculates the lot size from your risk, shows money, percent, R:R and distance live next to each line, and sends the order with one click. It only executes what you click or drag. No automatic entry strategy, no grid, no martingale. What you get Modern panel on the chart
FREE
(Free edition: Relaywire Notify - MT5 -> Telegram notifications only, no signal copying.) Read trade signals from Telegram, turn them into orders with your own risk, and get every trade event back on your phone. Relaywire is an Expert Advisor for MetaTrader 5 that connects the terminal with Telegram in both directions: Telegram -> MT5: it reads signal messages, understands BUY / SELL, entry or entry zone, SL, up to 5 targets and management messages ("close half", "SL to entry", "close all", "can
Your MT5 trade events in your own Telegram chat. Relaywire Notify is a free Expert Advisor for MetaTrader 5 that sends trade events of your account to Telegram through your own bot. It does not open, change or close trades on your charts; it only reports. What It Sends Trade opened (direction, lot, symbol, price, SL, TP, ticket, magic, comment). Trade closed with result, distance and reason: take profit hit, stop loss hit, manual, EA, stop out. Partial close. SL / TP modified (bundled per positi
FREE
SHORT (for the product card): Liquidity pools, sweeps with strength, CRT on H1/H4/D1, SMT divergence, FVG and inverse FVG, kill zones - one clean panel, closed bars only. Sweepwell ICT Liquidity Suite marks where liquidity sits on your chart and shows when it is taken. It combines the ICT concepts that are discussed most often today - liquidity pools and sweeps, candle range theory (CRT), SMT divergence and inverse fair value gaps - in one indicator with one calm, readable look. What It Draws 1.
Sweepwell One
Markus Hentschel
SHORT (for the product card): Free liquidity pool and sweep indicator: equal highs / lows, previous day high / low and sweeps with strength, closed bars only. Sweepwell One marks resting liquidity and shows when it is swept - with the same clean look as the full Sweepwell ICT Liquidity Suite. What It Draws Equal highs and equal lows (EQH / EQL): buy-side liquidity above, sell-side liquidity below. Tolerance as a fraction of ATR(14), a dot on every touch. Previous day high and low (PDH / PDL). Li
FREE
Filtro:
Sem comentários
Responder ao comentário