Elsna Ma Cloud
- Indicadores
- Versão: 2.0

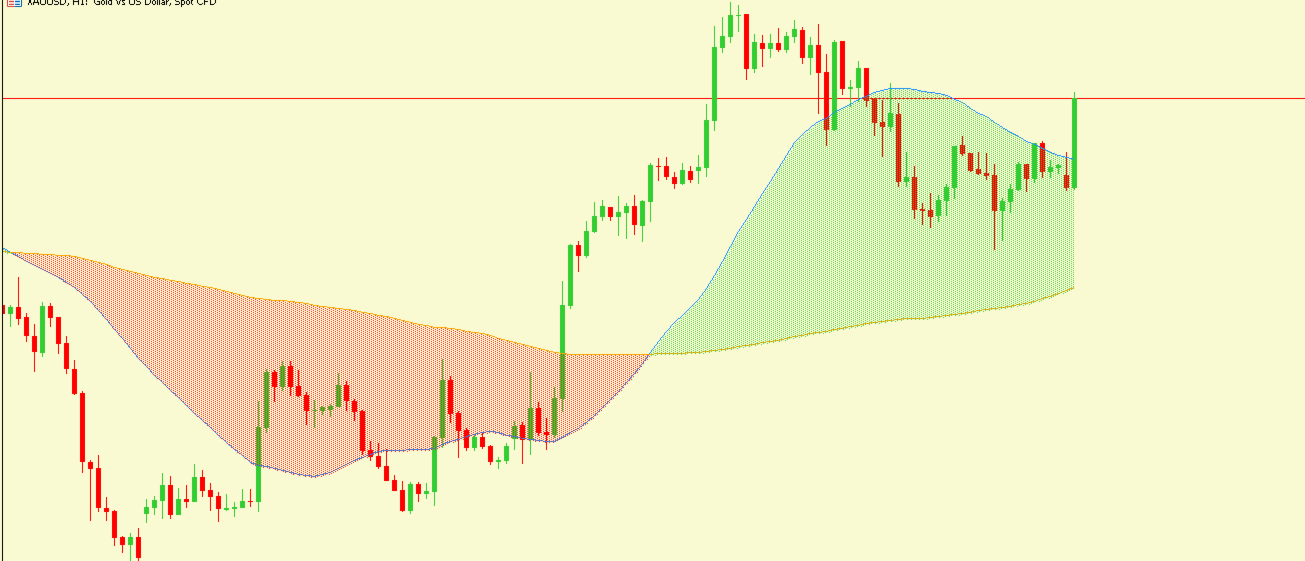
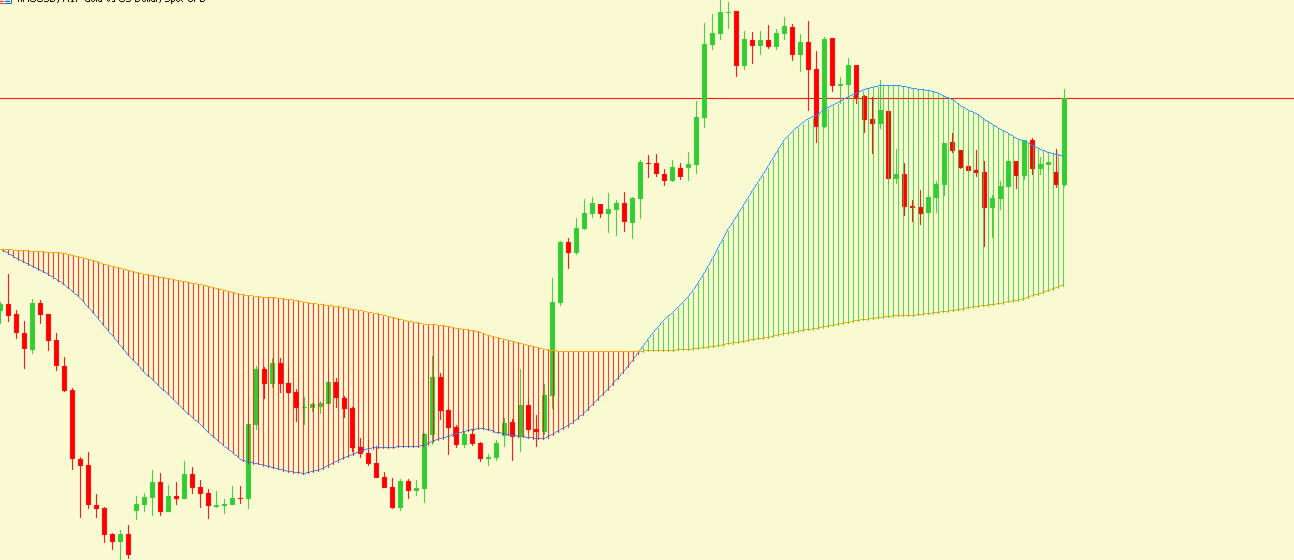
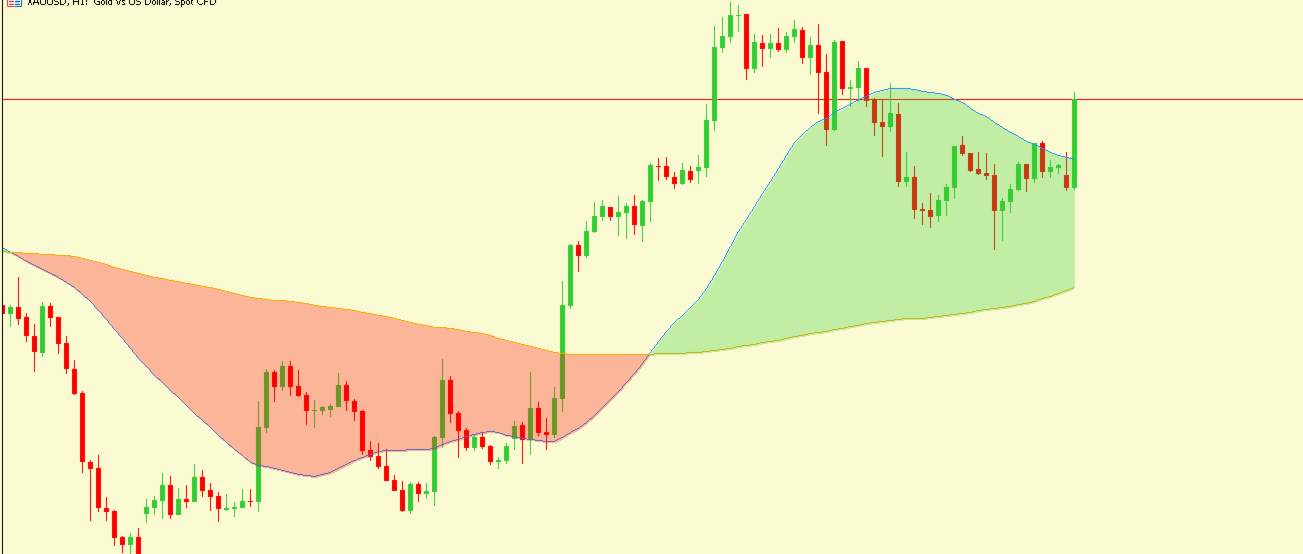
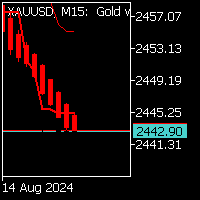
Elsna MA Cloud plots two moving averages on your chart and shades the space between them to show who is winning, the fast MA or the slow one.
What you see
- A fast MA and a slow MA as thin lines, blue and orange. Defaults are 14 and 50 SMA, and the period, method and applied price can be changed for each.
- A shaded cloud between the two lines.
- Green when the fast MA is above the slow MA (bullish).
- Red when the fast MA is below the slow MA (bearish).
- Color switching at crossovers: the cloud changes color at the exact point where the two lines cross, not a bar late.
Fill styles
You pick one with the FillStyle input:
| Style | Look |
|---|---|
| Smooth | Solid, semi-transparent color, like a classic MA cloud |
| Vertical lines | Thin vertical lines across the gap, like in your screenshot |
| Dots | A stippled mesh of dots, offset on alternate columns |