Algorithmic Trio Expert
- Experts
-
Yusuf Levent Aksun
 Platform Engineer e profissional certificado AWS com mais de 20 anos de experiência
em desenvolvimento de software, arquitetura cloud e transformação DevOps.
Atualmente liderando iniciativas de engenharia de plataforma na World Wide Technology - Versão: 3.96
- Ativações: 5
# Algorithmic Trio EA v3.96
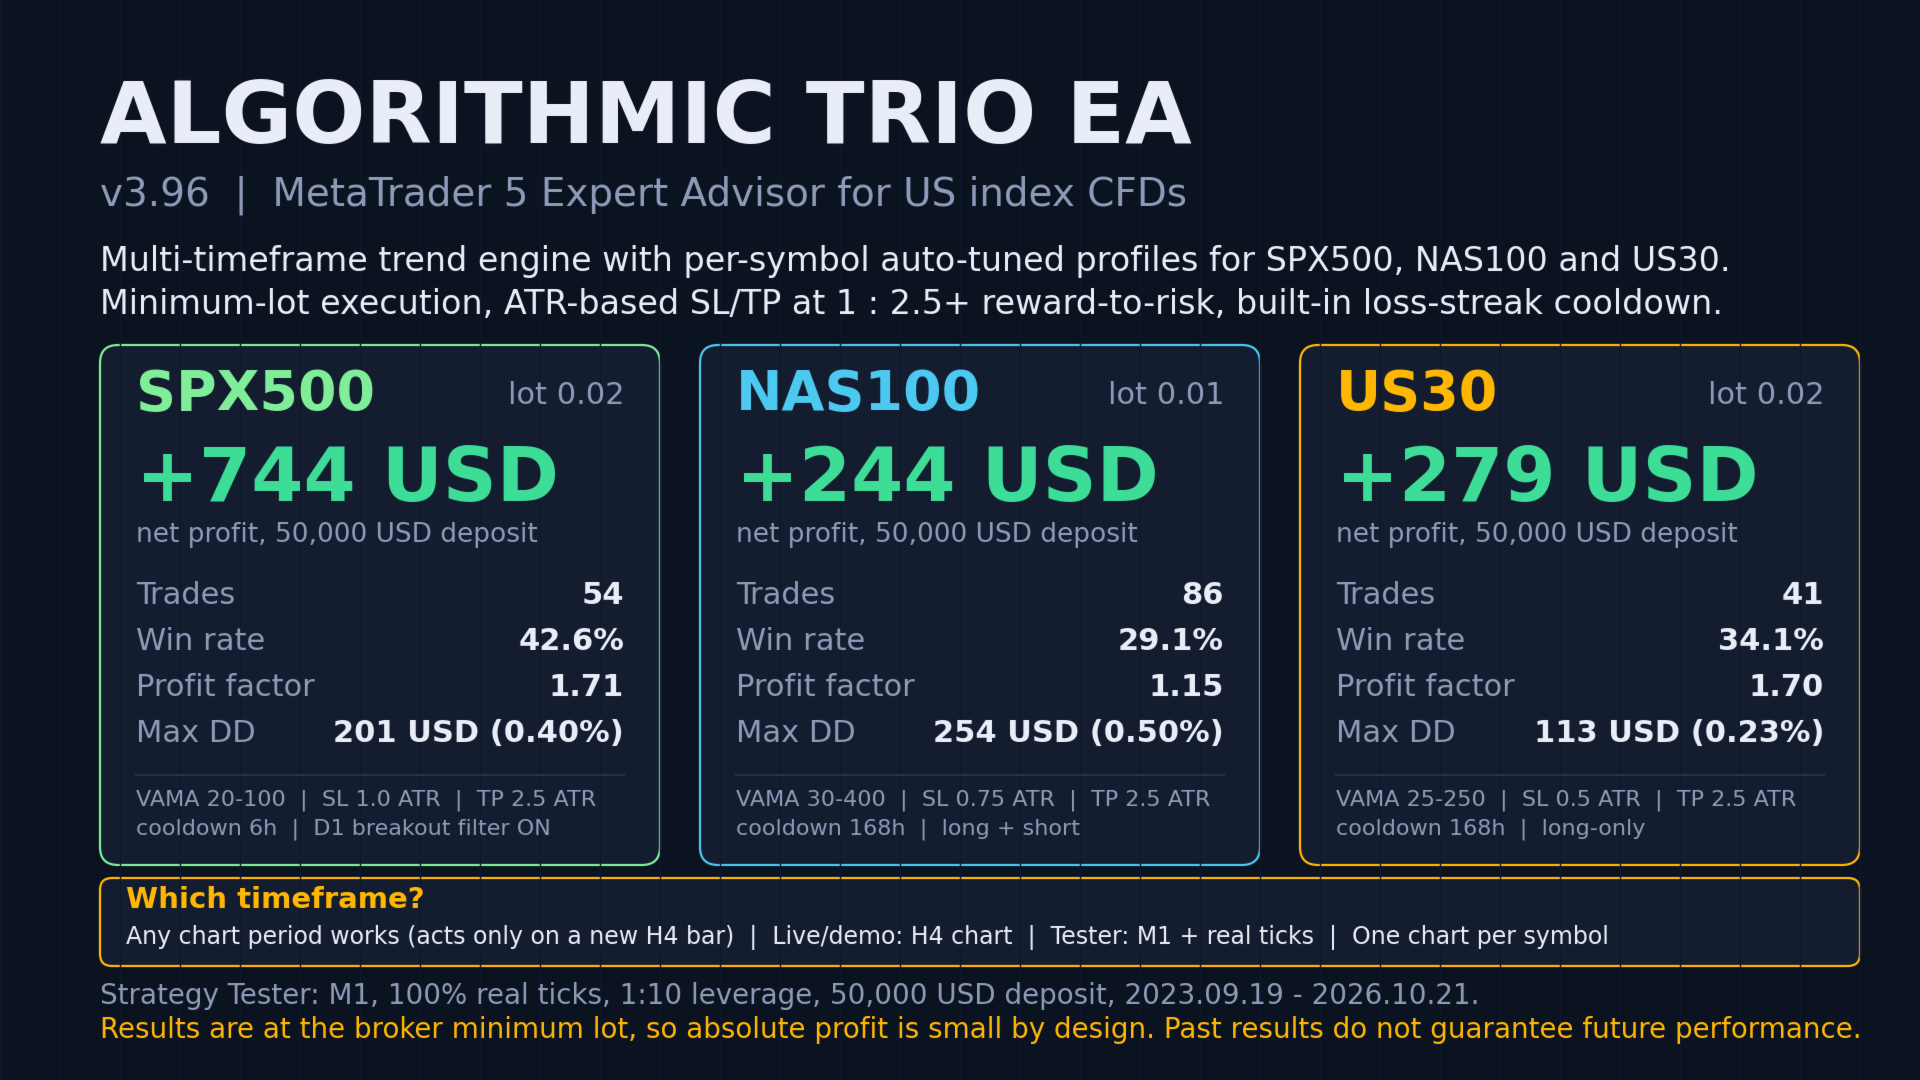
A MetaTrader 5 Expert Advisor that trades US index CFDs (**SPX500, NAS100, US30**) with a multi-timeframe trend engine and a separate, pre-tuned profile for each instrument. It opens one market order at a time at the broker's **minimum lot**, attaches an ATR-based stop-loss and a 2.5 x ATR take-profit, and stops itself after a losing streak.
> **Test it on a demo account first.** The EA places real orders.
---
## What it does
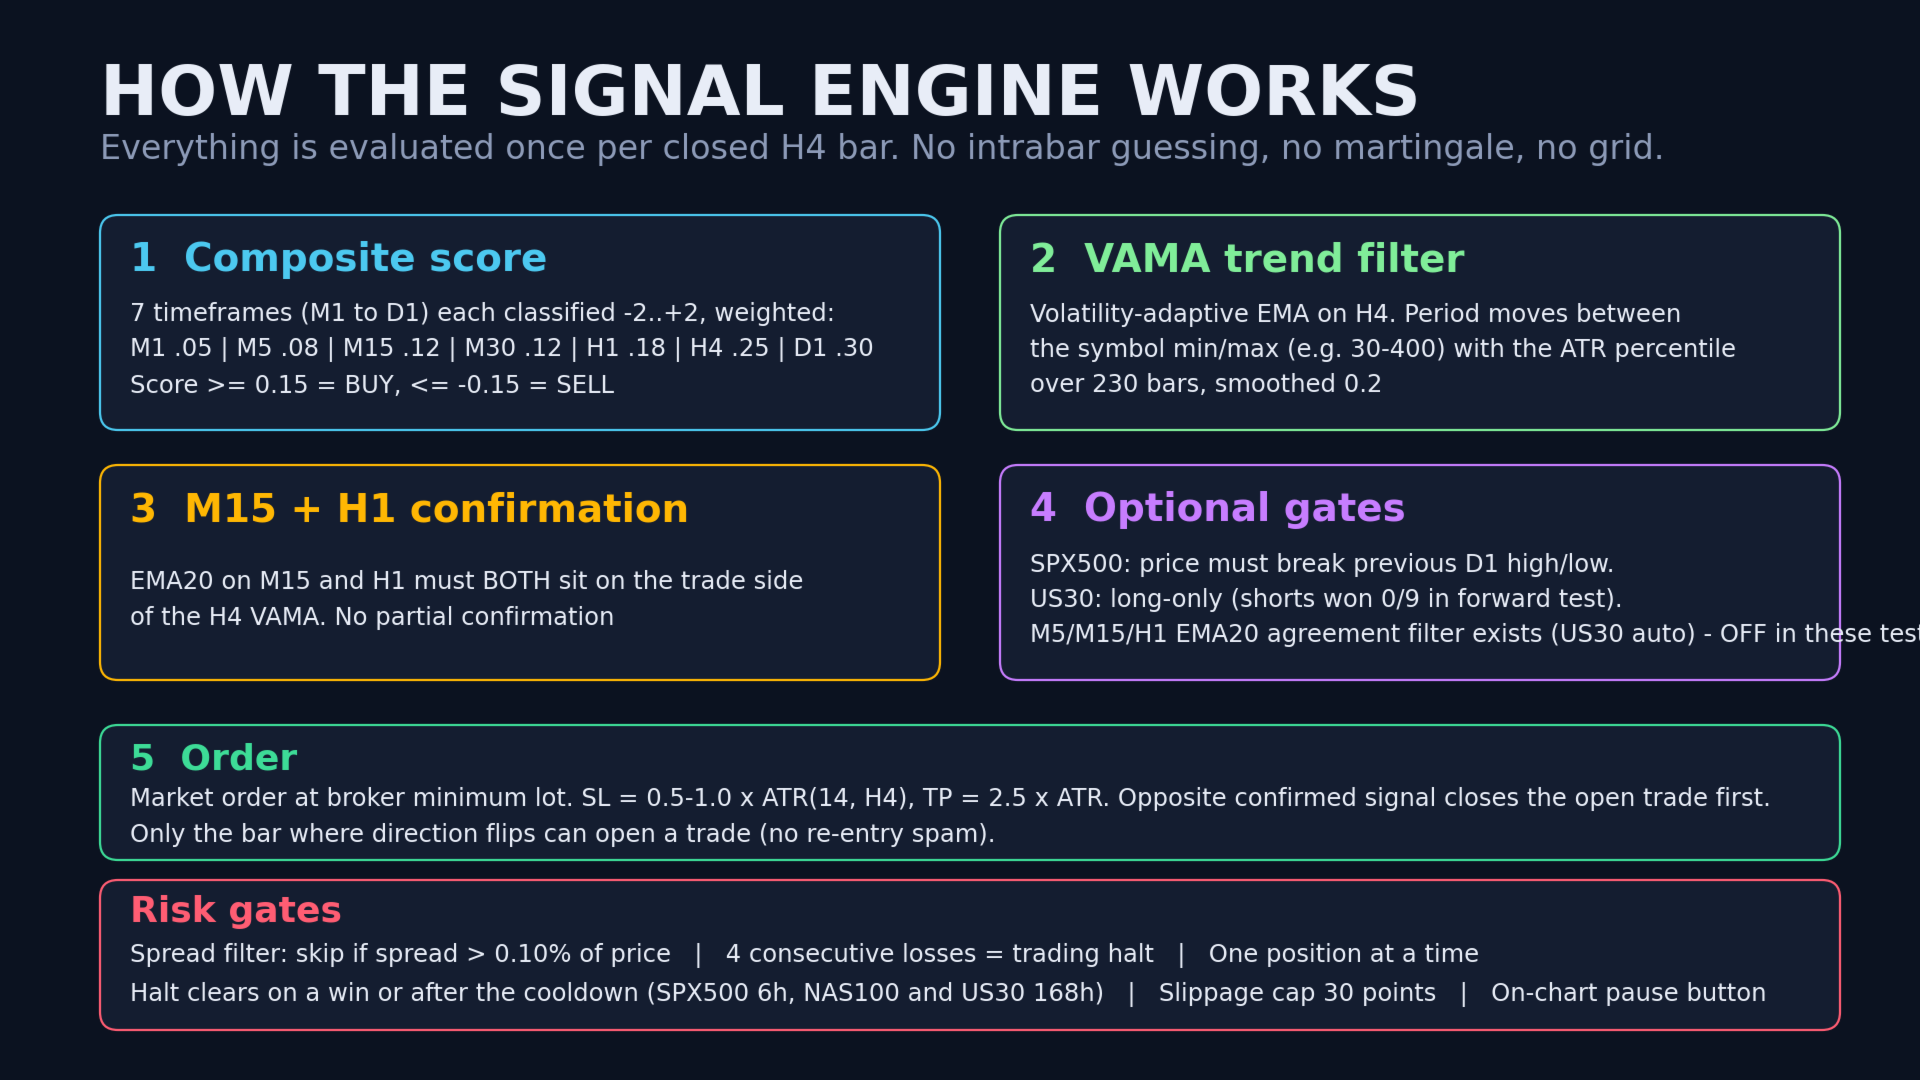
The EA works only on **closed H4 bars**. For each new bar it runs the following pipeline:
1. **Composite score.** Seven timeframes (M1, M5, M15, M30, H1, H4, D1) are each classified from -2 to +2 and combined with weights `0.05 / 0.08 / 0.12 / 0.12 / 0.18 / 0.25 / 0.30`. A score of 0.15 or more is a BUY, -0.15 or less is a SELL, anything between is ignored.
2. **VAMA trend filter.** A volatility-adaptive EMA on H4. Its period moves between a per-symbol minimum and maximum (for example 30-400 on NAS100) based on where the current ATR sits in its last 230 bars, smoothed by 0.2.
3. **M15 + H1 confirmation.** The EMA20 of both M15 and H1 must be on the trade side of the H4 VAMA. There is no partial confirmation.
4. **Optional gates.**
- D1 breakout filter (SPX500 profile): price must already be beyond the previous day's high (BUY) or low (SELL).
- M5/M15/H1 EMA20 agreement (`InpMtfAgree`, new in v3.96, Auto = ON for the US30 profile only). **It was OFF in the backtests below** (`InpMtfAgree=2`).
- Long-only mode (US30 profile): new shorts are blocked.
5. **Order.** Market order at minimum lot. SL = `SLMult x ATR(14, H4)`, TP = `2.5 x ATR`. If the opposite signal is confirmed, the open position is closed first. Only the bar where the direction flips can open a trade, so there is no re-entry spam.
### Risk controls
| Control | Behaviour |
|---|---|
| Spread filter | Skips a trade if spread is above 0.10% of price |
| One position | Never stacks a second trade in the same direction |
| Loss-streak halt | After 4 consecutive losses the EA stops opening trades |
| Cooldown | Halt clears on a win or after the cooldown (SPX500 6 h, NAS100 and US30 168 h) |
| Slippage cap | 30 points |
| Pause button | On-chart Trading ON/OFF switch |
Note: `InpMaxTradesPerDay` is only enforced in Faithful mode, and `InpRiskPercent` / `InpLotSize` are no longer used since v3.95 (lot is always the broker minimum).
### Per-symbol profiles (applied automatically when `InpAutoSymbolProfile = true`)
| Symbol | VAMA min-max | SL | TP | Cooldown | D1 filter | Long-only |
|---|---|---|---|---|---|---|
| SPX500 | 20-100 | 1.0 ATR | 2.5 ATR | 6 h | ON | No |
| NAS100 | 30-400 | 0.75 ATR | 2.5 ATR | 168 h | OFF | No |
| US30 | 25-250 | 0.5 ATR | 2.5 ATR | 168 h | OFF | **Yes** |
Aliases such as US500, US100, USTEC, NDX, DJ30 and WS30 are recognised. Any other symbol uses the manual inputs.
---
## Backtest results
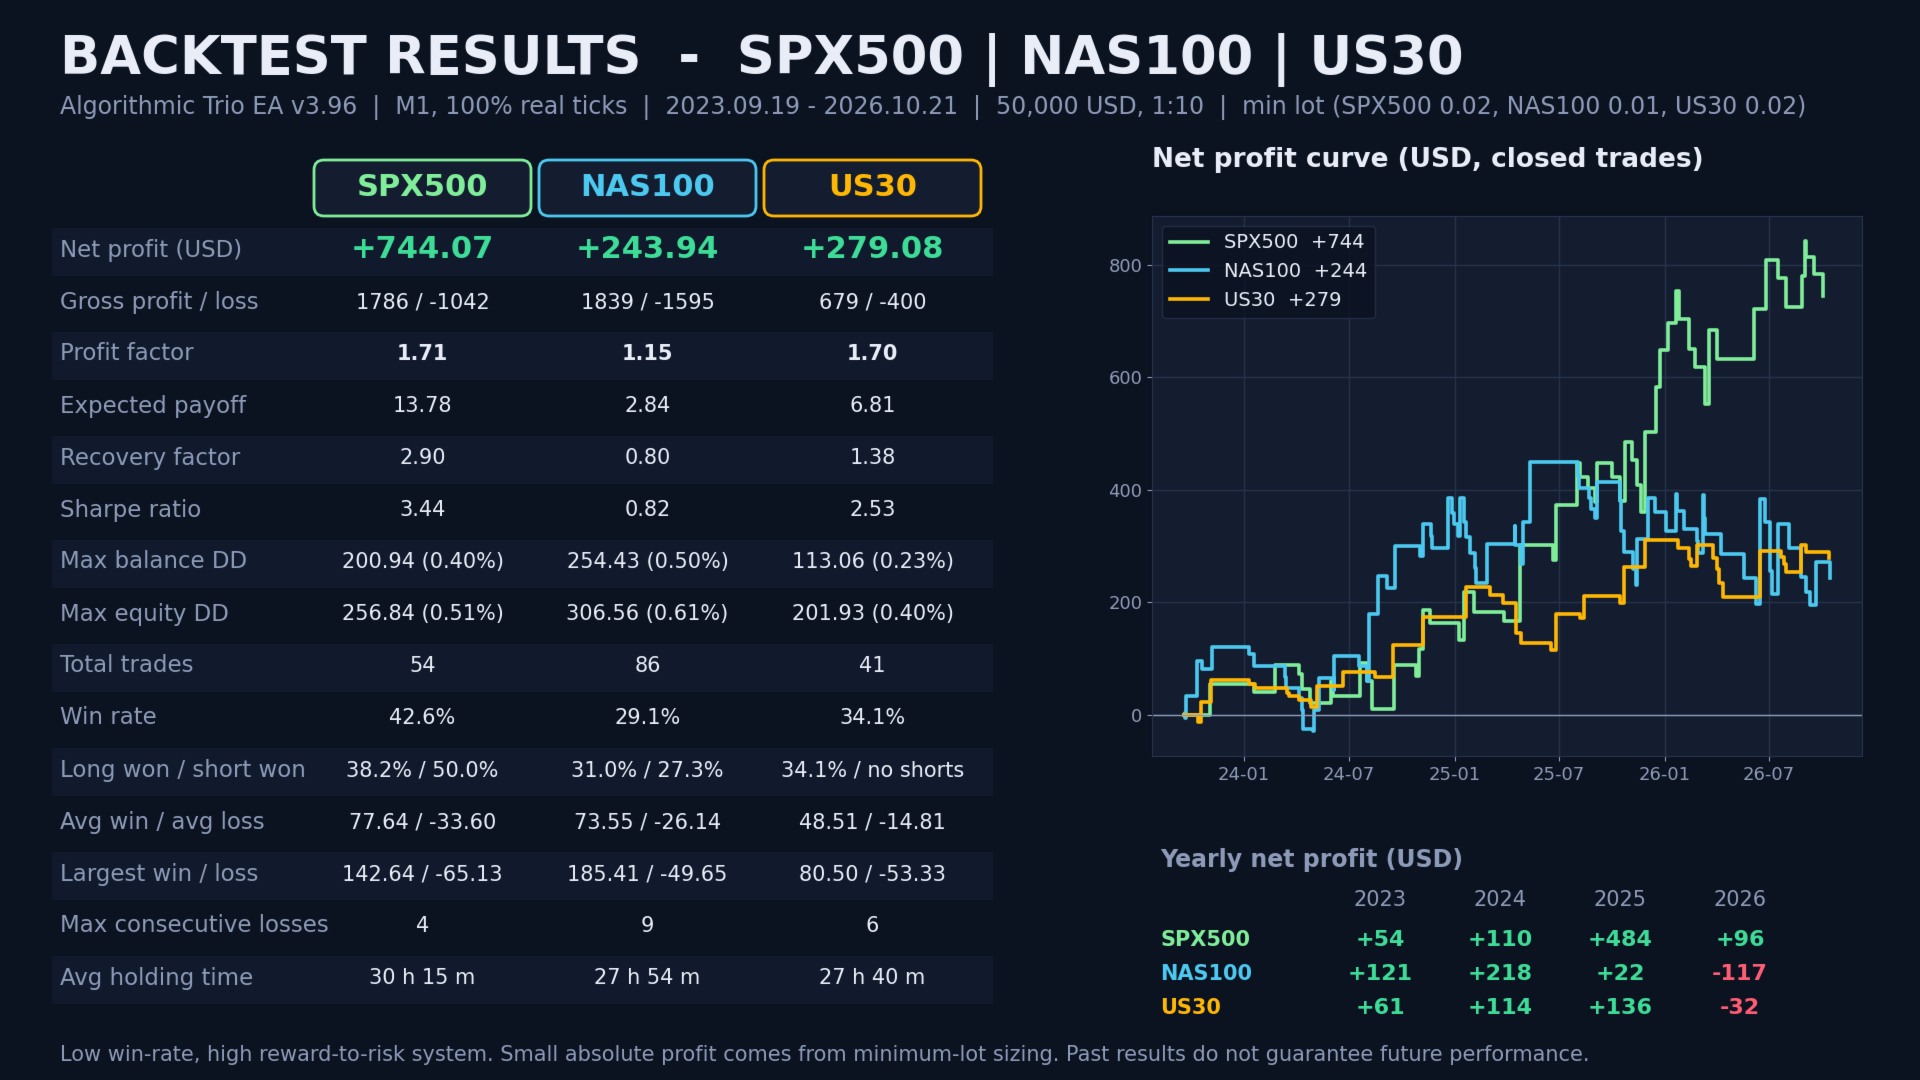
MT5 Strategy Tester, **M1, 100% real ticks**, 1:10 leverage, 50,000 USD deposit, 2023.09.19 - 2026.10.21, default inputs with auto profile on.
| | SPX500 | NAS100 | US30 |
|---|---|---|---|
| Lot used | 0.02 | 0.01 | 0.02 |
| Net profit | **+744.07** | **+243.94** | **+279.08** |
| Total trades | 54 | 86 | 41 |
| Win rate | 42.6% | 29.1% | 34.1% |
| Profit factor | 1.71 | 1.15 | 1.70 |
| Recovery factor | 2.90 | 0.80 | 1.38 |
| Sharpe ratio | 3.44 | 0.82 | 2.53 |
| Max balance drawdown | 200.94 (0.40%) | 254.43 (0.50%) | 113.06 (0.23%) |
| Max equity drawdown | 256.84 (0.51%) | 306.56 (0.61%) | 201.93 (0.40%) |
| Avg / max hold time | 30 h / 131 h | 28 h / 230 h | 28 h / 102 h |
| Longest losing streak | 4 | 9 | 6 |
**Read these numbers honestly.** Profit is small in absolute terms because the EA trades the minimum lot on a 50,000 USD account (about 0.5% to 1.5% over three years). The strategy is a low-win-rate, high-reward-to-risk system: most trades lose a little and a few win about 2.5 times the risk. NAS100 is the weakest of the three (profit factor 1.15, and it is down 117 USD in 2026 so far). US30 profit comes entirely from long trades by design.
---
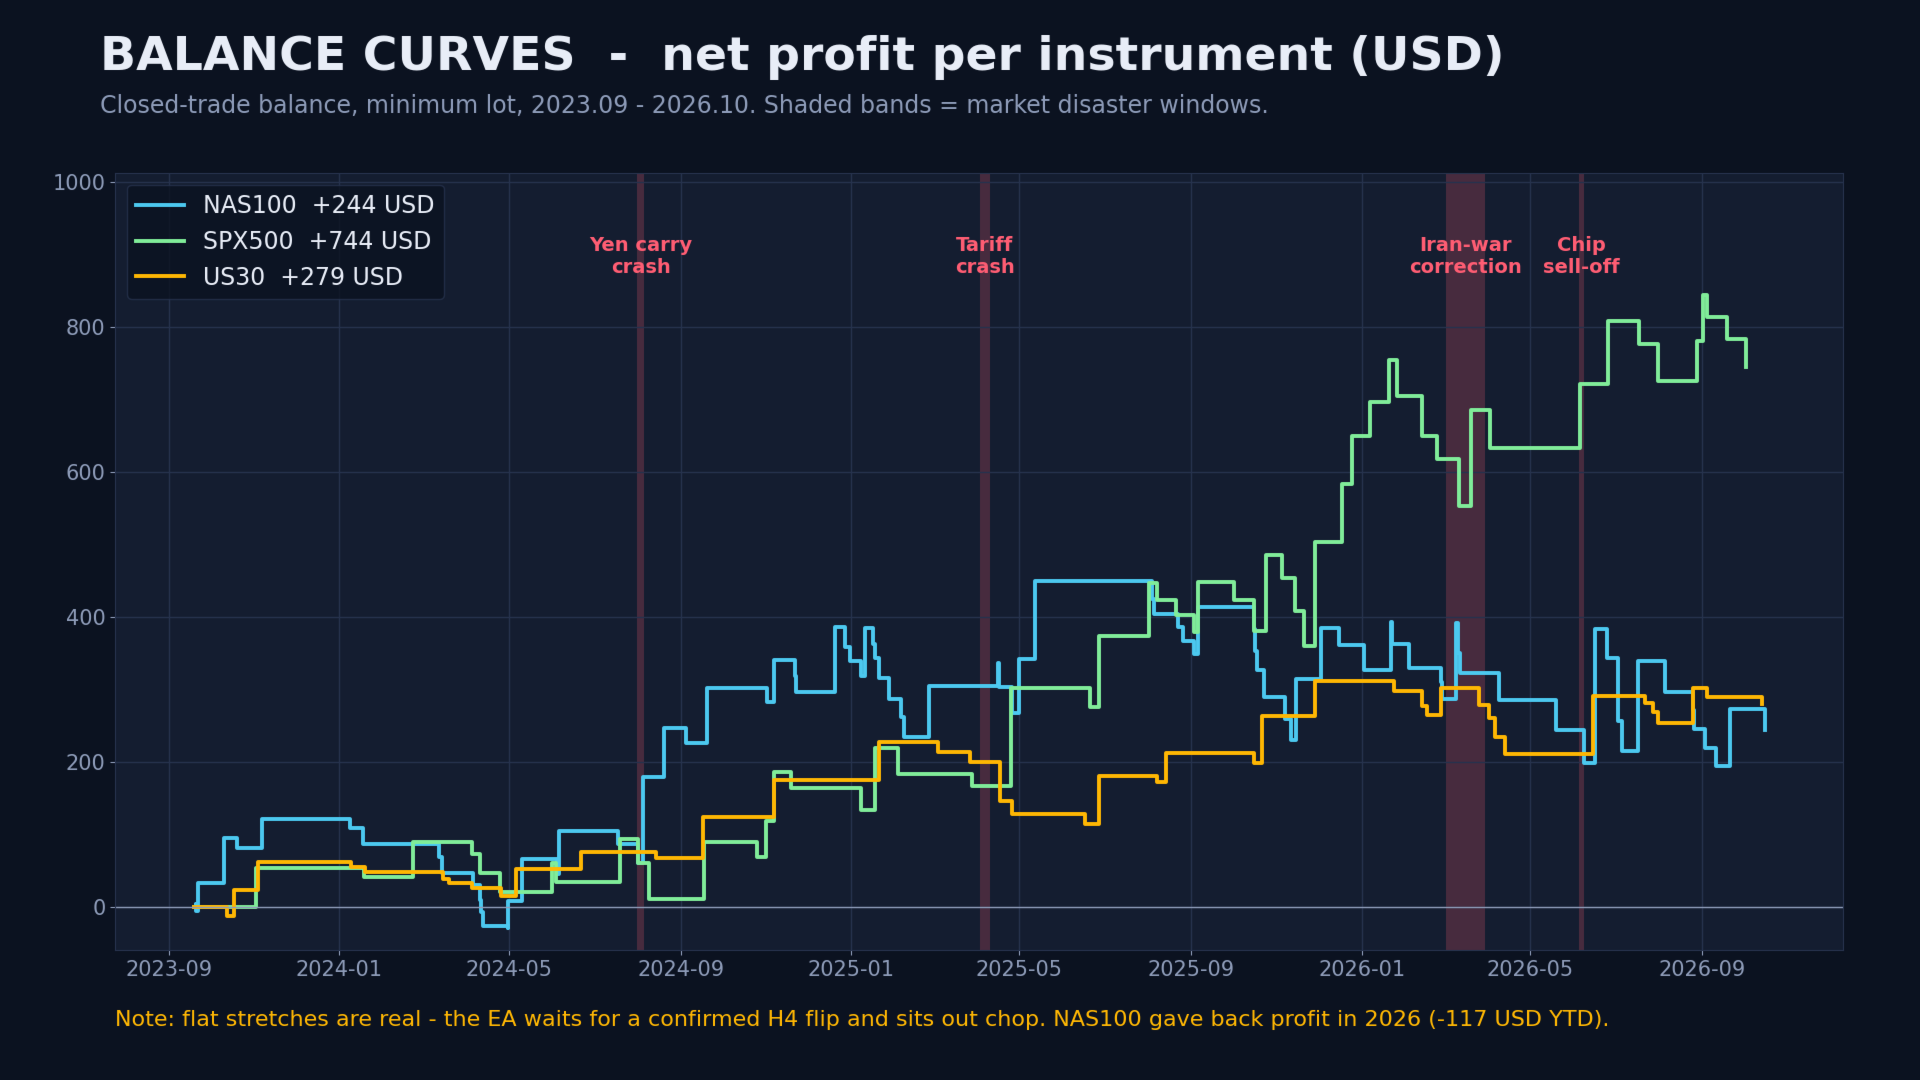
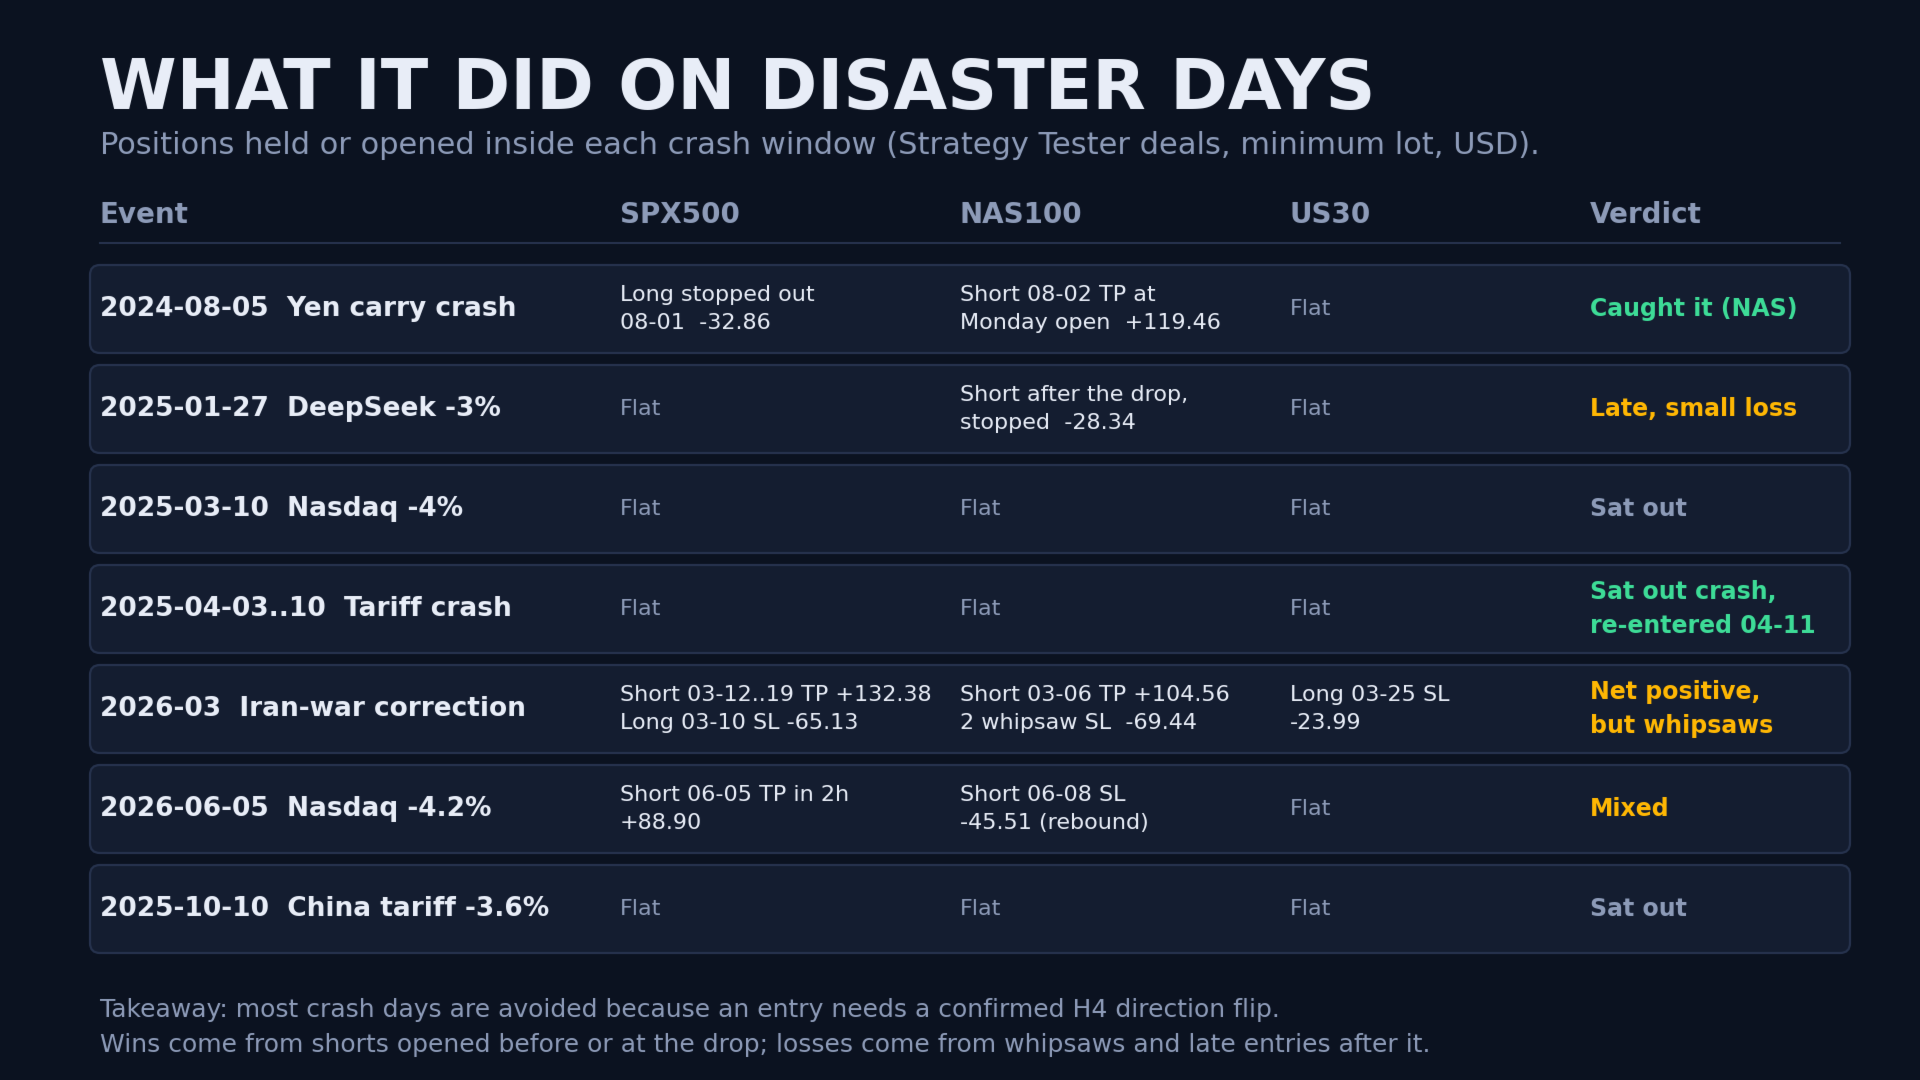
## What it did on disaster days
Crash dates come from public market news; the EA's activity comes from the Strategy Tester deal lists. All amounts are USD at minimum lot.
| Event | SPX500 | NAS100 | US30 | Summary |
|---|---|---|---|---|
| 2024-08-05 Yen carry-trade crash | Long stopped out 08-01 (-32.86) before the crash | **Short opened 08-02 hit TP at the Monday open (+119.46)** | Flat | Caught the move on NAS100 |
| 2025-01-27 DeepSeek sell-off | Flat | Short opened after the drop, stopped (-28.34) | Flat | Late entry, small loss |
| 2025-03-10 Nasdaq -4% | Flat | Flat | Flat | Sat out |
| 2025-04-03 to 04-10 Tariff crash | Flat | Flat | Flat | Sat out the whole crash |
| 2025-10-10 China tariff threat | Flat | Flat | Flat | Sat out |
| 2026-03 Iran-war correction | Short 03-12 to 03-19 TP **+132.38**; long 03-10 SL -65.13 | Short 03-06 TP **+104.56**; two whipsaw stops (-69.44) | Long 03-25 SL (-23.99) | Net positive, but with whipsaw losses |
| 2026-06-05 Nasdaq -4.2%, chips -10% | **Short opened 06-05 hit TP two hours later (+88.90)** | Short 06-08 stopped on the rebound (-45.51) | Flat | Mixed |
What this shows:
- **The EA is usually flat on crash days.** An entry needs a confirmed H4 direction flip, so a sudden one-day collapse often passes without a position. That avoids the worst gaps, but it also means the EA does not profit from most crashes.
- **When it is short before or at the drop, it pays well.** The three biggest crash-related winners are NAS100 Aug 2024 (+119.46), SPX500 Mar 2026 (+132.38) and NAS100 Mar 2026 (+104.56).
- **The damage comes after the crash.** Stops are hit in the sharp rebounds and chop that follow: SPX500 long on 2026-03-10 (-65.13, its worst trade), NAS100 short on 2026-06-08 (-45.51), and **US30 long opened 2025-04-11 and stopped on 04-17 (-53.33, the worst US30 trade)**, entered right after the tariff-crash rebound.
- **Hard stops cap each loss.** The largest single loss on any instrument was 65.13 USD (SPX500), against an account of 50,000 USD.
---
## Which chart timeframe to use
The chart timeframe does not matter. The EA reads M1 to D1 internally and acts only when a new **H4** bar opens, so it behaves the same on any chart period.
- **Live / demo:** use an H4 chart. It is the easiest to read next to the on-chart panel.
- **Strategy Tester:** use **M1** with **Every tick based on real ticks**. The tester period is only the simulation resolution, and tick-level data is needed for accurate SL/TP fills.
- **One chart per symbol:** attach the EA to SPX500, NAS100 and US30 separately. The same magic number can be shared because positions are checked per symbol.
- **Symbol names:** aliases such as US500, USTEC, NDX, DJ30 and WS30 are recognised. Check that the panel shows the tuned profile as active; otherwise the manual inputs are used.
- **History:** make sure enough history is loaded (up to 400 H4 bars for the VAMA plus ATR history, and the M15/H1/D1 data). Scroll through each timeframe once on a new chart to download it.
---
## Key inputs
| Input | Default | Meaning |
|---|---|---|
| `InpAutoSymbolProfile` | true | Apply the tuned per-symbol profile |
| `InpFaithfulMode` | false | true = reproduce the original script's fixed rules |
| `InpTPMultiplier` | 2.5 | Take-profit in ATR |
| `InpMaxSpreadPercent` | 0.10 | Max spread as % of price |
| `InpMaxConsecLosses` | 4 | Losses in a row before the halt |
| `InpFlexibleCooldownHours` | 96 | Fallback cooldown (overridden per symbol) |
| `InpMtfAgree` | Auto | M5/M15/H1 EMA20 agreement filter |
| `InpLongOnly` | false | Block new shorts on this chart |
| `InpWriteLog` | true | Write `VAMA_EA_Trade_Log.csv` |
| `InpMagicNumber` | 20260824 | Order identifier |
---
## Limitations
- Only 41 to 86 trades per symbol over three years: the sample is small, so the statistics are noisy.
- Per-symbol parameters were optimised on historical data. Out-of-sample behaviour can be worse.
- US30 is long-only because shorts lost in its forward test; this can hurt in a prolonged downtrend.
- Results use one broker's data and spreads (100% real ticks). Live execution will differ.
- This document is a description of a software tool, not investment advice. Trading leveraged CFDs carries a high risk of loss.