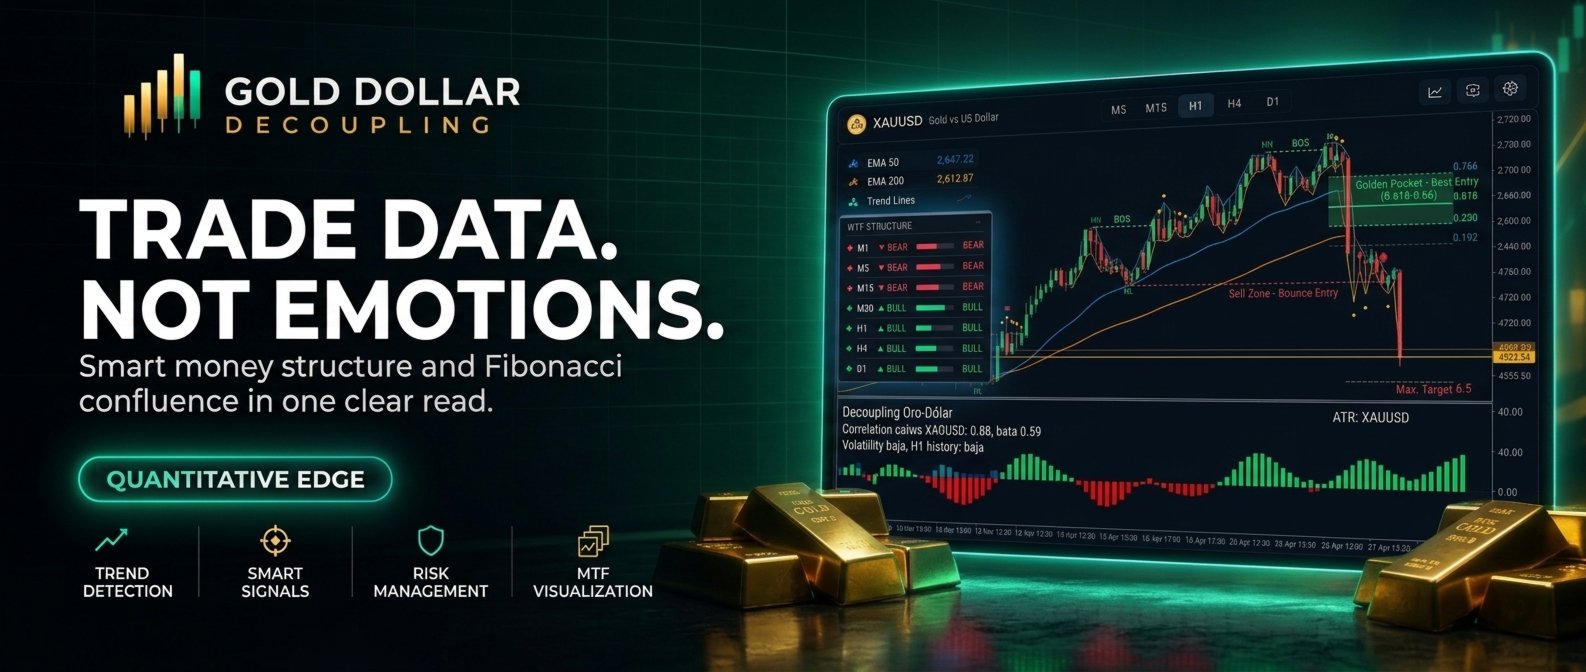
Gold Dollar Decoupling
- Indicadores
- Versão: 2.0
- Ativações: 5

The advantage most indicators ignore: Intermarket data.
Almost every market indicator does the exact same thing: it takes historical price data from the chart, applies a mathematical formula (a moving average, a momentum calculation, a channel), and displays it in a different color. The problem is that price in isolation tells only half the story.
If you trade Gold (XAUUSD), you know it doesn't move in a vacuum. It moves in a constant dance with the US Dollar. The true institutional edge lies not in guessing whether the price has crossed a moving average, but in detecting **when gold breaks away from its natural valuation and begins to move independently**.
That is where the Gold-Dollar Decoupling tool comes in.
What is it really about?
This is neither a miracle bot nor a "magic arrow" generator. It is a quantitative intermarket analysis tool.
Instead of cluttering your chart with lines and colors, it works in the background, comparing 1-hour Gold candles against the US Dollar Index (DXY) in real time:
1. Calculates the real relationship: It runs a 200-hour rolling linear regression to understand how much of Gold's movement is "normal" relative to the Dollar's behavior.
2. **Isolates independent movement:** It filters out Dollar-related noise and measures Gold's pure strength accumulated over the last 12 hours.
3. Measures the anomaly ($Z$-Score): When this independent strength exceeds 2 standard deviations ($\pm 2.0$), the algorithm identifies a statistical decoupling.
4. Defines a trading window: It projects a 12-hour directional bias window with a wide protective Stop Loss
No frills, no repainting
No traditional indicators: It does not use EMAs, RSI, candlestick patterns, or hand-drawn support lines. It provides fresh data that your other tools cannot see. Strict reliability: It operates exclusively based on closed candles. What you see in the history reflects exactly how it performed in real time.
Quality over quantity:It is designed to be highly selective, generating an average of 1 to 2 signals per week. If you are looking to trade 20 times a day, this tool is not for you.
Things to consider before using it
It is an intraday indicator: Its effectiveness has been measured on timeframes ranging from M1 to H1. It is not designed for daily charts.
It requires a reference asset: Your platform must have access to the US Dollar Index symbol (DXY, USDX, or DX).
Managing expectations:** There will be weeks when the analysis is flawless yet the indicator remains silent. Its purpose is not to provide constant action, but to alert you when a quantitative anomaly exists in your favor.