Pivot Points Panel
- Indicadores
- Versão: 1.0

Pivot Points MTF — Multi-Method Multi-Timeframe Pivot Panel
**Four pivot systems. Three timeframes. One draggable, collapsible panel.
Switch on the fly, right on the chart, without touching Inputs.**
Pivot points are one of the oldest tools in trading — originally used by
floor traders to plan their session before the open, still used today by
day traders, prop desks, and algo systems alike as objective, non-repainting
reference levels: everyone looking at the same OHLC data arrives at the
same numbers. This indicator puts all four major pivot methods in one
place, so you stop switching indicators when the market's personality
changes — you just switch the button.
## The four methods, and when each one actually earns its keep
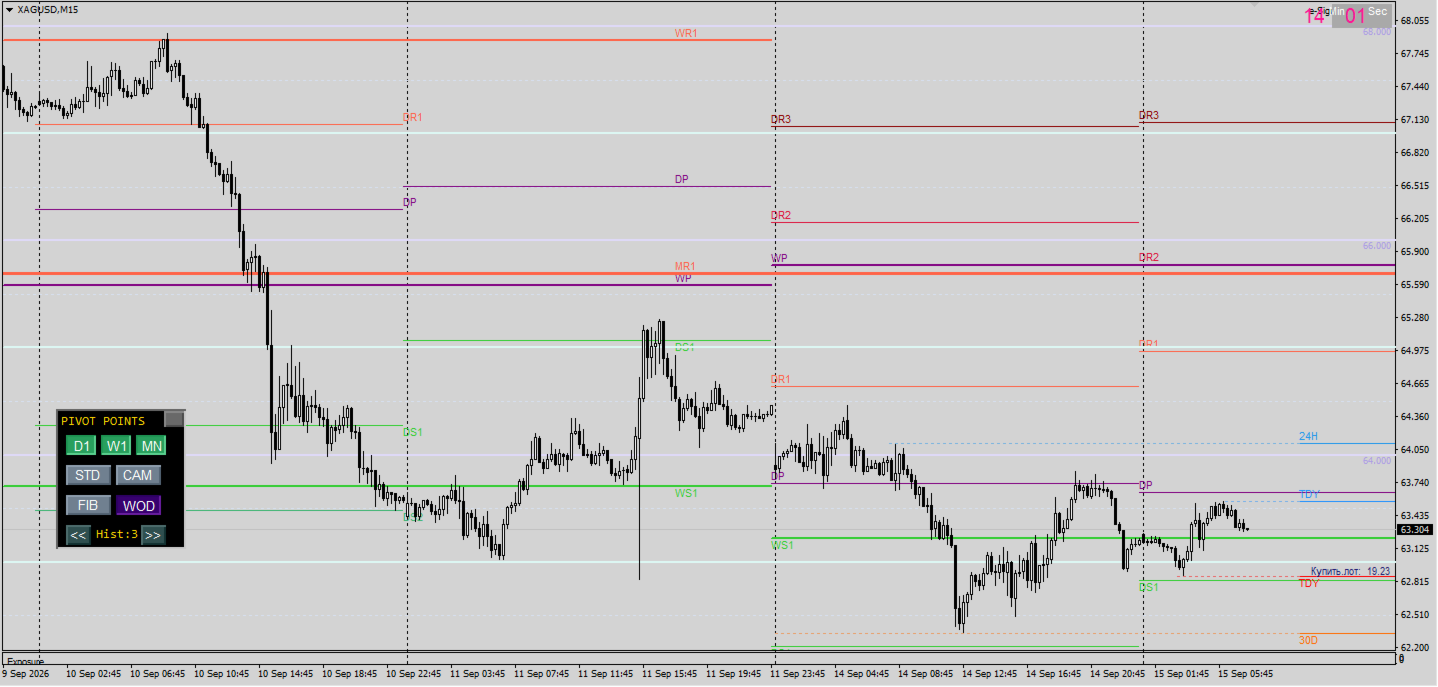
**Standard (Classic / Floor Pivots)** — the original: `(H+L+C)/3`, with
symmetric R1–R3/S1–S3 spaced off the prior period's range. This is your
default, all-purpose read on the session. It shines in **range-bound,
sideways markets**: when price gets stuck at the pivot itself, watch
closely — it's a coin-flip point that tends to either launch a clean
breakout or snap back into range.
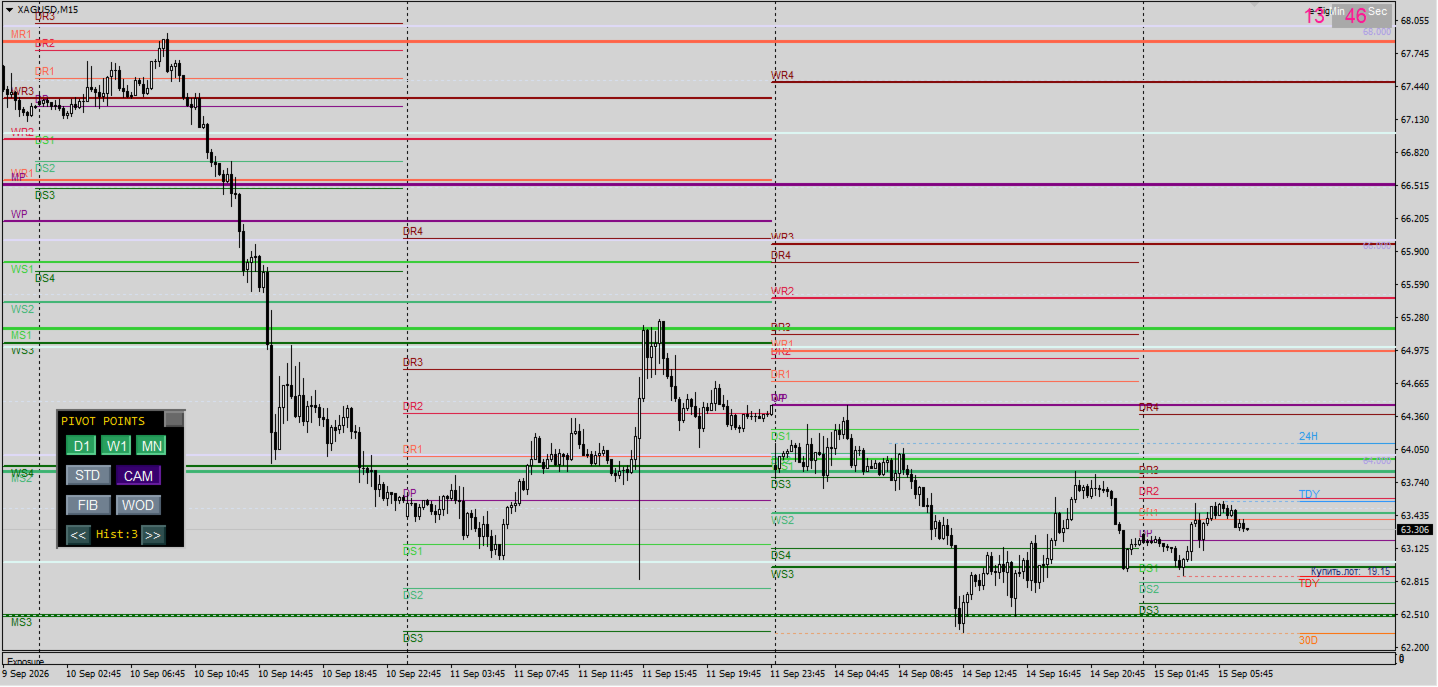
**Camarilla** — built around the *close*, not a plain H/L/C average, using
a tight 1.1 multiplier that packs R1–R4/S1–S4 much closer to price than
Standard. This is the tool for **choppy, range-bound intraday sessions**:
the classic playbook is "fade R3/S3, confirm through R4/S4" — if price
opens between S3 and R3, treat it as a reversal day and trade the bounce
off S1–S3/R1–R3; if it opens *outside* that band, treat it as a breakout
day and wait for a retest of R3/S3 before pressing the move. **Its
weakness is exactly a strong trend day** — the tight levels get run
straight through and stop meaning much.
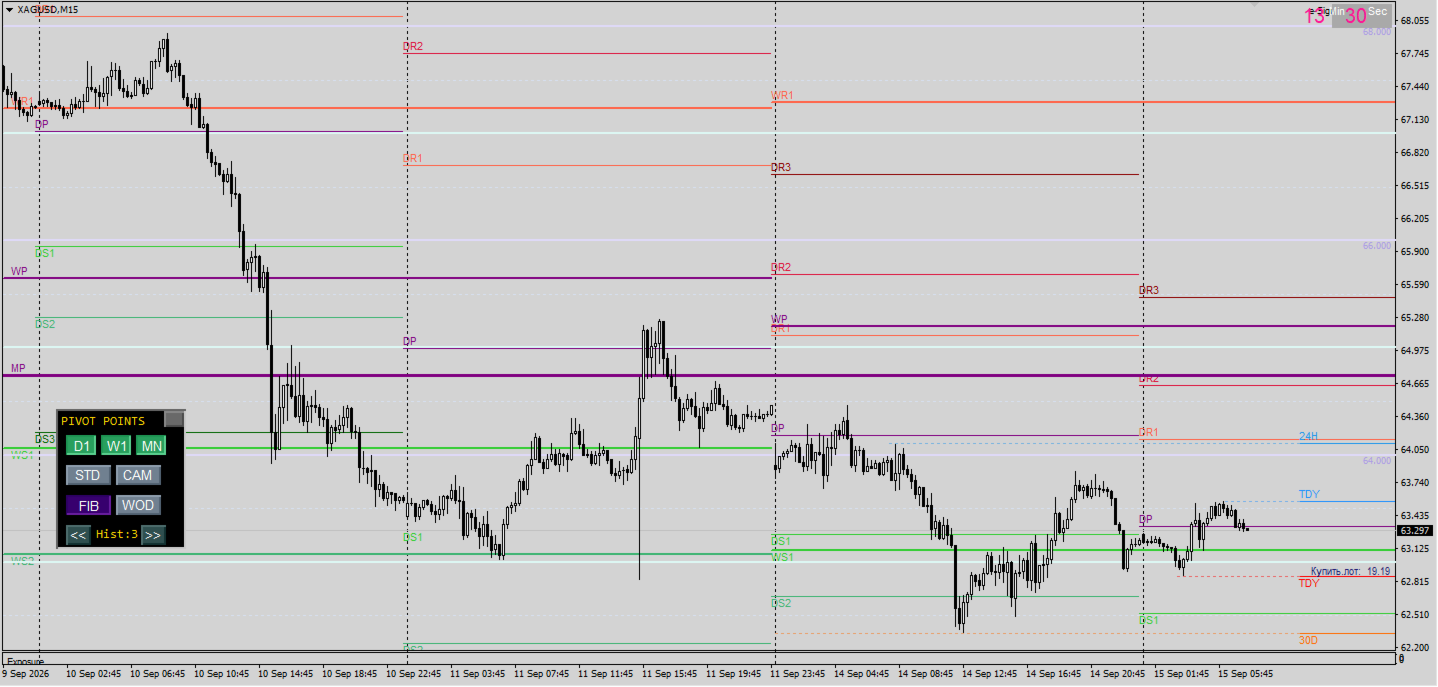
**Fibonacci** — same central pivot as Standard, but R1/S1 and R2/S2 sit at
the 38.2% and 61.8% retracement of the prior range instead of even
spacing. This is the one to switch to **once a trend actually establishes
itself** — pullbacks in a trending market tend to respect Fibonacci ratios
far more reliably than they respect Camarilla's tight, mean-reversion
bands. A practical rule some traders use: **if price accepts beyond
Camarilla's R4/S4 and keeps going, that's your cue to flip the panel from
CAM to FIB** — you've likely left "reversion mode" and entered "trend
mode."
**Woodie's** — double-weights the close (or the following period's open,
depending on the source you read — the convention genuinely varies, this
indicator uses `(H+L+2×O)/4` with the *next* period's open, matching the
version most day-trading platforms ship by default). Because it leans on
the most recent price action rather than treating H/L/C equally, it tends
to react a little faster to shifts in sentiment right after an open or a
gap — worth a look specifically around session opens, or on symbols that
gap meaningfully overnight.
## A few extra tips worth carrying into your own plan
- **Match the timeframe to your holding time.** Daily pivots for
intraday scalps and day trades, weekly for swing positions held a few
days, monthly for the bigger picture / position sizing context. This
indicator lets you show all three at once — daily for entries, weekly
for "where's the real ceiling," monthly for "am I fighting the tide."
- **Don't stack every level at once.** All four methods drawn together
is visual noise, not insight — one of the most repeated pieces of
practitioner advice is "too many levels leads to analysis paralysis."
Pick the method that matches today's regime, glance at the others only
to sanity-check a reaction.
- **Best timeframe window:** most of the community consensus on
Camarilla specifically points to M30–H1 as the sweet spot — noisier
below that, and on H4+ price tends to cut through the tighter levels
without much respect for them.
- **Confirm, don't assume.** A pivot level is a *place to pay attention*,
not a signal by itself — a reaction (rejection wick, momentum stall)
at the level is what you're actually trading, not the line's mere
existence. Pivots plus price action, or pivots plus your favourite
oscillator, beats pivots alone.
- **Widening vs tightening spacing is information too.** A wider gap
between the current period's Camarilla levels and the prior one
signals range expansion (more volatility ahead); a tighter gap signals
compression — often a pre-breakout coil worth watching.
*Pivot points are reference levels, not guarantees — price can and does
overshoot them, especially around high-impact news. Risk management
(stop placement, position sizing) is what turns a good level into a
survivable trade, not the level itself.*