ForceBars
- Indicadores
-
Ivan Simonika
 List of the best products: https://www.mql5.com/ru/users/dragonivan/seller
e-mail: dragon.ivan.sym@gmail.com - Versão: 1.10
- Ativações: 5
Overview
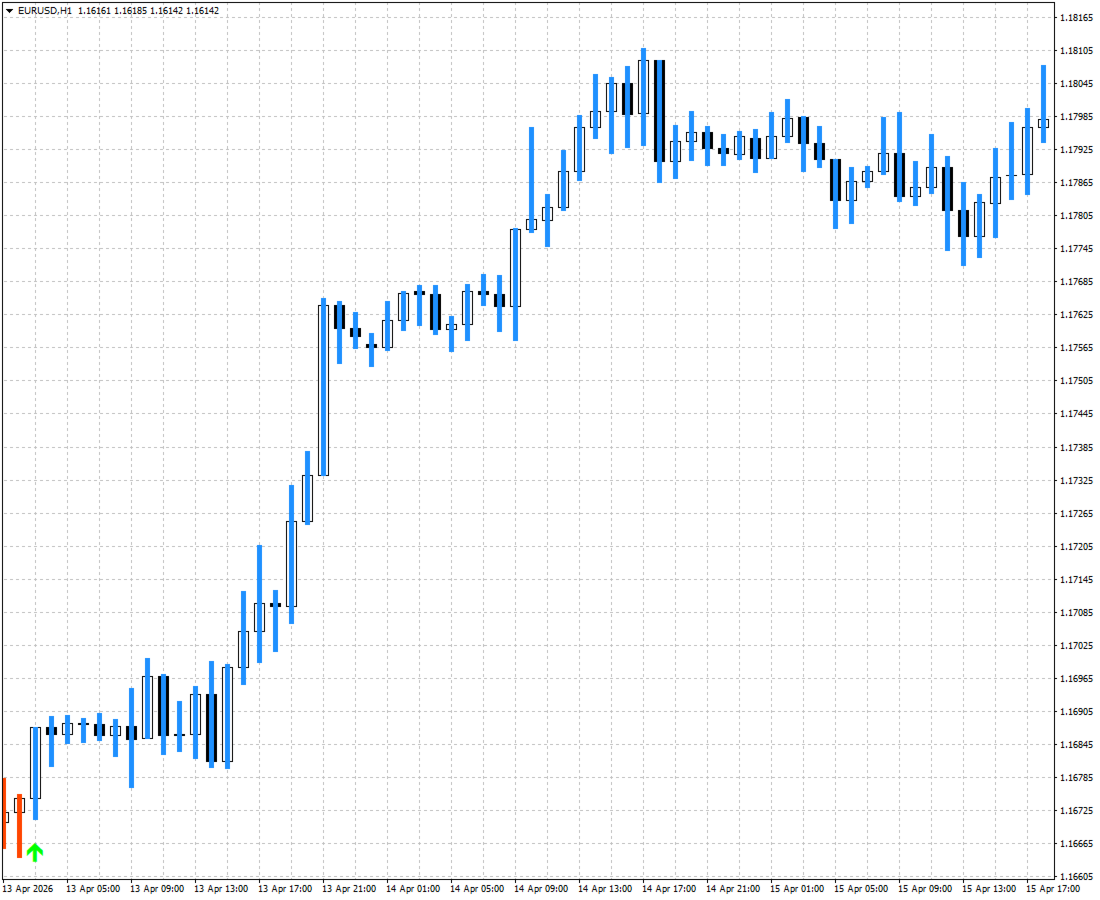
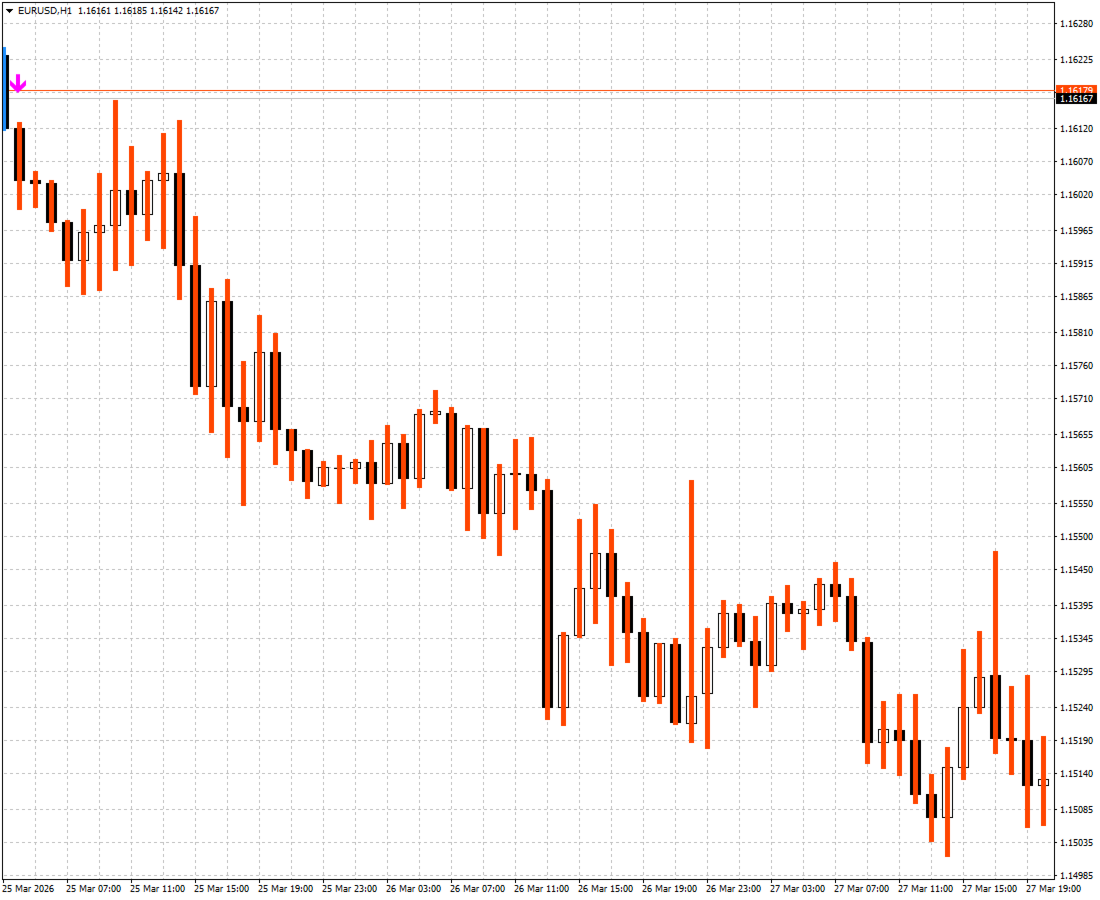
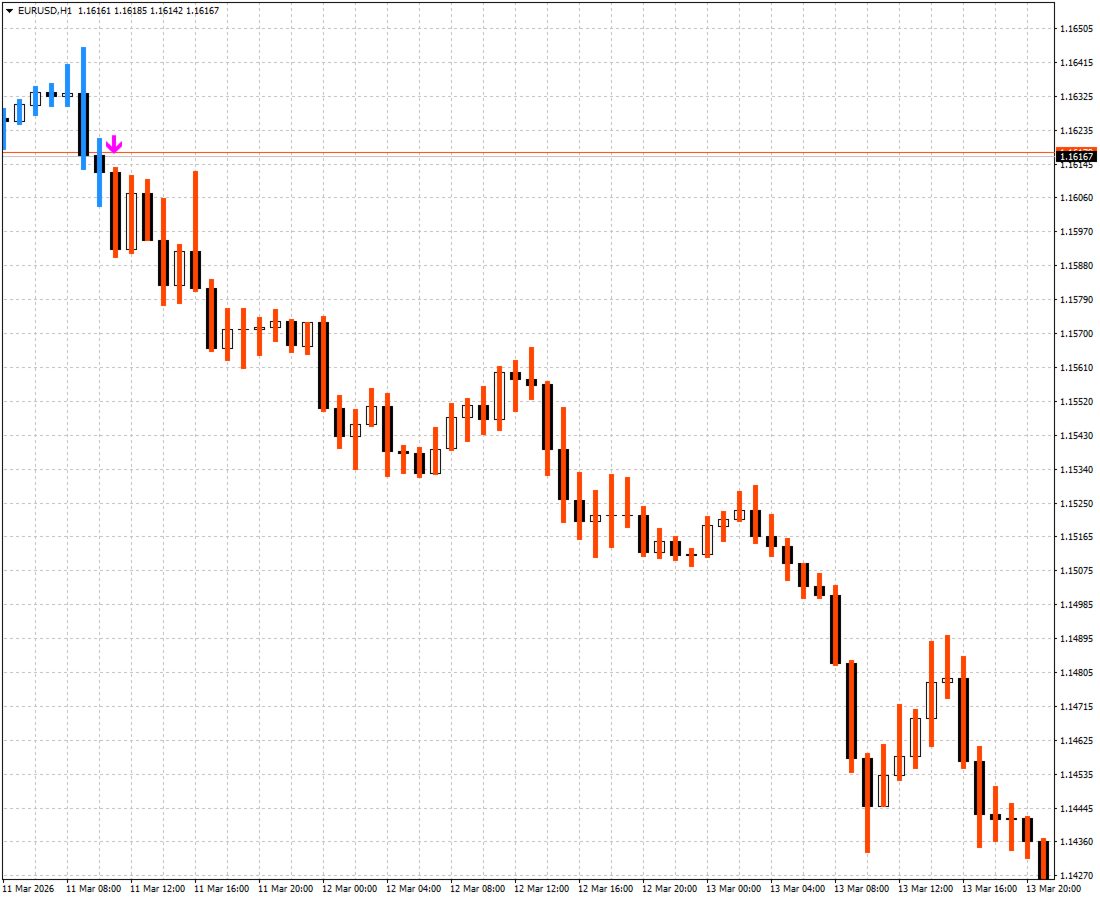
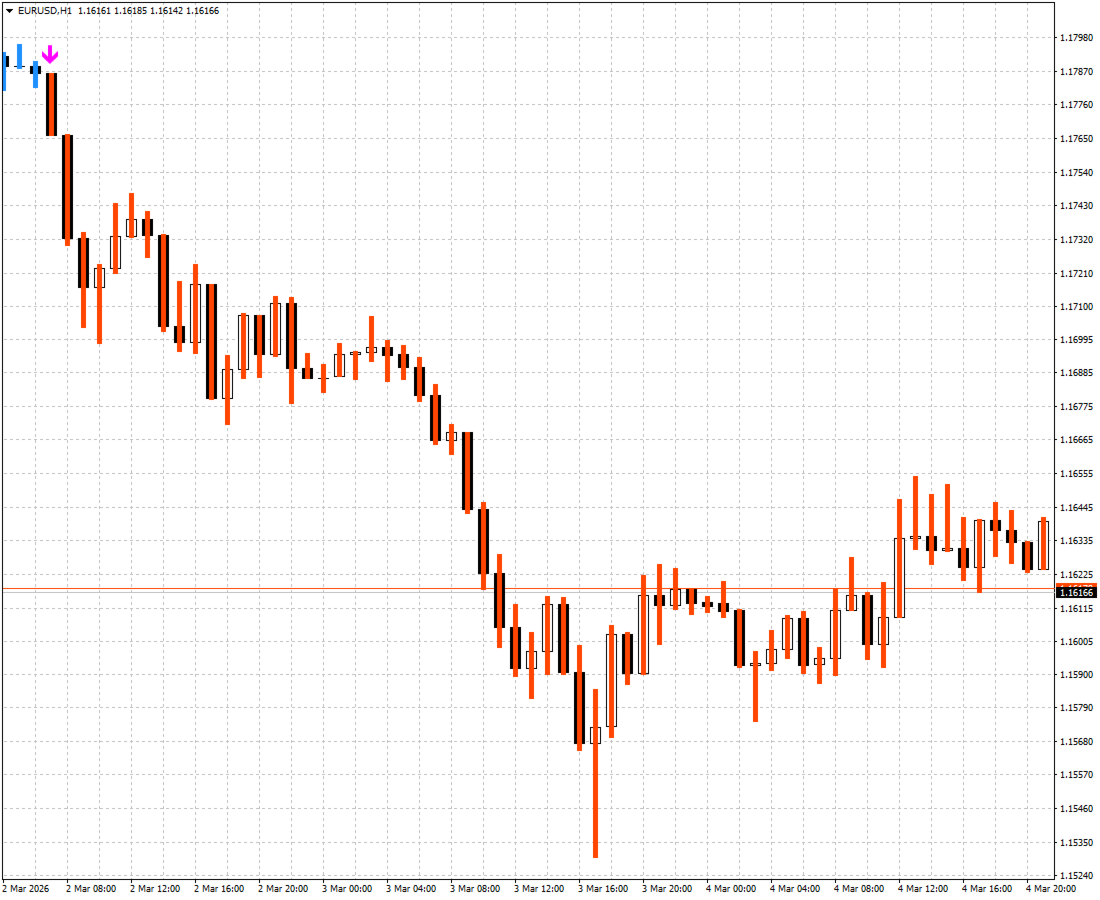
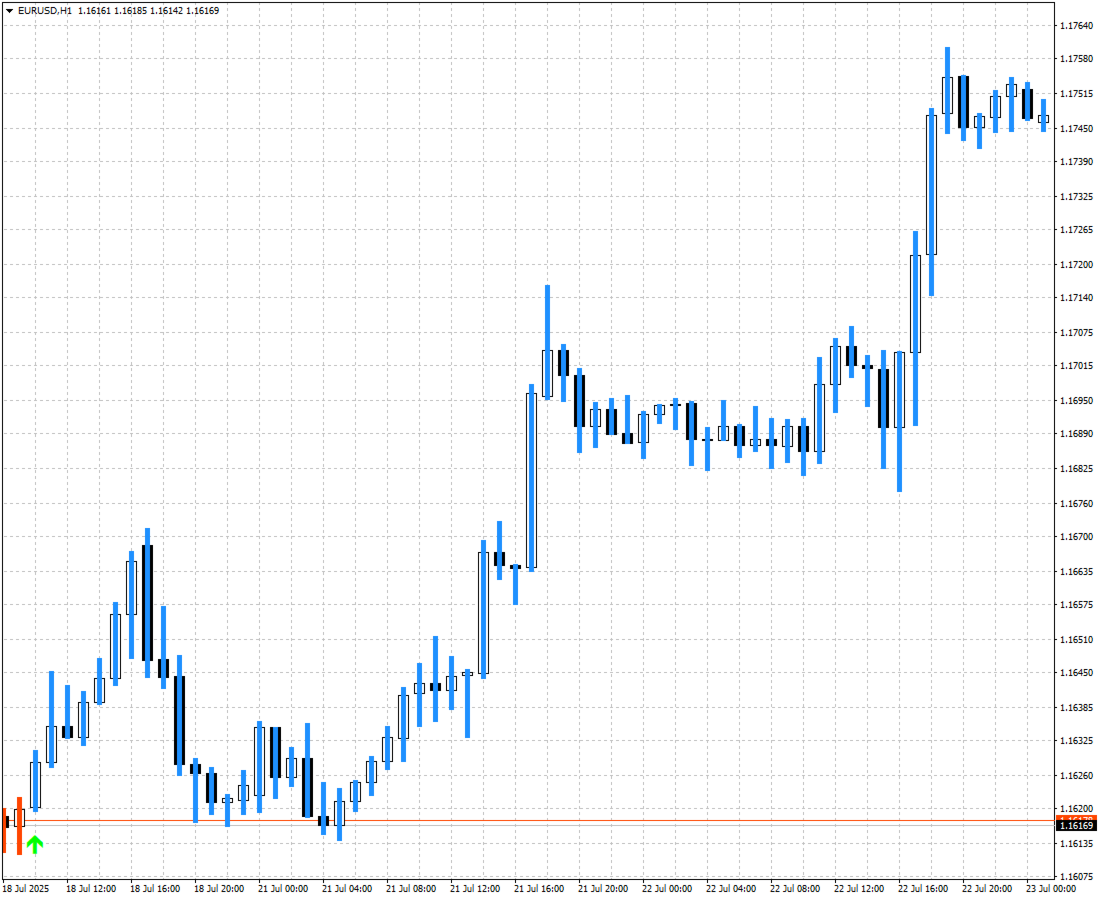
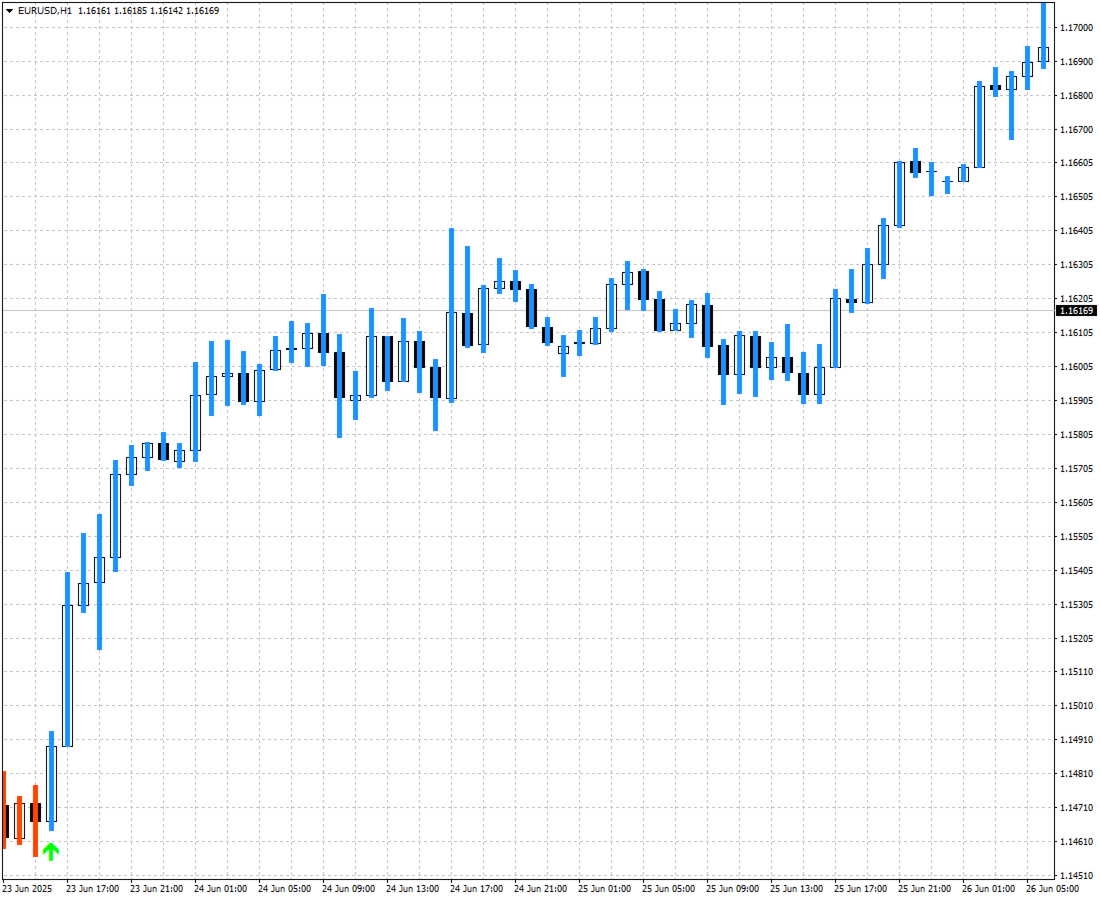
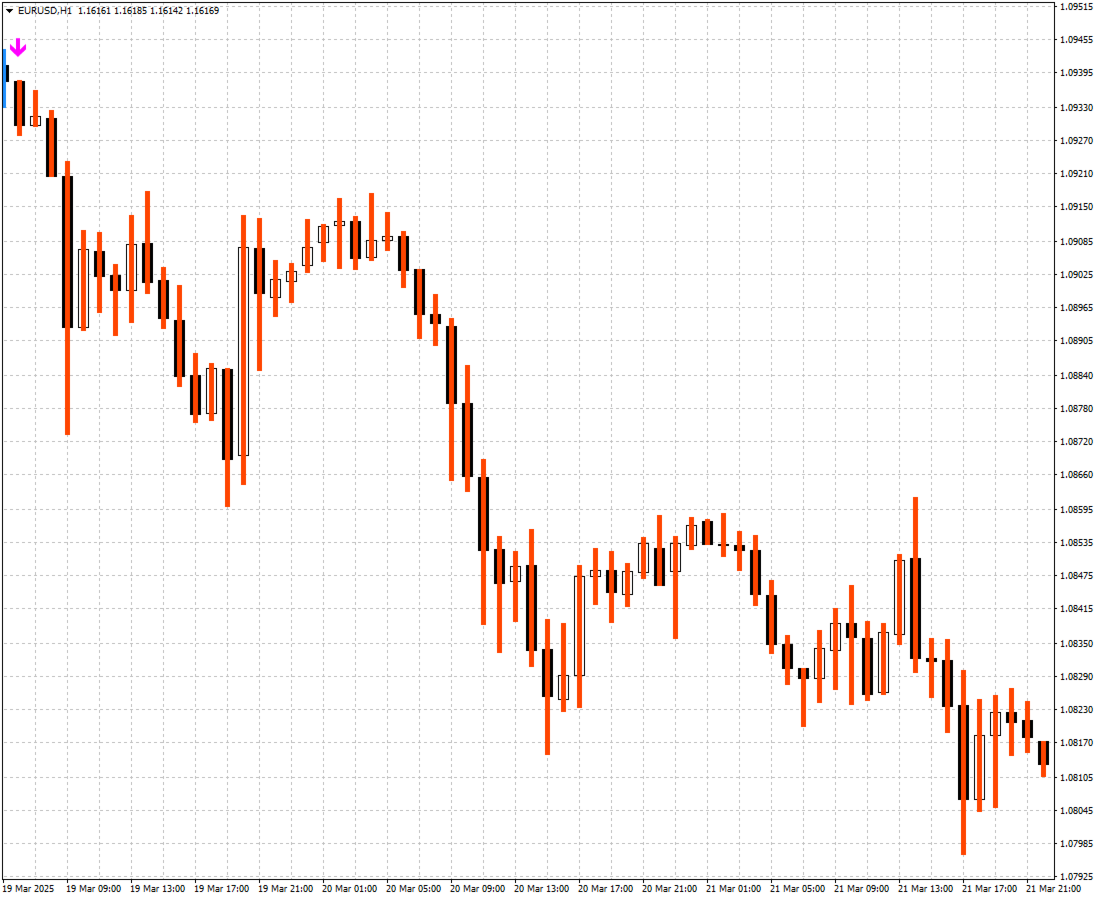
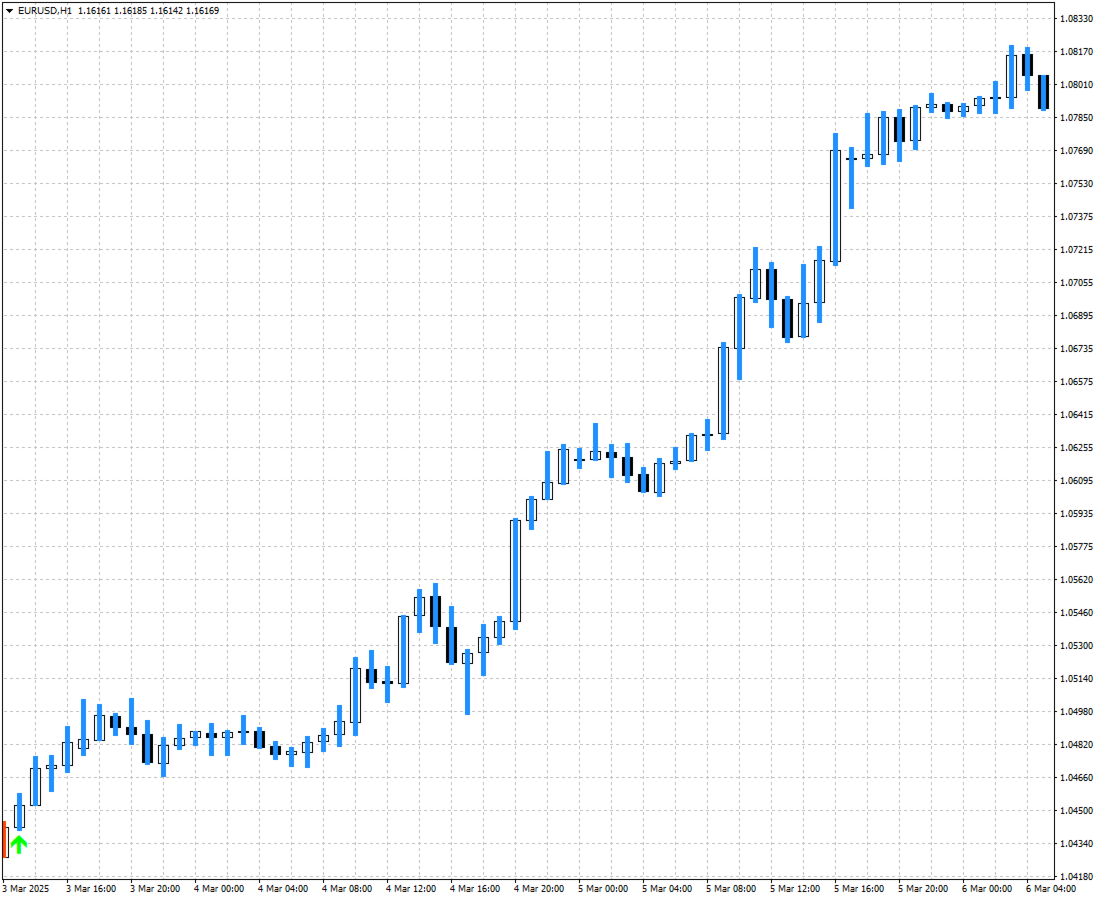
ForceBars is a chart indicator for MetaTrader 4 that visualizes the relationship between the positive directional indicator (+DI) and the negative directional indicator (-DI) used in the Average Directional Movement Index (ADX) calculation.
The indicator works directly in the main chart window and does not require a separate subwindow.
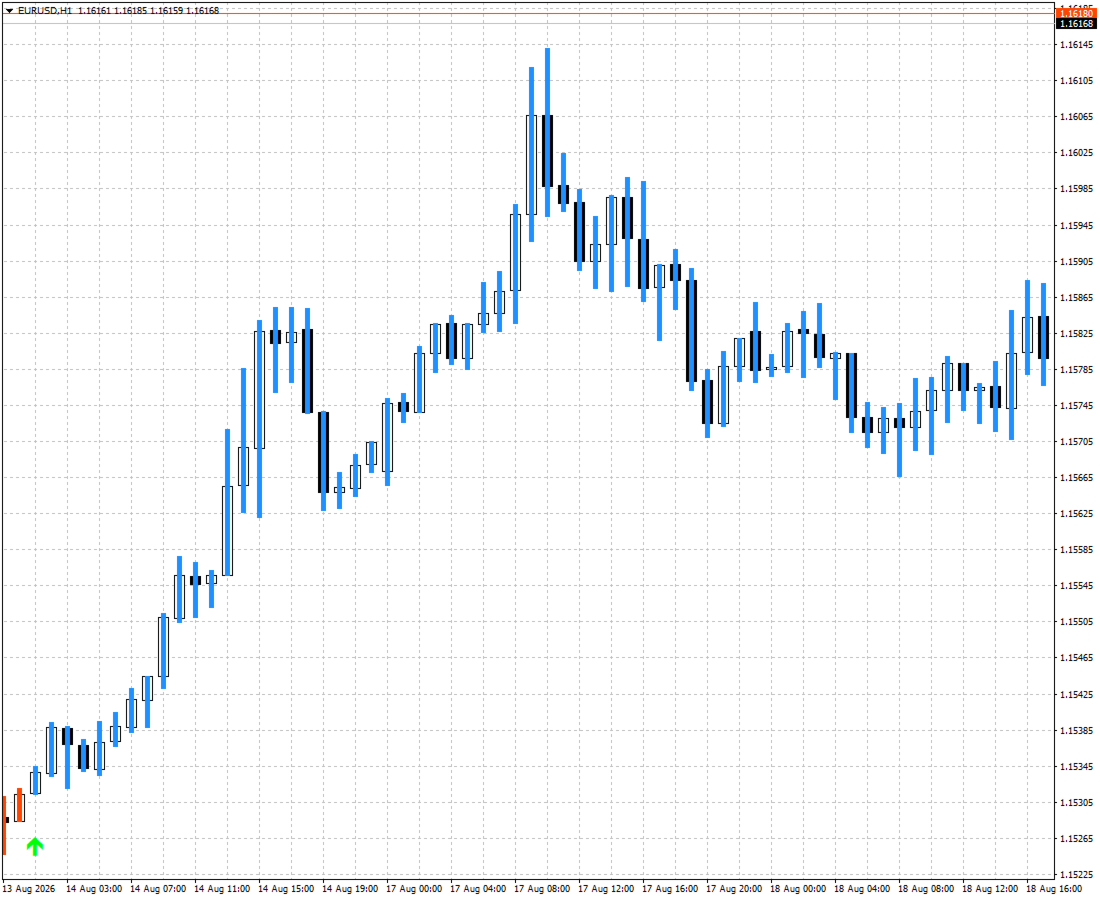
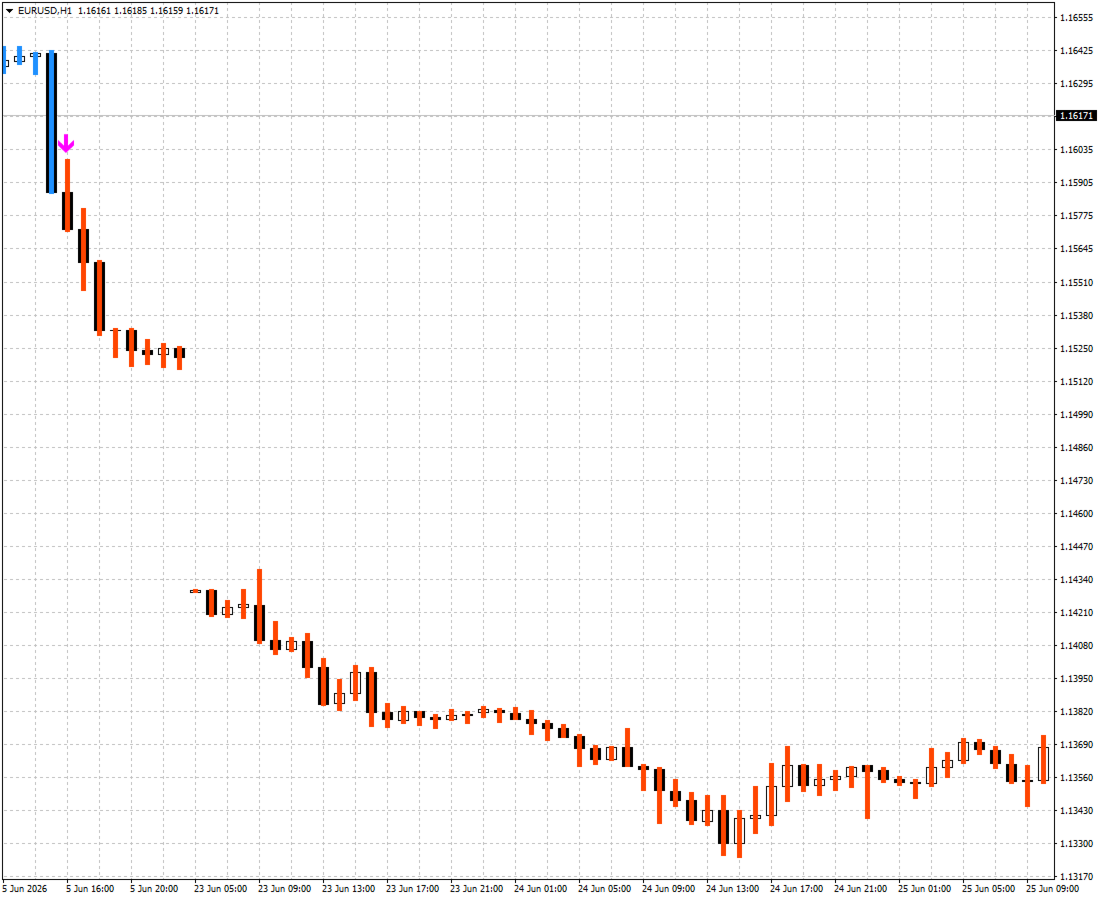
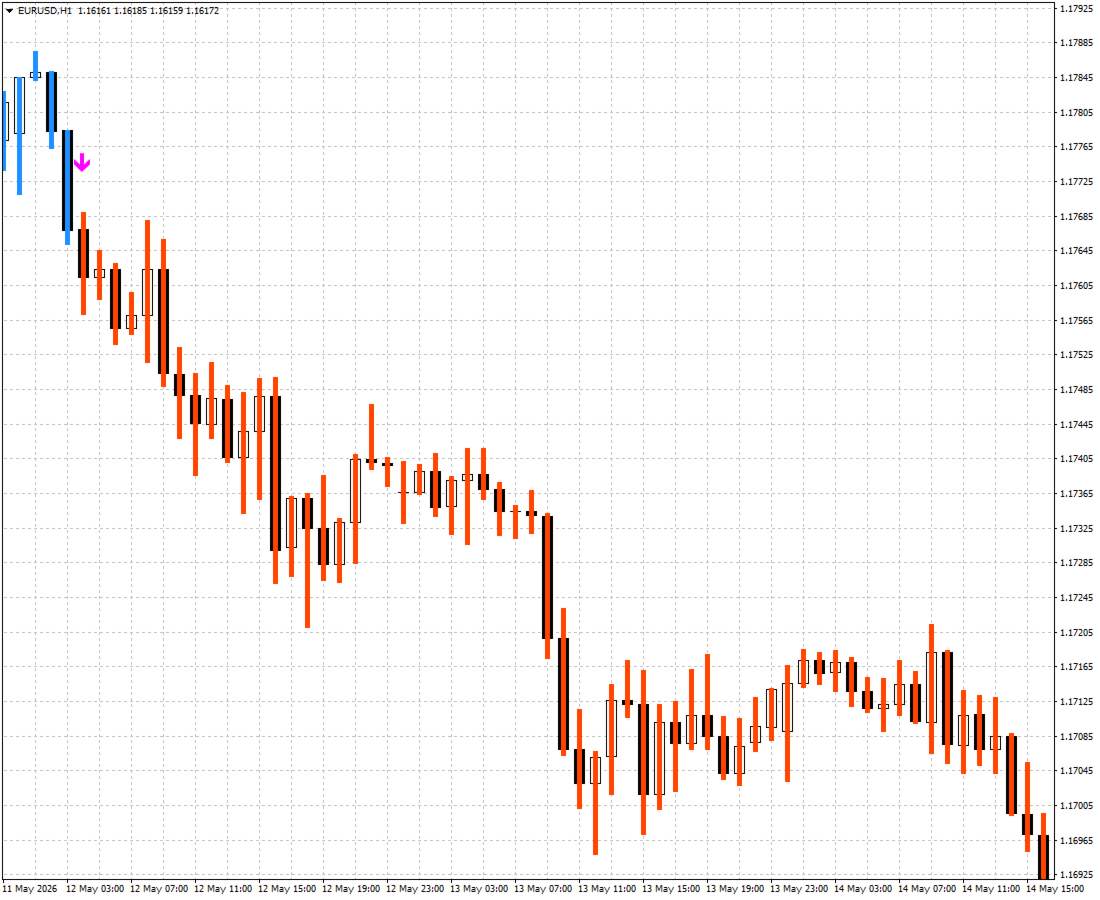
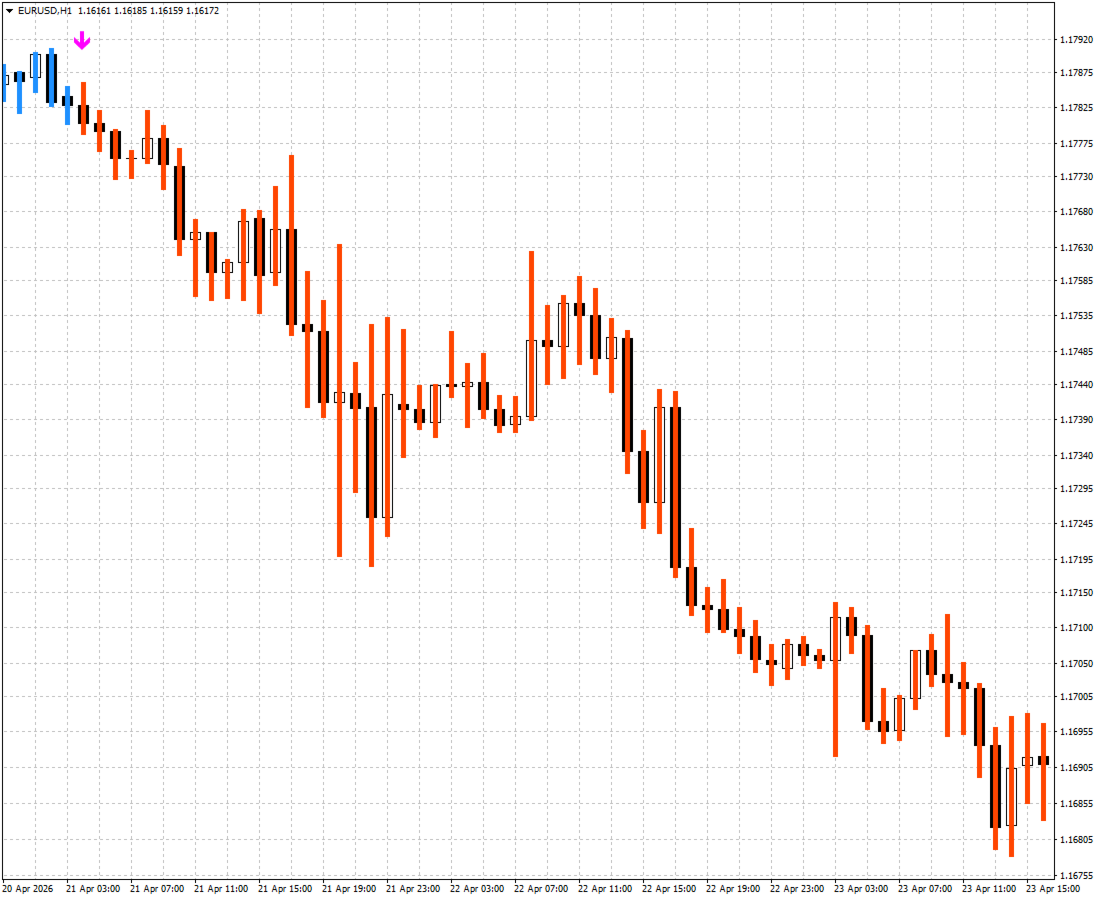
Instead of displaying the traditional ADX lines, ForceBars colors the High–Low range of each bar according to which directional component is currently stronger:
-
when +DI > -DI, the bar range is displayed in the bullish color;
-
when -DI > +DI, the bar range is displayed in the bearish color;
-
when the dominant direction changes, an optional arrow can be displayed above or below the corresponding bar.
This approach allows traders to quickly identify the directional bias of the market directly on the price chart without switching to a separate indicator window.
How the Indicator Works
The calculation is based on the standard Average Directional Movement Index formula available in MetaTrader 4.
For each bar, the indicator compares the +DI and -DI values calculated over the selected period.
Main Conditions
-
If +DI is higher than -DI, the High and Low values of the bar are used to draw a colored segment in the bullish color.
-
If -DI is higher than +DI, the High and Low values of the bar are used to draw a colored segment in the bearish color.
-
When the relationship between +DI and -DI changes compared with the previous bar, the indicator can optionally display an arrow marking the change in directional dominance.
The width and colors of the displayed segments are controlled through the indicator's input parameters.
Empty values are used for bars that do not meet the corresponding condition, so only the relevant ranges are displayed on the chart.
Input Parameters
ADX Period
The period used to calculate +DI and -DI.
The default value is 14.
Higher values produce smoother results with fewer directional changes. Lower values make the indicator more responsive to short-term changes in directional movement.
Signal Gap
The vertical distance, measured in points, between the bar's High/Low and the corresponding arrow.
This parameter helps adjust the arrow position so that the signals remain clearly visible without overlapping the price bars.
Show Arrows
Enables or disables arrows that mark changes in directional dominance.
When set to false, only the colored High–Low segments remain visible on the chart.
Bull Color
The color of the segment displayed when +DI is stronger than -DI.
Bear Color
The color of the segment displayed when -DI is stronger than +DI.
Usage
ForceBars can be attached to any available chart and timeframe in MetaTrader 4.
The indicator does not repaint closed bars. Values on the current forming bar may change as new ticks arrive.
ForceBars is a visual analysis tool and does not contain built-in trading logic. It does not provide automatic Take Profit or Stop Loss levels.
The indicator can be combined with your own market analysis and trading rules, including:
-
market structure analysis;
-
support and resistance levels;
-
trend filters;
-
additional technical indicators;
-
custom trading systems and strategies.
The colored segments make it easier to identify periods when one directional component remains dominant for several consecutive bars.
Optional arrows highlight the moments when this directional dominance switches.
Technical Details
-
Platform: MetaTrader 4
-
Window: Main chart window
-
Buffers: 4
-
Histogram Buffers: 2
-
Arrow Buffers: 2
-
Calculation: Standard terminal iADX function
-
External Libraries: Not used
-
DLL Calls: Not used
-
Internet Connection: Not required
Installation
The indicator is provided as a compiled file and is ready to use after installation in the Indicators folder of the MetaTrader 4 data directory.
After installation, restart the terminal or refresh the indicator list in the Navigator window, then attach ForceBars to the desired chart.