Xmcrsi
- Indicadores
- Versão: 1.0
- Ativações: 5

**Stop switching charts. Put a second live chart inside the one you are already watching.**
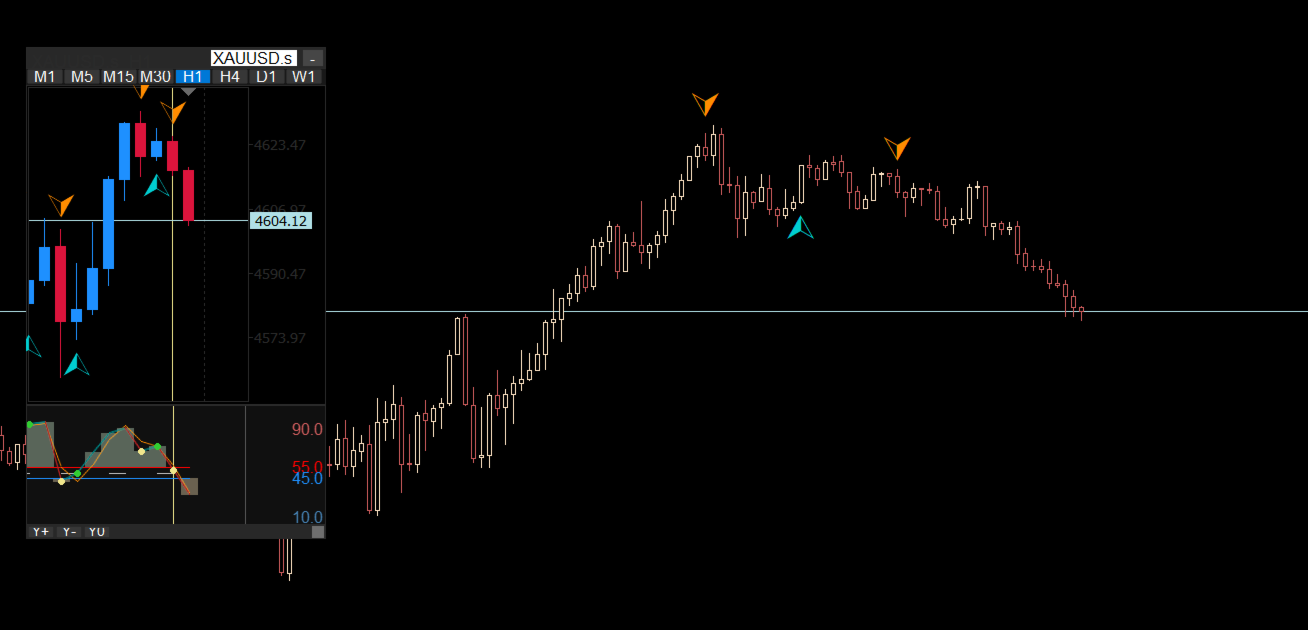
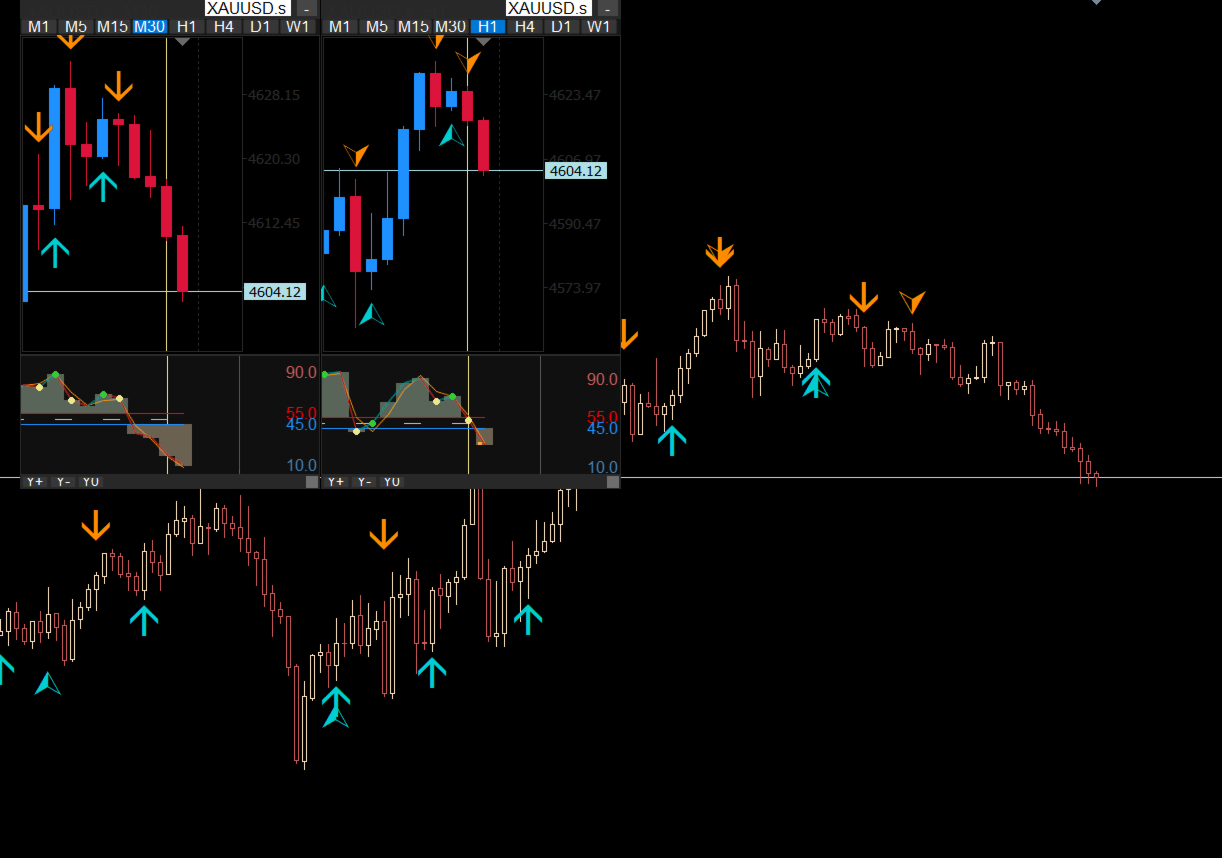
XMCR draws a real, live mini chart directly on top of your main chart. It is not a picture and not a copy of old bars. It is a working chart window that updates tick by tick, with its own timeframe, its own symbol, and its own indicators inside it.
You watch M1 for your entry. You need H1 for context. Normally you switch back and forth, or you open a second window and lose screen space. With XMCR you see both at the same time, on one screen.
---
### Move it, resize it, park it anywhere
The panel is fully interactive:
- **Drag it** by the header to any spot on your chart.
- **Resize it** with the grip in the bottom-right corner.
- **Collapse it** to a single title bar with one click, then open it again.
- **Anchor it** to any corner, including centred at the top or bottom.
- **Switch timeframe instantly** with the button row: M1, M5, M15, M30, H1, H4, D1, W1. The active button stays highlighted so you always know what you are looking at.
- **Change symbol on the fly** by typing in the header field. Watch EURUSD while your main chart shows XAUUSD.
- **Slide the candles up or down** with the Y+ / Y− / Y0 footer buttons when you need room for the wicks.
Everything is remembered while the panel is on the chart. Move it, and it stays where you put it.
---
### Built-in RSI pane — no extra files needed
Under the mini chart sits a full RSI pane, drawn by XMCR itself. There is no external indicator to install and nothing to link. It is inside the product.
The RSI engine is not a plain 14-period RSI. You get:
- **9 RSI types** — Basic, Cuttler, Ehlers-smoothed, Harris, Quick, RSX, Gradual, Double-Smoothed, and Connors.
- **22 price sources** — from simple close to smoothed, balanced, direction-adjusted and extreme-adjusted prices.
- **A signal line** with 6 averaging methods, including TEMA and regularized EMA.
- **Four levels** — main overbought and oversold, plus a second pair for extreme readings.
- **Dynamic boundaries** that adapt to recent range, or fixed static levels if you prefer.
- **Colour-changing curve** that shifts on slope change, centre crossing, or boundary crossing — your choice.
- **Shaded fill** above and below the boundaries, with adjustable opacity.
- **Auto vertical scale** so the curve always fills the pane, or a locked 0–100 range.
---
### Slope-turn arrows, on both charts
When the RSI turns at a peak or a trough, XMCR marks it with an arrow on the price candles — on the mini chart, on the main chart, or on both.
- **6 arrow styles**: Barb, Diamond, Thin arrow, Cross star, Arrowhead, Dot.
- Separate colours for up turns and down turns.
- Adjustable size and history length.
- Matching slope dots inside the RSI pane itself.
- Main-chart arrows switch off automatically when your main timeframe is larger than the mini chart timeframe, so you never see arrows that do not belong there.
---
### Built-in vertical session lines
XMCR also draws vertical lines on the mini chart, with four modes:
- **Follow last bar** — a single line that tracks the newest candle.
- **Bar grid** — a line every N bars.
- **Clock grid** — a line every N minutes, for session opens and news times.
- **Price step** — a new line after every X points of price movement.
Full control over colour, style, width, maximum line count, and whether the lines sit behind or in front of the candles. Optional time text on each line.
---
### Load your own indicators inside the mini chart
The mini chart is a real chart, so it can hold real indicators.
- **Template route** — save any chart setup as a `.tpl` file, type the name in the settings, and the whole set loads inside the mini window. Moving averages, bands, your own custom tools — anything that runs on a normal chart.
- Choose whether the template keeps its own colours or follows the panel colour scheme.
This is what makes XMCR different from a simple chart-picture tool. What you build on a normal chart, you can put inside this one.
---
### Run several at once
Set a **Copy number** and drop XMCR on the same chart again. Each copy runs on its own, with its own timeframe, symbol, size and position.
Three timeframes side by side on one screen. Or the same timeframe on three different symbols. Your layout, your choice.
---
### Built for a clean screen
- Full colour control: background, grid, bull and bear candles, borders, panel, header, RSI pane, every line.
- A solid backing sheet blocks the main chart from showing through the panel.
- Turn off the ticker, OHLC, grid, and date scale for a bare, clean look.
- Candles, bars, or line mode.
- Chart shift, auto-scroll, and a 0–5 zoom scale.
- Adjustable refresh rate, down to 50 ms, so you can trade the speed you want.
---
### Alerts
Get told when the RSI shifts trend or turns at a peak or trough:
- Popup alert
- Push notification to your phone
- Email
- Sound alert, with your own sound file
Each alert type switches on and off on its own. One master switch turns them all off.
---
### Who this is for
- **Multi-timeframe traders** who need context and entry on one screen.
- **Scalpers** who watch M1 but must respect the higher timeframe.
- **Anyone with one monitor** who is tired of losing space to a second chart window.
- **Traders who already have their own indicators** and want them in a smaller second view.