Support Resistance Boxes MT5
- Indicadores
-
Yan Zhen Du
 With over 13 years of experience in live trading and developing algorithmic strategies, we are proud to offer some of the most powerful and reliable Expert Advisors (EAs) for MetaTrader 4 and 5. Our tools are carefully designed to analyze real-time market movements, adapt seamlessly to changing
 - Versão: 1.30
Support Resistance Volume Boxes is a MetaTrader 5 indicator that identifies important support and resistance areas using pivot points and volume analysis.
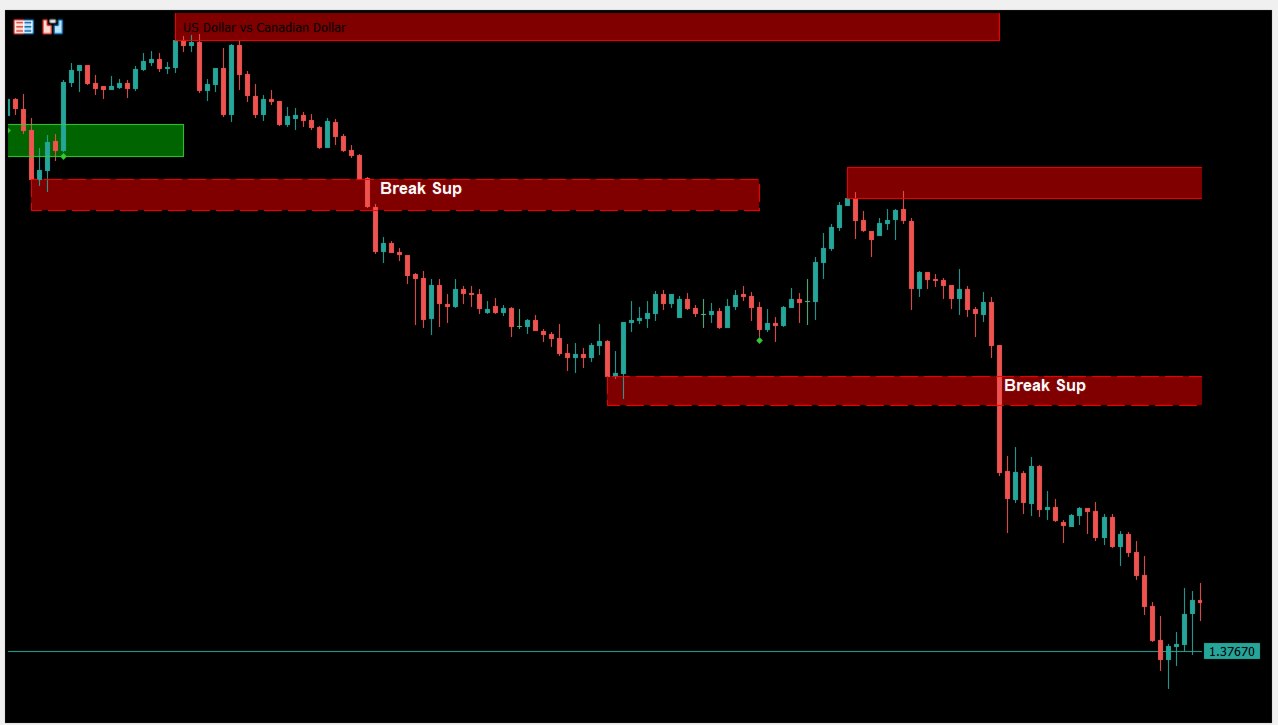
The indicator displays dynamic support and resistance boxes on the chart. Each box represents a price area where market activity has been detected, while the box color intensity reflects the relative volume strength.
This helps traders analyze potential reaction zones, monitor price structure, and observe important areas where buying or selling pressure may appear.
There are even better indicators—get them here.
https://www.mql5.com/en/users/aa996a/seller
Main Features
Dynamic Support and Resistance Boxes
The indicator automatically creates support and resistance boxes based on pivot points and volume conditions.
Boxes are continuously extended until a new box of the same type is created, allowing traders to monitor active market zones.
Volume-Based Color Display
The color of each box is determined by volume activity:
Green boxes represent support areas with positive volume conditions.
Red boxes represent resistance areas with negative volume conditions.
Higher volume activity creates stronger color intensity, making important zones easier to identify.
Active Level Signals
Green diamond markers indicate active support levels.
Red diamond markers indicate active resistance levels.
These markers help traders identify areas where price may react around detected levels.
Support and Resistance Breaks
When price breaks below a support zone, the previous support area may become a resistance area.
When price breaks above a resistance zone, the previous resistance area may become a support area.
Break labels are displayed when price moves beyond detected support or resistance zones, indicating a change in market structure.
Input Parameters
Pivot Settings
Controls the calculation range used for identifying support and resistance areas.
Volume Threshold
Defines the minimum volume condition required for creating support and resistance boxes.
Box Settings
Allows adjustment of the appearance and extension behavior of the displayed zones.
Usage
The indicator can be used on different symbols and timeframes. It can be combined with price action analysis, trend analysis, and breakout trading methods.
Support Resistance Volume Boxes provides a visual way to analyze market structure, volume activity, and price reaction areas directly on the MetaTrader 5 chart.
Important Notes
The indicator does not predict future price movements. Signals and zones are generated according to the configured parameters and current market data.