StructureMap Navigator MT5
- Indicadores
-
Christopher Calmerin
 Há mais de 10 anos desenvolvo software e soluciono desafios do mundo real através da tecnologia. Minha trajetória inclui desde soluções empresariais e de saúde até ferramentas inteligentes para os mercados financeiros.
 - Versão: 1.0
STRUCTUREMAP NAVIGATOR MT5
Multi-Timeframe Market Structure Dashboard
TAGLINE
Read the market like a structure trader.
PRODUCT OVERVIEW
StructureMap Navigator MT5 is a multi-timeframe market-structure indicator for MetaTrader 5. It is designed to help traders understand how price is behaving through swing points and structure events rather than relying only on traditional buy/sell arrows.
The indicator analyzes recent swing highs and swing lows, classifies them as HH, HL, LH, or LL, and then determines whether the market is in bullish structure, bearish structure, or range structure. It also looks for important structure events such as:
- Break of Structure (BOS)
- Change of Character (CHOCH)
- Pullback continuation
- Range development
The result is displayed in a clean black dashboard across multiple timeframes, so the trader can immediately see whether short-term and higher-timeframe structure are aligned.
WHAT THE INDICATOR DOES
For each enabled timeframe, StructureMap Navigator MT5 evaluates:
1. Recent swing highs and swing lows
2. Whether price is creating HH/HL or LH/LL behavior
3. Whether a recent close has broken a previous swing level
4. Whether that break supports continuation or suggests a reversal
5. The overall structure score and condition
It then classifies the timeframe into results such as:
- Strong bullish structure
- Bullish structure
- Bullish reversal developing
- Range structure
- Bearish reversal developing
- Bearish structure
- Strong bearish structure
CORE STRUCTURE LOGIC
SWING DETECTION
The indicator uses a configurable swing-strength filter to identify local swing highs and lows. These are the reference points used to determine whether the market is printing:
- Higher Highs (HH)
- Higher Lows (HL)
- Lower Highs (LH)
- Lower Lows (LL)
A simple sequence of HH and HL supports a bullish structural interpretation. A sequence of LH and LL supports a bearish interpretation.
BREAK OF STRUCTURE (BOS)
When a completed candle closes beyond a relevant previous swing high or swing low in the direction of the prevailing structure, the dashboard can classify that event as a bullish or bearish BOS.
Examples:
- Close above prior swing high during positive structure = Bull BOS
- Close below prior swing low during negative structure = Bear BOS
CHANGE OF CHARACTER (CHOCH)
When price breaks an important swing level against the current structure, the indicator may classify the event as CHOCH.
Examples:
- Price was structurally bearish but closes above a key swing high = Bull CHOCH
- Price was structurally bullish but closes below a key swing low = Bear CHOCH
CHOCH is often interpreted as a possible early structural shift rather than full confirmation of a new trend.
SCORING MODEL
The indicator assigns directional weight to structure components.
Examples of score contributors:
- HH adds bullish weight
- HL adds bullish weight
- LH adds bearish weight
- LL adds bearish weight
- BOS strengthens the current structural direction
- CHOCH increases reversal significance
This leads to broad structure classes such as healthy bullish, strong bullish, healthy bearish, strong bearish, or mixed/range.
MULTI-TIMEFRAME VIEW
Supported timeframes:
- M5
- M15
- M30
- H1
- H4
- D1
Default enabled timeframes:
- M15
- H1
- H4
- D1
The final dashboard signal checks how many enabled timeframes align. If the minimum required number align in the same structural direction, the final result reflects that direction.
DASHBOARD FIELDS
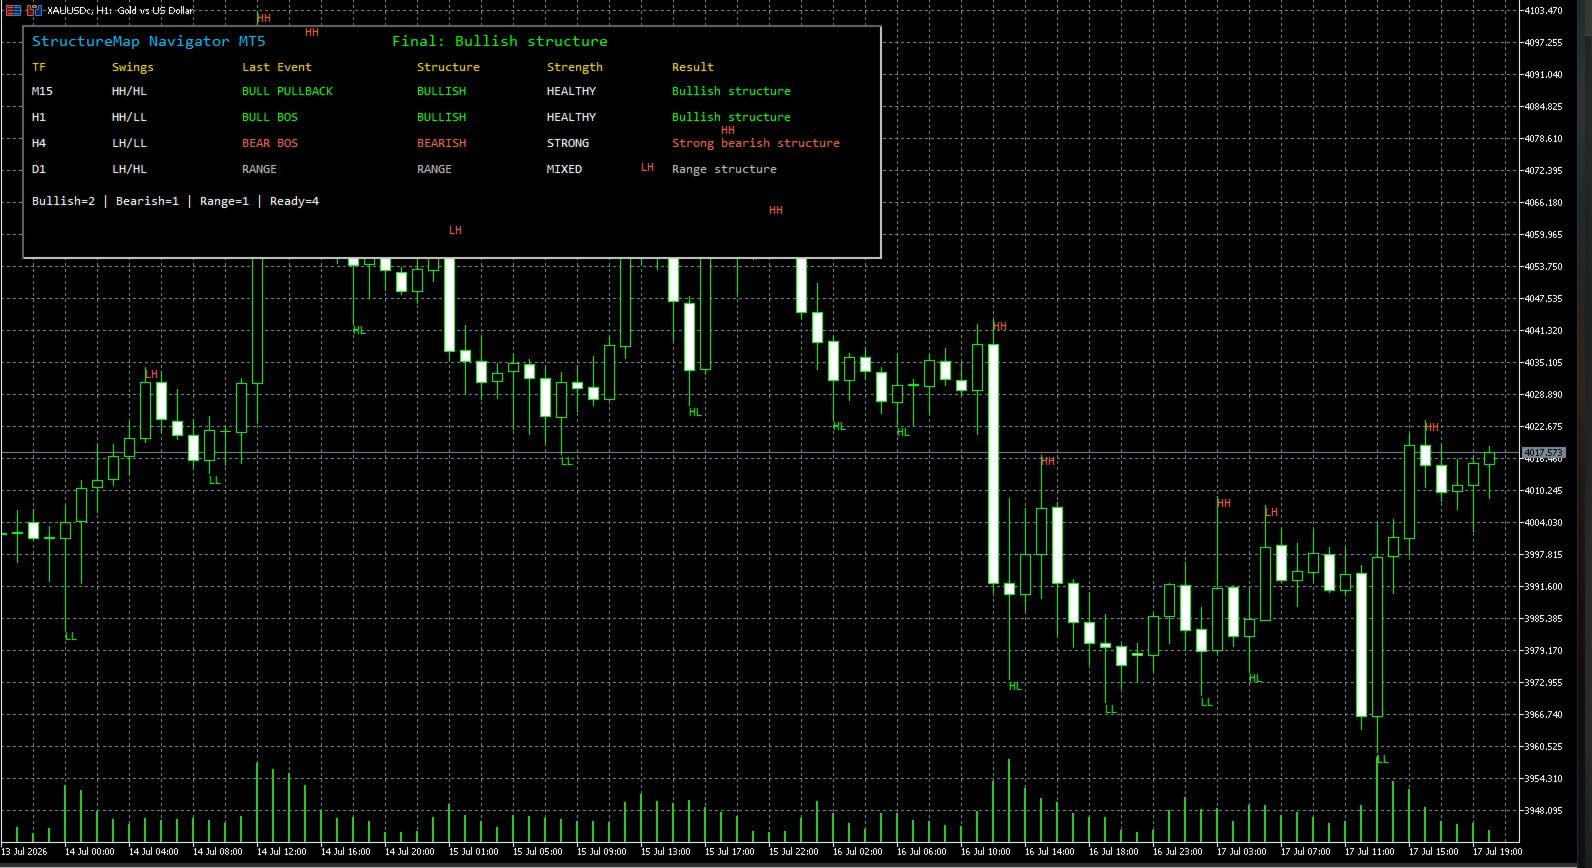
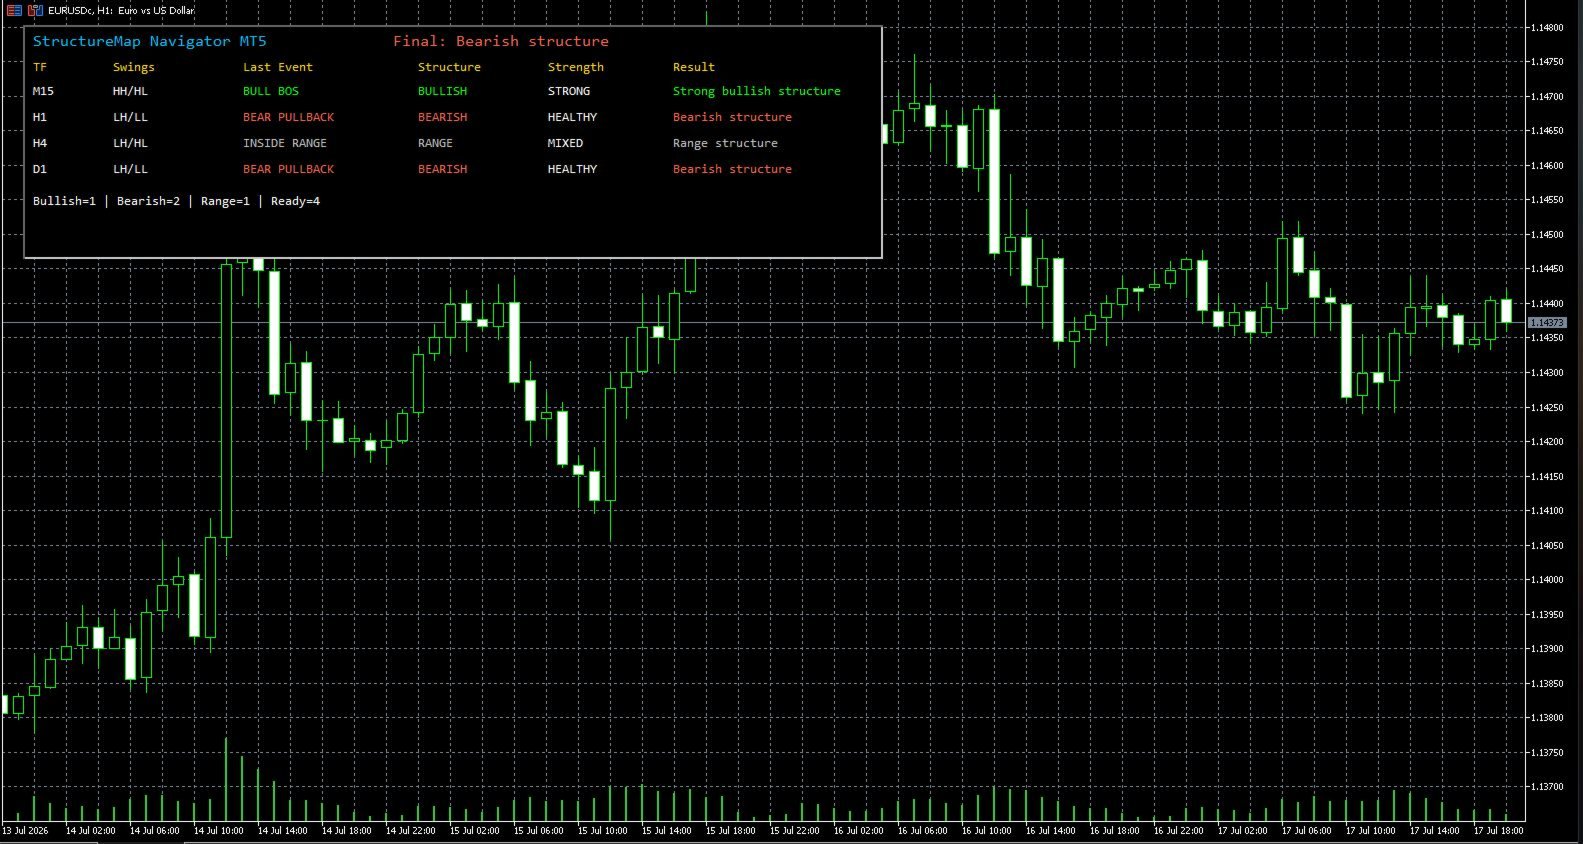
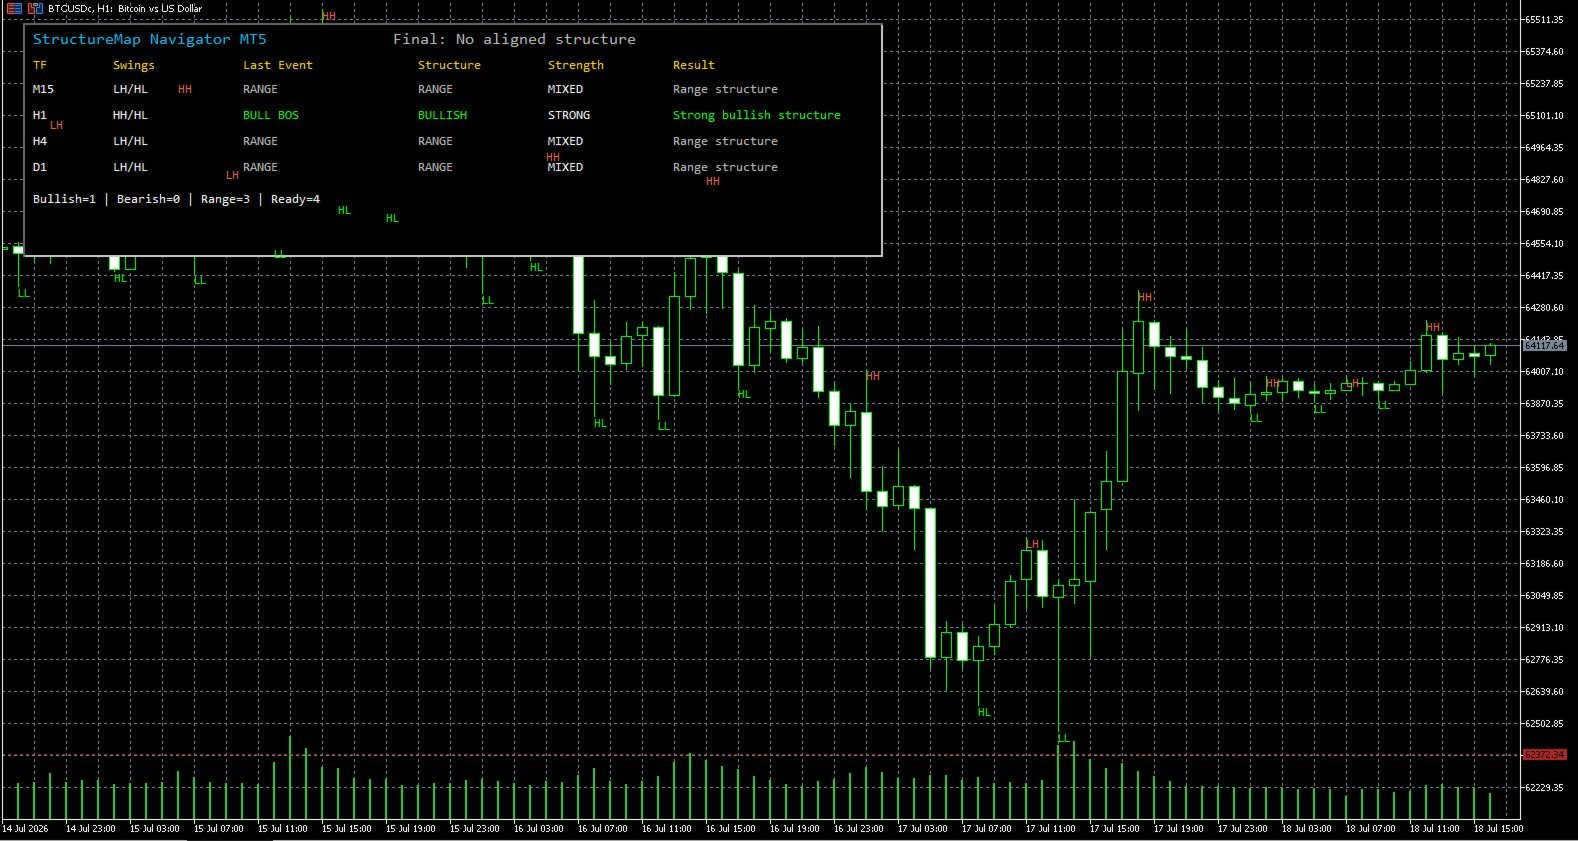
The StructureMap dashboard shows:
- Timeframe
- Swing classification (HH/HL/LH/LL combinations)
- Last event (Bull BOS, Bear BOS, Bull CHOCH, Bear CHOCH, Pullback, Range)
- Structure direction
- Strength label
- Final structure result for each timeframe
The dashboard also summarizes how many timeframes are bullish, bearish, or range.
OPTIONAL CHART MARKINGS
The indicator can optionally draw:
- Swing-point labels
- HH / HL / LH / LL labels
- Horizontal reference lines for important recent high/low structure zones
This makes the tool useful both as a dashboard and as an educational visual aid.
CLOSED-CANDLE CONFIRMATION
StructureMap Navigator MT5 uses completed candles for key calculations. This helps reduce unstable intrabar interpretation, especially for BOS and CHOCH events.
ALERTS
Optional alert features include:
- Popup alerts
- Mobile push notifications
- New-bar-only alert control
Alerts can be used when a meaningful aligned structure condition appears across the selected timeframes.
CUSTOMIZABLE INPUTS
- Swing lookback
- Swing strength
- Close confirmation bars
- Minimum aligned timeframes
- Show/hide swing labels
- Show/hide BOS and CHOCH lines
- Dashboard position and size
- Popup and push alerts
WHO IS THIS INDICATOR FOR?
- Price-action traders
- Smart-money-concept learners
- Trend traders
- Swing traders
- Intraday traders
- Traders who want to understand market structure more clearly
- Beginners who want structure presented in simple language
MAIN BENEFITS
- Multi-timeframe structure reading
- Clear HH/HL/LH/LL interpretation
- BOS and CHOCH detection
- Range-versus-trend filtering
- Optional chart markings
- Beginner-friendly dashboard
- Useful for both analysis and education
- Does not open or manage trades
INSTALLATION
1. Copy StructureMap_Navigator_MT5.mq5 or its compiled EX5 file into:
MQL5/Indicators
2. Restart MetaTrader 5 or refresh the Navigator.
3. Attach StructureMap Navigator MT5 to a chart.
4. Select the structure settings and enabled timeframes.
5. Use the result together with support, resistance, risk management, and trade planning.
IMPORTANT INFORMATION
This product is a technical-analysis indicator. It does not open, modify, or close trades. It does not guarantee profits and should not be used as the sole basis for a trading decision. Market conditions can change rapidly, and every signal should be combined with appropriate risk management, market structure analysis, and, where relevant, fundamental awareness.
Past price behavior does not guarantee future results. Test the indicator on a demo account and select settings appropriate for the instrument, timeframe, spread, and trading style being used.