Fibonacci Pips MT4

  • Indicadores
  • Sindhu Bairavim
    Sindhu Bairavim
    4.5 (22)
    Sou um Arquiteto Técnico com mais de 14 anos de experiência na criação de soluções de software confiáveis e de alta qualidade. Trago a mesma precisão, estrutura e mentalidade de resolução de problemas para o desenvolvimento de indicadores e Expert Advisors em MQL5. Meu foco está na criação de
  • Versão: 1.0
  • Ativações: 20

Fibonacci Pips MT4

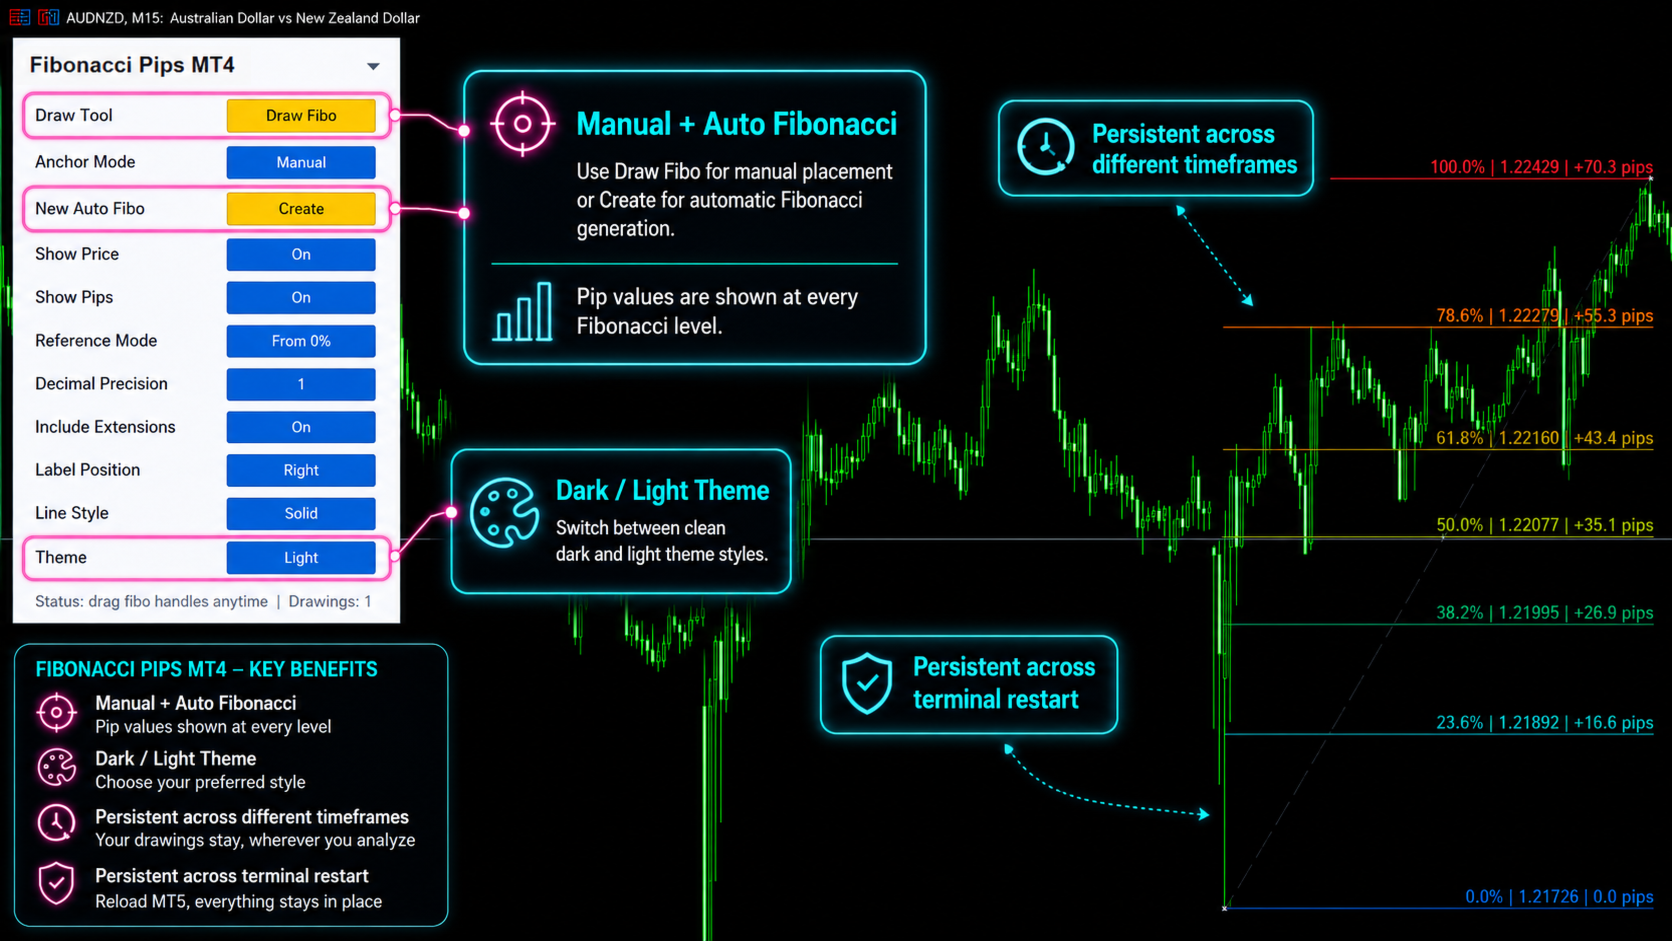
Instant Fibonacci Levels, Prices and Pip Distances

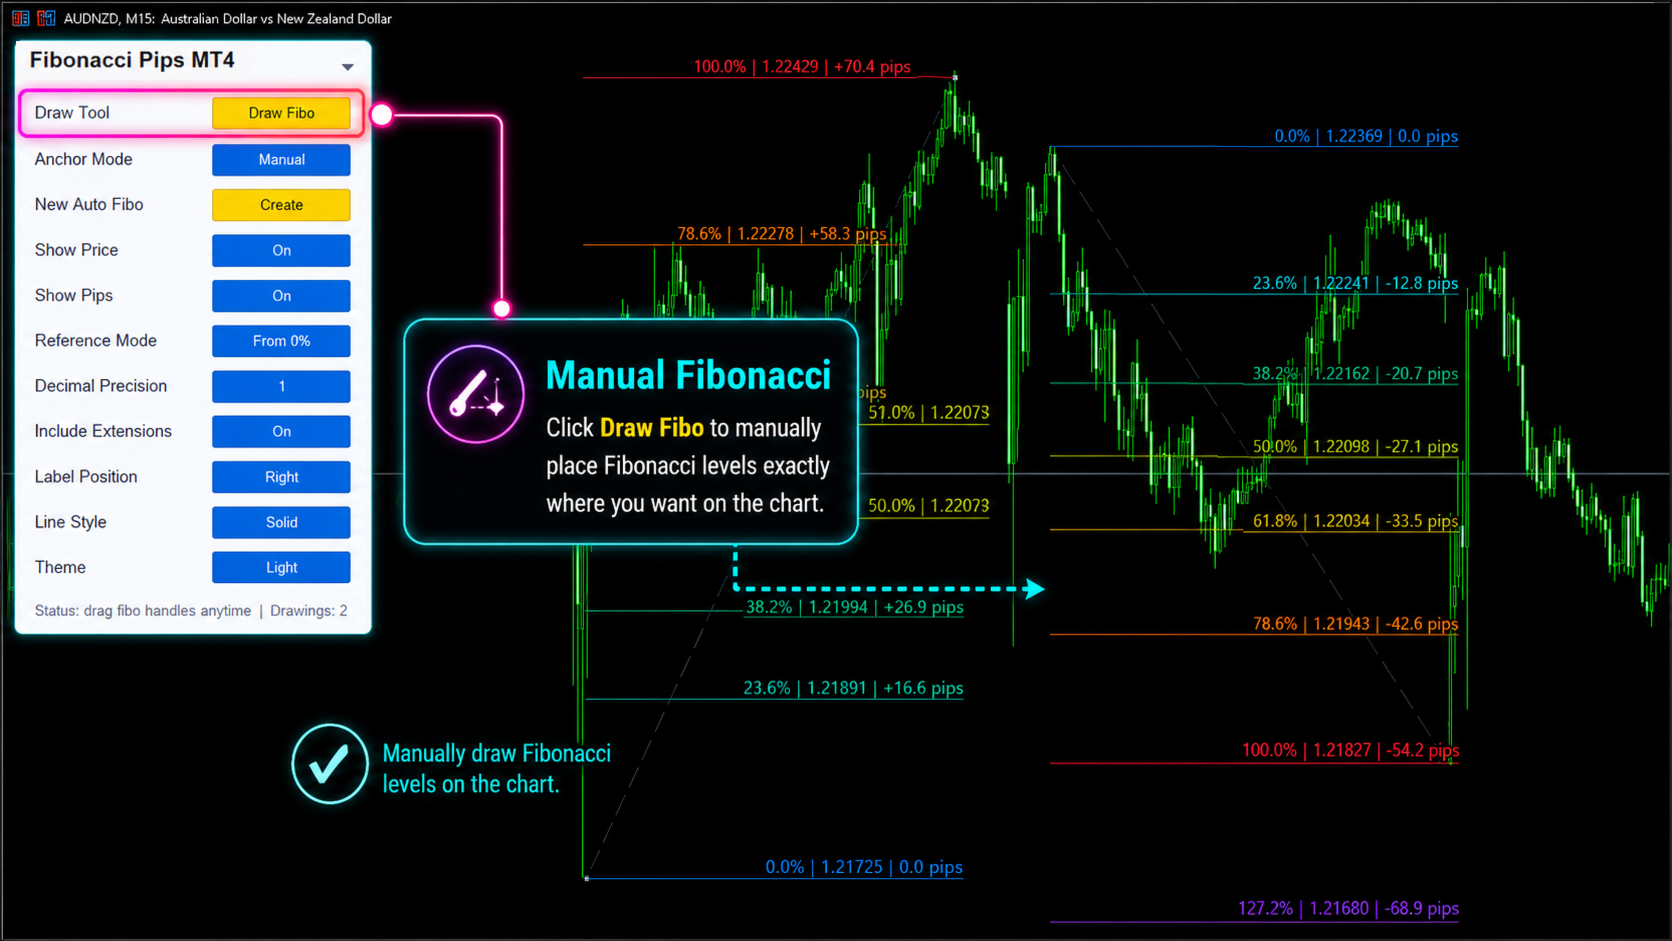
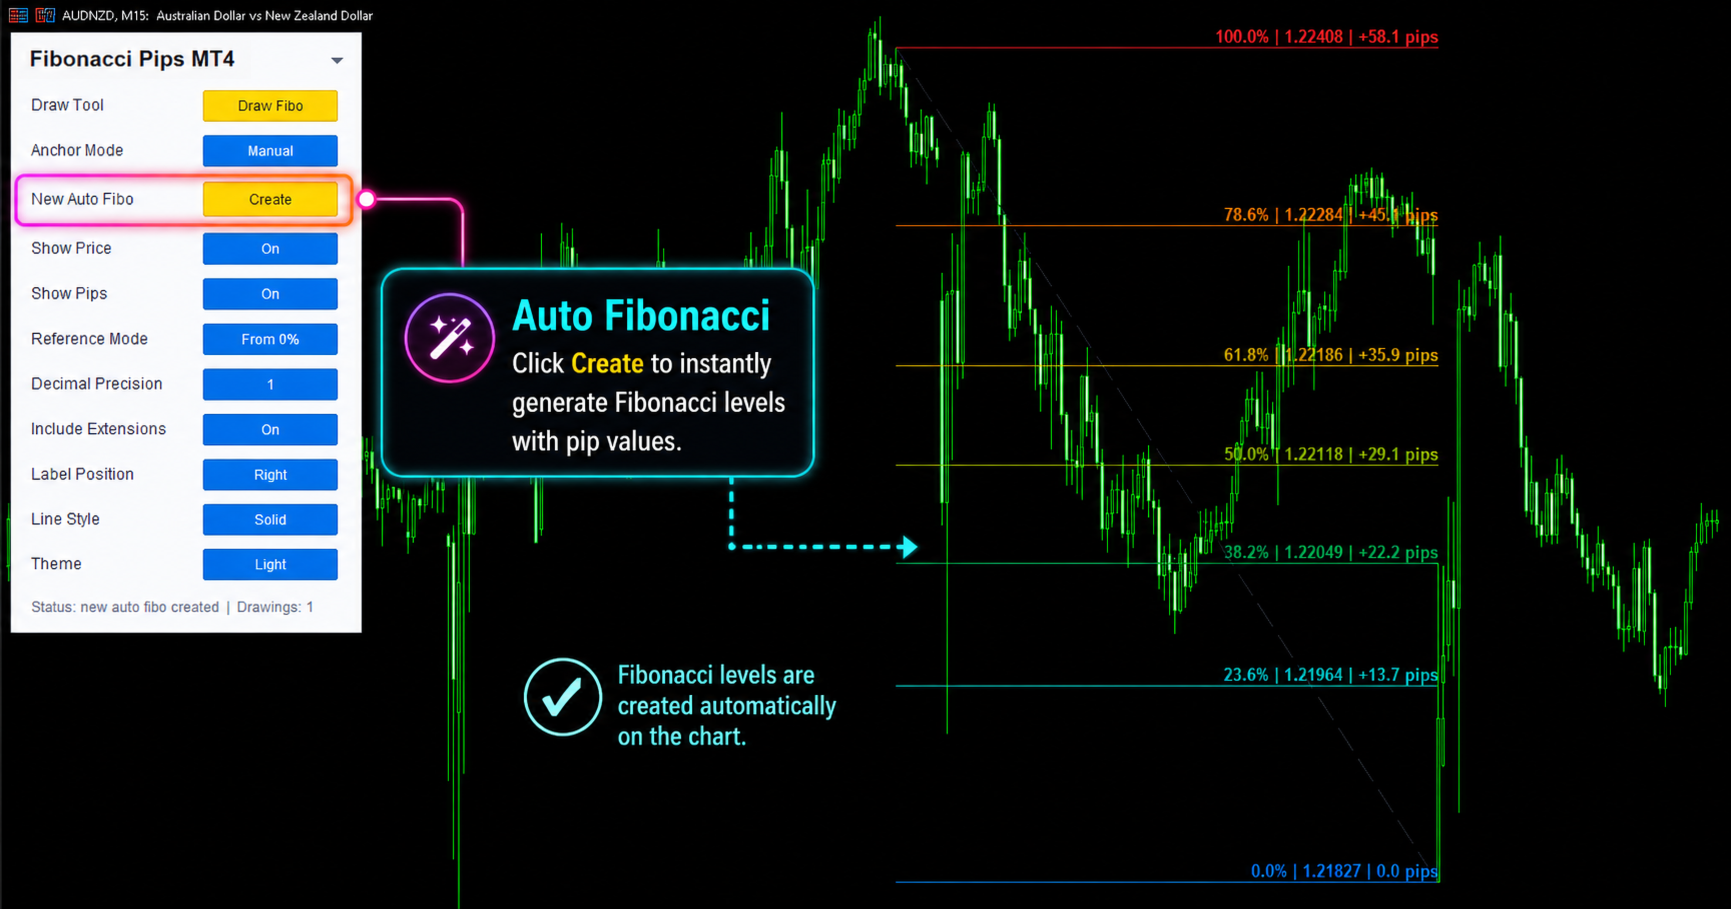
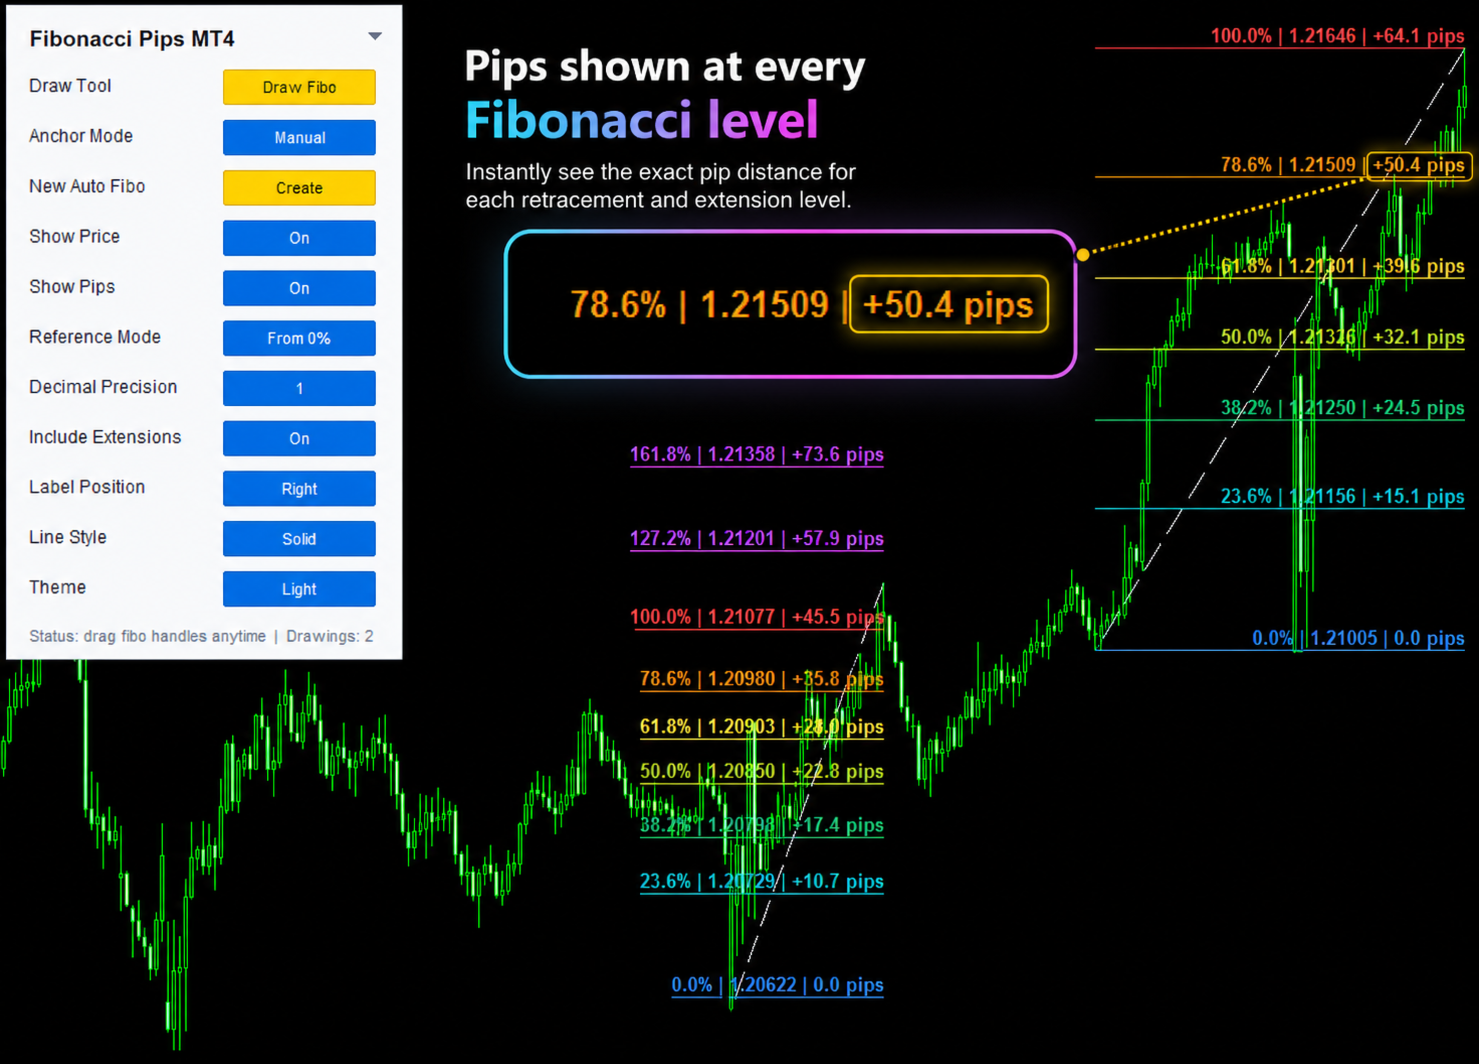
Fibonacci Pips MT4 is a practical Fibonacci measurement tool for MetaTrader 4. It displays each Fibonacci level together with its exact price and pip distance, helping traders plan pullbacks, profit targets and stop-loss levels without manual calculations.

Instead of seeing only percentages such as 38.2%, 50.0% or 61.8%, traders can immediately understand:

  • The Fibonacci level
  • The exact market price
  • The pip distance from the reference point

This turns traditional Fibonacci analysis into clear, usable trading information.

Solve Everyday Fibonacci Measurement Problems

Many traders know the level they want to use, but still need to calculate the exact distance manually.

Fibonacci Pips MT4 helps solve common issues such as:

  • Knowing the level but not the pip distance
  • Measuring targets manually
  • Pip confusion on Gold and JPY pairs
  • Different price formats across markets
  • Repeated crosshair measurements
  • Cluttered charts with too many objects

The indicator calculates and displays the information neatly on the chart.

See Every Level in Pip Language

For each selected Fibonacci level, the indicator can show:

Fibonacci Level Price Pip Distance
38.2% 1.08528 -57.4 pips
50.0% 1.08351 -75.1 pips
61.8% 1.08175 -92.7 pips
127.2% 1.07195 -190.7 pips

At a glance, traders can see where the level is located and how far price must move to reach it.

Faster Pullback Analysis

In an uptrend, traders often watch the 38.2%, 50.0% and 61.8% retracement zones.

With Fibonacci Pips MT4, these levels are shown together with their measured distance. This helps traders evaluate how deep a pullback may be and compare different retracement zones more clearly.

For example:

  • 38.2% retracement: 57.4 pips
  • 50.0% retracement: 75.1 pips
  • 61.8% retracement: 92.7 pips

Simple Take-Profit Planning

Common Fibonacci extension levels such as 127.2% and 161.8% are often used as potential target areas.

The indicator shows the pip distance to each target directly, helping traders judge whether the projected move is realistic for the selected symbol, timeframe and market condition.

Clearer Stop-Loss Planning

Fibonacci Pips MT4 can also support stop-loss planning.

By comparing an entry area with the displayed Fibonacci price levels and pip distances, traders can estimate risk more efficiently and review whether the planned trade offers a suitable risk-to-reward structure.

Built for Different Markets

Pip and price movement calculations can vary between instruments.

Fibonacci Pips MT4 is designed to support chart analysis on broker-supported markets such as:

  • Forex pairs
  • JPY pairs
  • Gold and metals
  • Indices
  • Crypto CFDs
  • Other MT4 trading symbols

This can reduce manual calculation errors when switching between instruments with different decimal formats.

Clean Chart Presentation

The indicator displays the important information neatly on the right side of the chart:

  • Fibonacci percentage
  • Exact price
  • Pip distance
  • Clear and organized labels
  • Reduced chart clutter
  • Faster manual analysis

Useful For

  • Fibonacci traders
  • Scalpers
  • Intraday traders
  • Swing traders
  • Price-action traders
  • Forex traders
  • Gold traders
  • Index traders
  • Crypto CFD traders
  • Manual traders

Real Trading Example

Suppose XAUUSD is moving strongly upward and Fibonacci is drawn from the swing low to the swing high.

The indicator may display:

Fibonacci Level Price Pip Distance
38.2% 2334.50 -82.0 pips
50.0% 2330.20 -125.0 pips
61.8% 2325.90 -168.0 pips
127.2% 2368.40 +257.0 pips
161.8% 2382.70 +400.0 pips

This gives the trader immediate clarity about pullback depth, target distance and the practicality of the planned risk-to-reward setup.

Important Notice

Fibonacci Pips MT4 is a measurement and trade-planning indicator.

It does not generate BUY or SELL signals and does not predict market direction. It is designed to support manual decision-making by making Fibonacci levels easier to understand and measure.

MT5 Version

Looking for MetaTrader 5? The MetaTrader 5 version of this indicator is available to download from here.

Stay Updated

Join the MQL5 Channel for product updates and discounts:
Produtos recomendados
NO REPAINT ADVANCED CHART PATTERN INDICATOR By definition, a price ( chart)  pattern is a recognizable configuration of price movement that is identified using a series of  trendlines  and/or curves. When a price pattern signals a change in trend direction, it is known as a reversal pattern; a continuation pattern occurs when the trend continues in its existing direction following a brief pause. Advanced Chart Pattern Tracker is designed to find the MOST ACCURATE patterns. A special script is a
This indicator Super Channel Pro indicator.Indicator displays trend movement. Indicator calculates automatically line. Features FiltPer - displays indicator channel period. deviation - displays indicator channel deviation. deviation2 - displays indicator channel deviation. How to understand the status: If the arrow is green, trend is up. If the arrow is red, trend is down. ///////////////////////////////////////////////////////////////////////////////////////////////////////////////////////////
Indicators 14 in 1
Makarii Gubaydullin
5 (1)
14 Indicadores e ferramentas auxiliares para negociação conveniente Este utilitário contém 14 ferramentas adicionais que podem ser úteis para certas ações do trader,   simplificando e acelerando o processo de negociação. Confira o meu  #1 Trade Manager : inclui 66+ recursos e indicadores  |   Entre em contato  se tiver alguma dúvida Devido às diferentes resoluções de monitor, alguns usuários podem encontrar os rótulos sobrepostos ou muito pequenos. Se você encontrar esse problema, pode ajustar o
Swing High Low Fibonacci
Frank Wesley Iii Mccallister
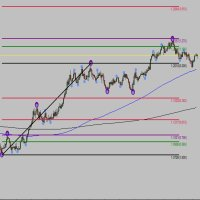
This indicator identifies the major and minor swing high and low points on a chart. It then takes the most recent swing and draws a fibonacci pattern of retracement and extension levels to give you an idea of where price may move next. It allow allows you to set a pair of moving averages to help identify the direction of the overall trend. There are configuration parameters for the major and minor swing and the moving averages.
NQX Expansion Candle Burst MT4 é um indicador de sinais para MetaTrader 4: sinais de candle de expansão (só sinaliza quando a volatilidade está se expandindo acima da sua média recente). Lógica NQX proprietária que detecta um candle de expansão que pega os dois lados do anterior. Só sinaliza quando a volatilidade está se expandindo acima da sua média recente. Desenha a entrada sugerida, um stop curto e alvos longos (3:1, 5:1, 10:1, até 20:1 no swing); você decide. O que ele desenha no gráfico -
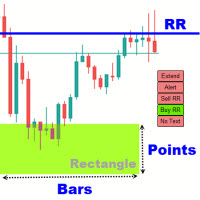
Rectangle Trading Custom   is a powerful technical analysis tool designed for price action and range-based traders. It allows users to define consolidation zones and receive alerts when the price breaks out of these zones or approaches trendlines drawn on the chart. Rectangles and Trendlines will be extended into future with one click. Rectangle point size, name and prices will be displayed around rectangle. Key Features: Draw Trading Zones (Rectangle Zones) Users can manually draw rectangles t
Axiom FVG and OB Mt4
Miguel Angel Leon Yanez
AXIOM FVG + Order Block Pro v4.1 Indicador institucional profissional ICT e SMC para MetaTrader 5. Visão Geral AXIOM FVG + Order Block Pro é um indicador não repintante que detecta Fair Value Gaps e Order Blocks com base nas metodologias ICT e SMC. Ele identifica zonas de oferta e demanda onde é provável que ocorra atividade institucional. Principais Recursos Detecção de Fair Value Gap em qualquer período com tamanho mínimo configurável e rastreamento de mitigação em tempo real. Detecção de Orde
The indicator is designed for determining Fibonacci levels. Does not repaint/redraw The blue level shows the zero Fibonacci value (it is also the Pivot level) Red levels show calculated Fibonacci levels (used as a rollback or reversal point) Automatic period detection (periods can be entered manually) Adjustable display calculation method. Settings BarsHistory - the number of bars to be used to display the indicator. Method - method of calculation. AutoPeriod - automated period calculation (true
PivotTide
Evgeniy Zhdan
Pivot Tide — Pivôs de onda, linhas de tendência automáticas e direção da tendência com base nas linhas O Pivot Tide é um indicador para o MetaTrader 4 que divide automaticamente o gráfico em ondas, marca as máximas e mínimas de cada onda, traça linhas de tendência através delas e determina a direção da tendência a partir do estado dessas linhas. Tudo é desenhado diretamente no gráfico, junto com um painel de informações compacto. Funciona em qualquer símbolo e em qualquer período gráfico. MT5-ve
O ruído do mercado é um indicador que determina as fases do mercado em um gráfico de preços e também distingue movimentos de tendência suaves e claros de movimentos planos barulhentos quando ocorre uma fase de acumulação ou distribuição. Cada fase é boa para seu próprio tipo de negociação: tendência para sistemas que seguem tendências e plana para sistemas agressivos. Quando o ruído do mercado começa, você pode decidir sair das negociações. Da mesma forma, e vice-versa, assim que o ruído acaba
Here   our more valuable tools SMC Trend Trading   ,  Easy SMC Trading  ,  Institutional SMC Architect Volume Analysis Tools  ,  Volume flow Profile  ,  Market volume profile  , FVG with Volume  , Liquidity Heatmap Profile  ,  Volume Spread Analysis The Market Profile & Volume Profile Indicator is a powerful technical analysis tool designed to visualize market activity and price distribution over specific timeframes. Unlike standard technical indicators that focus solely on price over time, th
Unique Professional 8 Snipe r is a  multi-timeframe indicator   that combines 8 different technical conditions to generate high probability BUY/SELL signal set ups and gives high probability precise entries. It's a non-repaint   indicator with 8 confirmations and then a precise entry when all conditions are met. Alerts and Push Notifications with Entry ,Tp and Sl MT 4 and MT5 Direct EA is free along with the purchase of indicator  Limited offer for few users only till 30th of September Best Fo
NQX Retracement Entry Burst MT4 é um indicador de sinais para MetaTrader 4: sinais de entrada na retração (só sinaliza quando a volatilidade está se expandindo acima da sua média recente). Lógica NQX proprietária que detecta um recuo até uma zona-chave de retração que se sustenta. Só sinaliza quando a volatilidade está se expandindo acima da sua média recente. Desenha a entrada sugerida, um stop curto e alvos longos (3:1, 5:1, 10:1, até 20:1 no swing); você decide. O que ele desenha no gráfico -
Qv2 Stdev
Joao Marcilio
Qv² Stdev é um indicador desenvolvido com base no desvio padrão de preços e volume de negociação. Os sinais de compra são indicados por setas para cima. Os sinais de venda são indicados por setas para baixo. Um detalhe importante é que o Volume Qv² possui duas bandas, uma superior e uma inferior, ambas servindo como alvo para o take profit. Recomenda-se usá-lo em H1 Pode ser usado em todos os pares (eu uso em Gold). Bom negócio, no mercado de tendências Para conhecer um pouco mais do meu
Supply and Demand Master — Non-Repaint Zone Indicator for MT4 Institutional-grade supply and demand zone indicator for MT4  Real-time pending signals, 100% non-repainting confirmed zones, 6 alert channels, signal arrows, and a live status panel. Works on every symbol and timeframe. [THE TRUTH MOST RETAIL TRADERS NEVER LEARN] Markets don't move on news, indicators, or patterns. They move on ORDERS — and the orders that move price are left sitting at SUPPLY AND DEMAND ZONES. Supply and Demand M
Harmonic Pattern Dashboard
Mihails Babuskins
4.2 (5)
harmonic patterns   Harmonic patterns can be used to spot new trading opportunities and pricing trends – but only if you know exactly what you are looking for. Harmonic patterns are formed by combining geometric shapes and Fibonacci levels. As a result, Fibonacci levels are the key concept of these patterns. Identifying harmonic patterns requires more practice than other market classical patterns. But by learning these patterns, you can recognize the future trend of the price chart. These patter
Fibonacci calculator is used with Elliot Waves, it can generate remarkable results. A trader could use these levels or ratios to find high probability trades with very small stop loss. You may also use these ratios to find Elliott Waves extensions and to book profit near those levels. For Elliot Wave experts, Fibonacci calculator is a highly useful tool that can assist them in calculating Fibonacci extension and retracement levels for the market price. The indicator proves itself as a useful one
This indicator is meant for Harmonic Traders, it helps them in identifying the formed patterns by analyzing the market past data, looking for Harmonic Patterns. The Patterns that this indicator can detect are: AB=CD Butterfly Gartely Crab Bat The indicator shows the following: The completed pattern, with the critical zone highlighted in Gray box The suggested 3 take profit levels (in green) The Suggested Stop Loss level (in Red) The formed pattern ratios can be checked by hovering the mouse on t
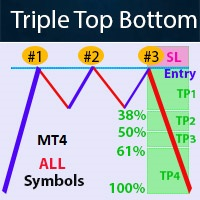
- All of my indicators are just 30$ !! Limited offer. Contact me for instruction, any questions! Introduction Chart patterns   are an essential tool traders and investors use to analyze the future price movements of securities. One such pattern is the triple bottom or the triple top pattern, which can provide valuable insights into potential price reversals. This pattern forms when a security reaches a low   price level   three times before reversing upward or reaches a high price level three t
Trend Rever
Vitalii Zakharuk
The Trend Rever indicator uses two lines of different colors to display buy or sell signals. The first of these lines is red and the second is blue. When changing the color of the lines, an arrow is also displayed, which indicates which deal to open, buy or sell. A simple but effective system for determining the Forex trend. The algorithm takes into account the measurement of prices, and this method also focuses on the measurement of each of the price drops - which gives more detailed informati
Market Fractal Analysis, Fractal Swing, Market Flow Fractal Cycles looks for Similar Patterns in the Market that repeat themselves because of the Market Fractal Nature. These patterns are displayed with help of Graphical Objects and Alerts can be received on their arrival. Read the Blog for full information. Features:- Auto Detection of Patterns Customization for Color and Line Styles Alerts, Emails & Push Notifications 
The Market Maker indicator focuses on key levels as minimum, maximum, opening and closing of important time frames. An attentive observation of these levels will enable you to identify the proper direction of the trend. On these levels the Market Makers try to make a very hunt of Stop Loss. We recommend to use Daily values on H1 chart, Weekly values on H4 chart and Monthly values on D1 charts. Use it setting all three time frames on the same chart and you will see that these levels will be a gre
The Sentiment Ratio indicator gauges current Market Sentiment between -100% and 100%, where lower than -40% is considered Bearish and higher than 40% is Bullish. The channel between the two is considered Neutral. The indicator has been a very useful filter tool for signals within a trading system. Example call function:  int SentimentIndicator(double triggerLevel)//Return sentiment if trigger level is activated {   double sentimentRatio=iCustom(NULL,0,"Sentiment Ratio",0,0,0);   if(sentimentRat
FREE
MoveWave
Andriy Sydoruk
MoveWave - Moving waves are very handy indicators for determining pivot levels. Most Forex traders make decisions based on technical analysis. This type of analysis determines patterns and trends in the market. With the help of complex mathematical equations that are combined and made out in the form of this indicator, the trader will be able to more accurately determine the price reversal levels. Wave theory mathematically represents various behavioral models of the market. It is used as the ba
Indicador Forex "Zonas de Rodadas Chave" para MT4. - O indicador "Zonas de Rodadas Chave" é um indicador auxiliar essencial para traders que consideram suporte/resistência. - Os níveis de 1000 e 500 rodadas são respeitados pelo preço - o preço se recupera deles com muita frequência. - Os principais níveis de 1000 também possuem fortes zonas de Suporte/Resistência (100 pontos em cada lado) ao seu redor. - Os níveis de 1000 e 500 rodadas também são bons para colocar Take Profits (à frente do níve
FiboZag
Andriy Sydoruk
Indicator FiboZag - transfer the indicator to the chart and the Fibonacci levels will be built automatically on the last ZigZag turn. The main advantage lies in the correct construction of Fibonacci levels and markup of price levels. Simple, visual and effective use. The indicator is not redrawn and does not lag. Works on all currency pairs and on all timeframes.
Smart Trend Filter Smart Trend Filter is a technical indicator for MetaTrader designed to help traders identify market trends, recognize potential BUY and SELL opportunities, and visualize trade risk and reward directly on the chart. Combining Moving Average (MA) and Average True Range (ATR) concepts, the indicator provides a dynamic trend-following framework with visual trading signals, adaptive trailing stop levels, and multiple take-profit targets. Whether you trade Forex, Gold, or other fina
Alert Stochastic
Eadvisors Software Inc.
Alert Series - Stochastic Adicionamos ao conceituado indicator Estocástico vários tipos de alertas para auxiliar a sua busca por melhores oportunidades no mercado. Funcionalidades do produto E-mail alert Alerta Sonoro Push Notificação (Alerta pode ser enviado ao seu celular) Sinais no chart Alert Box Parametros do Indicador Push Notification - Habilita notificações em seu smartphone (Android ou IOS) . Email Alert - Habilita o envio de e-mails com as notificações para o seu endereço. Sig
Volume Dominance Indicator MT4 Stop Guessing the Market. Start Reading Who Is Really in Control. Every successful trader knows one simple truth: Price tells you where the market is moving. Volume tells you why. Many traders spend years searching for the perfect entry, yet they overlook one of the most valuable pieces of market information—the balance of buying and selling pressure. Without understanding who truly controls the market, even the best-looking setups can quickly fail. Volume Dominanc
Crosshair Local Time
Alberto Gauer Borrego
If you ever wanted to know your local time (or NY time) at any bar on the chart without needing to waste time with mental calculations, look no further. This indicator creates a crosshair which you can drag anywhere on the chart and will show you the local time in a label on top of the time axis. Press the "c" key to show/hide the crosshair. Left click it to pick it up and drag anywhere, left click again let it go. You can't hide the crosshair without letting it go first. Time setting inputs
Os compradores deste produto também adquirem
Currency Strength Wizard é um indicador muito poderoso que fornece uma solução completa para uma negociação bem-sucedida. O indicador calcula o poder deste ou daquele par forex usando os dados de todas as moedas em vários intervalos de tempo. Esses dados são representados em uma forma de índice de moeda fácil de usar e linhas de energia de moeda que você pode usar para ver o poder desta ou daquela moeda. Tudo o que você precisa é anexar o indicador ao gráfico que deseja negociar e o indicador mo
Trend SniperX MT4
Sarvarbek Abduvoxobov
5 (6)
Trend Sniper X é um indicador de tendência multitemporal para MetaTrader 5 que ajuda os traders a identificar a direção da tendência e potenciais pontos de reversão com clareza e precisão. Para MT5: https://www.mql5.com/en/market/product/181101 Informação de preço: O preço atual é promocional e está sujeito a alterações à medida que novas atualizações e recursos forem lançados. Canal Code2Profit Domine o Mercado com Análise Multitemporal! Como Maximizar sua Taxa de Acerto com o Trend Sniper X: R
M1 Sniper
Oleg Rodin
4.97 (30)
O M1 SNIPER é um sistema indicador de negociação fácil de usar. É um indicador de seta projetado para o período M1. O indicador pode ser usado como um sistema independente para scalping no período M1 e pode ser usado como parte do seu sistema de negociação existente. Embora este sistema de negociação tenha sido projetado especificamente para negociação no M1, ele também pode ser usado em outros períodos. Originalmente, desenvolvi este método para negociar XAUUSD e BTCUSD. Mas considero-o útil ta
Smart Trend Trading System é um indicador para MetaTrader 4 que reúne informações de tendência, sinais de entrada e saída e níveis de preço em um único gráfico. Ele combina mais de 10 ferramentas de trading em um único sistema, incluindo detecção de tendência, zonas de reversão, Smart Cloud, lógica de trailing stop, suporte e resistência, coloração de candles, alertas e análise multi-timeframe. O sistema foi desenvolvido para ajudar você a operar diferentes condições de mercado: Mercados em tend
SIO Oscillator: oscilador auto-otimizável de desequilíbrio de semivariância Compre o indicador e receba GRÁTIS o Expert Advisor (EA) baseado nele. A maioria dos osciladores trata todo movimento de preço da mesma forma. O SIO separa a pressão de alta da pressão de baixa e mede o desequilíbrio entre elas, mostrando qual lado realmente controla o mercado: compradores ou vendedores. Quando o desequilíbrio atinge um extremo, o SIO gera um sinal claro com níveis de entrada, Stop Loss e Take Profit. O
Liquidity Scalper System: um sistema de trading baseado em liquidez no formato de indicador. A maioria dos indicadores mostra apenas uma seta, e depois o trader decide sozinho onde colocar o stop, onde está o alvo e se pode confiar no sinal. O Liquidity Scalper System cobre todo o ciclo da operação: encontra pools de liquidez, dá um sinal no seu rompimento, calcula imediatamente Entry, Stop Loss e três alvos, e mostra no painel as estatísticas e os resultados da validação em dados novos. O sist
Gann Made Easy
Oleg Rodin
4.84 (174)
Gann Made Easy é um sistema de negociação Forex profissional e fácil de usar, baseado nos melhores princípios de negociação usando a teoria do sr. W. D. Gann. O indicador fornece sinais precisos de COMPRA e VENDA, incluindo níveis de Stop Loss e Take Profit. Você pode negociar mesmo em movimento usando notificações PUSH. Entre em contato comigo após a compra para receber instruções de negociação e ótimos indicadores extras gratuitamente! Provavelmente você já ouviu muitas vezes sobre os métodos
Advanced Supply Demand
Bernhard Schweigert
4.91 (302)
Atualmente com 30% de desconto! A melhor solução para qualquer Trader Novato ou especialista! Este indicador é uma ferramenta de negociação exclusiva, de alta qualidade e acessível porque incorporamos uma série de recursos proprietários e uma nova fórmula. Com esta atualização, você poderá mostrar fusos horários duplos. Você não só será capaz de mostrar um TF mais alto, mas também mostrar ambos, o TF do gráfico, MAIS o TF mais alto: MOSTRANDO ZONAS ANINHADAS. Todos os traders de Oferta e Demanda
Este indicador é um indicador para análise automática de ondas que é perfeito para negociações práticas! Caso... Nota:   Não estou acostumado a usar nomes ocidentais para classificação de ondas. Devido à influência da convenção de nomenclatura de Tang Lun (Tang Zhong Shuo Zen), nomeei a onda básica como   uma caneta   e a banda de onda secundária como   um segmento   . ao mesmo tempo, o segmento tem a direção da tendência.   O segmento de tendência principal   é nomeado (esse método de nomencl
Actualmente 30% OFF ! A melhor solução para qualquer novato ou comerciante especializado! Este software de painel de instrumentos está a funcionar em 28 pares de moedas. É baseado em 2 dos nossos principais indicadores (Advanced Currency Strength 28 e Advanced Currency Impulse). Dá uma grande visão geral de todo o mercado Forex. Mostra valores avançados de força da moeda, velocidade de movimento da moeda e sinais para 28 pares de divisas em todos os (9) períodos de tempo. Imagine como a sua n
Non repaint MT4
Yan Zhen Du
5 (2)
This is a professional chart indicator designed for traders focused on stability and clear price action. It helps filter market noise and provides clear visual entry and exit zones for your trading decisions. Price Information: The current price is promotional and is subject to change as upcoming updates and new features are released. MQL5 public channel:  CLICK HERE for MT5:  Non-repainting MT5 version Core Features: Strictly Non-Repainting: The system is built with strict non-repaint logic. W
Scalper Vault
Oleg Rodin
4.9 (41)
O Scalper Vault é um sistema de negociação poderoso e completo, projetado para traders que buscam consistência em operações intraday. Este indicador de alta precisão funciona como um sistema de negociação autônomo, oferecendo análises de nível institucional tanto para o mercado Forex quanto para Opções Binárias. ENTRE EM CONTATO COMIGO APÓS A COMPRA PARA RECEBER DICAS DE NEGOCIAÇÃO E UM BÔNUS EXCLUSIVO! Ao eliminar suposições e análises manuais complexas, o Scalper Vault permite que você foque
Apresentamos o ON Trade Waves Patterns Harmonic Elliot Wolfe, um indicador avançado projetado para detectar diversos tipos de padrões no mercado, usando métodos manuais e automáticos. Aqui está como ele funciona: Padrões Harmônicos: Este indicador pode identificar padrões harmônicos que aparecem em seu gráfico. Esses padrões são essenciais para traders que praticam a teoria de negociação harmônica, conforme popularizada no livro de Scott Carney "Harmonic Trading vol 1 e 2". Seja desenhando-os m
RFI levels PRO
Roman Podpora
5 (2)
O indicador mostra com precisão os pontos de reversão e as zonas de retorno de preço onde o   Principais players . Você identifica onde novas tendências estão se formando e toma decisões com máxima precisão, mantendo o controle sobre cada negociação. VERSION MT5     -     Revela seu potencial máximo quando combinado com o indicador   TREND LINES PRO. O que o indicador mostra: Estruturas de reversão e níveis de reversão com ativação no início de uma nova tendência. Exibição dos níveis de   TAKE
Zoryk Gold mt4
Reda El Koutbane
5 (4)
O desconto termina em 24 horas — próximo preço $ 69 ZORYK — Sistema avançado de sinais e planejamento para XAUUSD no MetaTrader 4 Você conhece essa sensação. Você analisa o ouro, espera pela entrada e finalmente abre a operação. O preço começa a se mover contra você. Você fecha cedo demais, altera o Stop Loss ou hesita por alguns segundos. Logo depois, o mercado segue exatamente na direção que você esperava, mas sem você na operação. O problema nem sempre era a direção. O verdadeiro problem
ShapeRadar - indicador de padrões gráficos clássicos O ShapeRadar encontra automaticamente no gráfico os padrões clássicos da análise técnica: topos e fundos duplos e triplos, Ombro-Cabeça-Ombro e sua versão invertida, cunhas ascendentes e descendentes, retângulos, triângulos, bandeiras e flâmulas. Quando o preço fecha além do limite de uma figura, o indicador desenha o padrão, o ponto de entrada, o nível de stop loss e o alvo, e um painel informativo resume todos os padrões detectados. Versão p
O sistema PRO Renko é um sistema de negociação altamente preciso especialmente concebido para a negociação de gráficos RENKO. Trata-se de um sistema universal que pode ser aplicado a vários instrumentos de negociação. O sistema neutraliza eficazmente o chamado ruído de mercado, dando-lhe acesso a sinais de inversão precisos. O indicador é muito fácil de usar e tem apenas um parâmetro responsável pela geração de sinal. Você pode facilmente adaptar a ferramenta a qualquer instrumento de negocia
SR Liquidity
Oleg Rodin
5 (3)
O SR Liquidity é um indicador de trading projetado para revelar as zonas ocultas onde a liquidez do mercado se concentra e o preço reage com maior intensidade. Essas áreas específicas de liquidez funcionam como níveis poderosos de suporte e resistência, oferecendo um mapa claro de onde é mais provável que o mercado reverta. Em vez de traçar linhas comuns de Suporte e Resistência, o SR Liquidity analisa o comportamento real dos preços para detectar as zonas onde se acumulam pressões de compra e v
Auto Optimized SpeedAngle é um sistema de vetorização de momentum de nível institucional que elimina o sobreajuste ( curve-fitting ) por meio da otimização contínua de avanço ( Walk-Forward Optimization , WFO). Em vez de depender de entradas estáticas que se degradam quando os regimes de mercado mudam, o indicador recalibra dinamicamente seus parâmetros utilizando validação fora de amostra ( Out-of-Sample , OOS), garantindo que os sinais exibidos representem vantagens estatísticas genuínas e não
Professional Volume Profile An indicator for MetaTrader 4 that builds a horizontal Volume Profile directly on the price chart. It shows the levels where traders executed the most trades, helping to identify support/resistance zones and assess the balance of power in the market. What the Indicator Displays POC (Point of Control) — the level with the maximum trading volume (red line). VAH / VAL (Value Area High / Low) — the upper and lower boundaries of the value area, where 70% of the volume was
Italo Volume Indicator
Italo Santana Gomes
4.92 (79)
BUY INDICATOR AND GET EA FOR FREE AS A BONUS + SOME OTHER GIFTS! ITALO VOLUME INDICATOR  is the best volume indicator ever created, and why is that? The Indicator works on all time-frames and assets, indicator built after 7 years of experience on forex and many other markets. You know many volume indicators around the internet are not complete, does not help, and it's difficult to trade, but the Italo Volume Indicator is different , the Italo Volume Indicator shows the wave volume, when market
Estima o movimento de preço mais provável no curto prazo com base em cálculos matemáticos avançados. Características Estimativa do movimento imediato do preço no timeframe do gráfico e em todos os superiores; Cálculo da tendência real do mercado; Cálculo dos níveis de suporte e resistência mais importantes; Alertas de zonas de congestão, cruzamentos de níveis e mudanças de tendência; Leve nos recursos do sistema: as linhas e o painel só são atualizados quando um valor muda; Autoajustável: funci
Atomic Analyst
Issam Kassas
5 (14)
Atomic Analyst — MetaTrader 4 Para dúvidas sobre o produto, orientação de configuração ou suporte técnico, envie-me uma mensagem diretamente aqui no MQL5. O indicador transforma cálculos complexos do mercado em sinais visuais simples, candles coloridos, leituras de tendência, níveis de stop loss e várias zonas de take profit que os traders podem entender rapidamente e usar em condições reais de mercado. Principais usos de trading: Scalping e day trade: Desenvolvido para tomada de decisão rápida
Scalping Entry Points - é um sistema de negociação manual que pode se ajustar aos movimentos de preços e dar sinais para abrir negociações sem redesenhar. O indicador determina a direção da tendência pelo nível central de suporte e resistência. O indicador de ponto fornece sinais para entradas e saídas. Adequado para negociação intradiária manual, escalpelamento e opções binárias. Funciona em todos os prazos e instrumentos de negociação. O indicador dá vários tipos de alertas. Como usar o produ
All in One package includes the  Oscillator Predictor ,  MACD Predictor ,  Thrust Scanner  and  Advanced Fibonacci  indicators which are mandatory for applying  Dinapoli  trade plans.  Please visit below links for detailed explanations of indicators. Advanced Fibonacci Indicator =>  https://www.mql5.com/en/market/product/52834 Thrust Scanner Indicator => https://www.mql5.com/en/market/product/52830 Overbought /Oversold Predictor indicator => https://www.mql5.com/en/market/product/52621 Macd P
True Direction Oscillator
Muhammad Elbermawi
4.85 (364)
Ou (TDO) que é um índice que mede a taxa de variação do preço usando o princípio de " Pure Momentum ". Quando o preço de um título avança de 10 para 15, a taxa de variação do preço é 150%, mas quando diminui de 15 para 10, a taxa de variação do preço é apenas 33,3%. É por isso que os indicadores de análise técnica como "Taxa de variação do preço" (ROC) ou "Momentum" fornecem leituras mais altas para movimentos de preços ascendentes do que para os descendentes. O TDO corrige esse problema para aj
Quantum Imbalance Profiles   é um indicador das fases de equilíbrio e desequilíbrio. Ele mostra em quais preços o mercado negociou volume, qual lado dominou dentro dessa zona e por quais níveis o preço depois se expandiu com impulso. Um perfil de volume clássico responde a uma única pergunta: onde ocorreu a negociação. Ele não mostra qual lado dominou em cada preço, como terminou a consolidação nem em que direção o mercado saiu dela. Quantum Imbalance Profiles constrói o perfil no modo Volume Bi
Indicador para negociação manual e análise técnica para Forex. Consiste em um indicador de tendência com o nível de abertura do dia de negociação e um indicador de seta para determinar os pontos de entrada. O indicador não muda de cor; funciona quando a vela fecha. Contém vários tipos de alertas para setas de sinalização. Pode ser configurado para funcionar em qualquer gráfico, instrumento de negociação ou período de tempo. A estratégia de trabalho baseia-se na busca de movimentos de preços ao
Currency Strength Matrix
Raymond Gilmour
4.5 (26)
THE ONLY CURRENCY STRENGTH INDICATOR BUILT ON PRICE ACTION Most currency strength meters average an oscillator, or measure how far price has travelled. But these are not accurate measures of trend, Currency Strength Matrix measures trend strength, not just if a currency price has gone up or down. Currency Strength Matrix reads market structure . For each of the 28 major pairs it finds the confirmed cycle highs and lows, and decides whether that pair is in an uptrend, a downtrend, or neither. A
Dark Support Resistance  is an Indicator for intraday trading. This Indicator is programmed to identify  Support and Resistance Lines , providing a high level of accuracy and reliability. Key benefits Easily visible lines Only the most important levels will be displayed Automated adjustment for each timeframe and instrument Easy to use even for beginners Never repaints, never backpaints, Not Lag 100% compatible with Expert Advisor development All types of alerts available: Pop-up, Email, Push
Mais do autor
Gold Beast MT5
Sindhu Bairavim
5 (3)
GOLD BEAST MT5 EA Gold Beast MT5 é um EA de grid trading automatizado criado para XAUUSD. Cada operação segue uma estratégia definida com múltiplas camadas de confirmação. Ele segue uma abordagem de negociação baseada em cestas, controlada e cuidadosamente projetada. Sucesso de lançamento : As primeiras 10 cópias a 39 USD esgotaram rápido! Agora estamos no segundo lote. Restam apenas 1 de 5 cópias a $89. Próximo preço: $149. Anexe o EA a um gráfico H1 do XAUUSD, carregue o arquivo SET correto, a
Wyckoff Phase Matrix Pro MT5 Wyckoff Phase Analysis, Trade Levels and Performance Statistics in One Dashboard Wyckoff Phase Matrix Pro MT5 is a structured market-analysis indicator that brings Wyckoff phase reading, setup bias, Entry/TP/SL levels, win-rate data, statistics and an equity curve into one clean MetaTrader 5 dashboard. It is designed to help traders understand current market structure more clearly, reduce chart-reading confusion and plan trades with defined levels instead of relying
Ninja X3 MT5
Sindhu Bairavim
Ninja X3 MT5 EA Special Launch Offer: Only 9 copies left at 39 USD. Once this limit is reached, the price will increase to 89 USD. Ninja X3 MT5 is an Expert Advisor developed specifically for USDJPY on the H1 timeframe. The strategy focuses on identifying structured market opportunities using dynamic support and resistance, trend direction and price confirmation before allowing an entry. A selective automated USDJPY trading system designed for traders who prefer controlled trade frequency rather
Avatar Fibo MT5
Sindhu Bairavim
Avatar Fibo MT5 EA Special Launch Offer: Only 9 copies left at 39 USD. Once this limit is reached, the price will increase to 89 USD. Avatar Fibo MT5 is an Expert Advisor developed specifically for XAUUSD on the M15 timeframe . Fibonacci retracement is widely used in trading, but the difficult part is deciding which retracement zone, confirmation method, and market condition should actually qualify as an entry. Three independent Fibonacci retracement strategies combined into one automated Gold t
Live Risk Dashboard MT5 EA Monitor your account risk clearly and trade within your limits Live Risk Dashboard MT5 EA is a practical account-monitoring utility for MetaTrader 5. It displays your most important trading and risk information directly on the chart, helping remove the "math anxiety" of managing open positions. Instead of repeatedly checking different MT5 windows or manually calculating floating profit, drawdown usage, and remaining limits, you can view everything in one clean, compact
FREE
Live Risk Dashboard MT4 EA Monitor your account risk clearly and trade within your limits Live Risk Dashboard MT4 EA is a practical account-monitoring utility for MetaTrader 4. It displays your most important trading and risk information directly on the chart, helping remove the "math anxiety" of managing open positions. Instead of repeatedly checking different MT4 windows or manually calculating floating profit, drawdown usage, and remaining limits, you can view everything in one clean, compact
FREE
Wyckoff Phase Matrix Pro MT4 Wyckoff Phase Analysis, Trade Levels and Performance Statistics in One Dashboard Wyckoff Phase Matrix Pro MT4 is a structured market-analysis indicator that brings Wyckoff phase reading, setup bias, Entry/TP/SL levels, win-rate data, statistics and an equity curve into one clean MetaTrader 5 dashboard. It is designed to help traders understand current market structure more clearly, reduce chart-reading confusion and plan trades with defined levels instead of relying
Peak Pips MT4 Zero-Repainting Trend Signals, Peak-Pips Tracking and Multi-Timeframe Scanning Peak Pips MT4 is a powerful trend-analysis indicator designed to help traders identify fresh BUY and SELL opportunities for scalping, intraday and swing trading, all from one chart. Backed by 23 years of testing with Dukascopy 100% tick data, the indicator combines a protected signal algorithm, confirmed zero-repainting signals, live peak-pips tracking and a built-in multi-timeframe scanner in one trader
Session Clock MT4 Know Which Forex Session Is Active – Without Manual Time Calculations Session Clock MT4 is a clean trading-time dashboard for MetaTrader 4. It displays the four major Forex market sessions – Sydney, Tokyo, London, and New York – together with their opening times, closing times, live status, and the countdown to the next session. Forex market activity changes throughout the day. Some periods are quiet, while others bring faster price movement and higher volatility. Session Clock
Ninja X3 MT4
Sindhu Bairavim
Ninja X3 MT4 EA Special Launch Offer: Only 10 copies left at 39 USD. Once this limit is reached, the price will increase to 89 USD. Ninja X3 MT4 is an Expert Advisor developed specifically for USDJPY on the H1 timeframe. The strategy focuses on identifying structured market opportunities using dynamic support and resistance, trend direction and price confirmation before allowing an entry. A selective automated USDJPY trading system designed for traders who prefer controlled trade frequency rathe
Peak Pips MT5
Sindhu Bairavim
5 (1)
Peak Pips MT5 Zero-Repainting Trend Signals, Peak-Pips Tracking and Multi-Timeframe Scanning Peak Pips MT5 is a powerful trend-analysis indicator designed to help traders identify fresh BUY and SELL opportunities for scalping, intraday and swing trading, all from one chart. Backed by 23 years of testing with Dukascopy 100% tick data, the indicator combines a protected signal algorithm, confirmed zero-repainting signals, live peak-pips tracking and a built-in multi-timeframe scanner in one trader
Fibonacci Pips MT5 Instant Fibonacci Levels, Prices and Pip Distances Fibonacci Pips MT5 is a practical Fibonacci measurement tool for MetaTrader 5. It displays each Fibonacci level together with its exact price and pip distance, helping traders plan pullbacks, profit targets and stop-loss levels without manual calculations. Instead of seeing only percentages such as 38.2%, 50.0% or 61.8%, traders can immediately understand: The Fibonacci level The exact market price The pip distance from the re
Session Clock MT5 Know Which Forex Session Is Active – Without Manual Time Calculations Session Clock MT5 is a clean trading-time dashboard for MetaTrader 5. It displays the four major Forex market sessions–Sydney, Tokyo, London, and New York – together with their opening times, closing times, live status, and the countdown to the next session. Forex market activity changes throughout the day. Some periods are quiet, while others bring faster price movement and higher volatility. Session Clock M
Filtro:
Sem comentários
Responder ao comentário