Fibonacci Pips MT4
- 지표
-
Sindhu Bairavim
 저는 14년 이상의 경력을 가진 테크니컬 아키텍트로서, 신뢰할 수 있는 고품질 소프트웨어 솔루션을 구축해 왔습니다. 저는 MQL5 인디케이터 및 Expert Advisor(EA)를 개발할 때에도 동일한 정밀함, 구조, 그리고 문제 해결 능력을 적용하고 있습니다. 저의 목표는 트레이더들이 시장을 더 명확하게 읽고, 추측을 줄이며, 자신감을 가지고 더 나은 정보에 기반한 결정을 내릴 수 있도록 돕는 실용적인 트레이딩 도구를 만드는 것입니다.
 - 버전: 1.0
- 활성화: 20
Professional Fibonacci pip measurement tool for MT4.
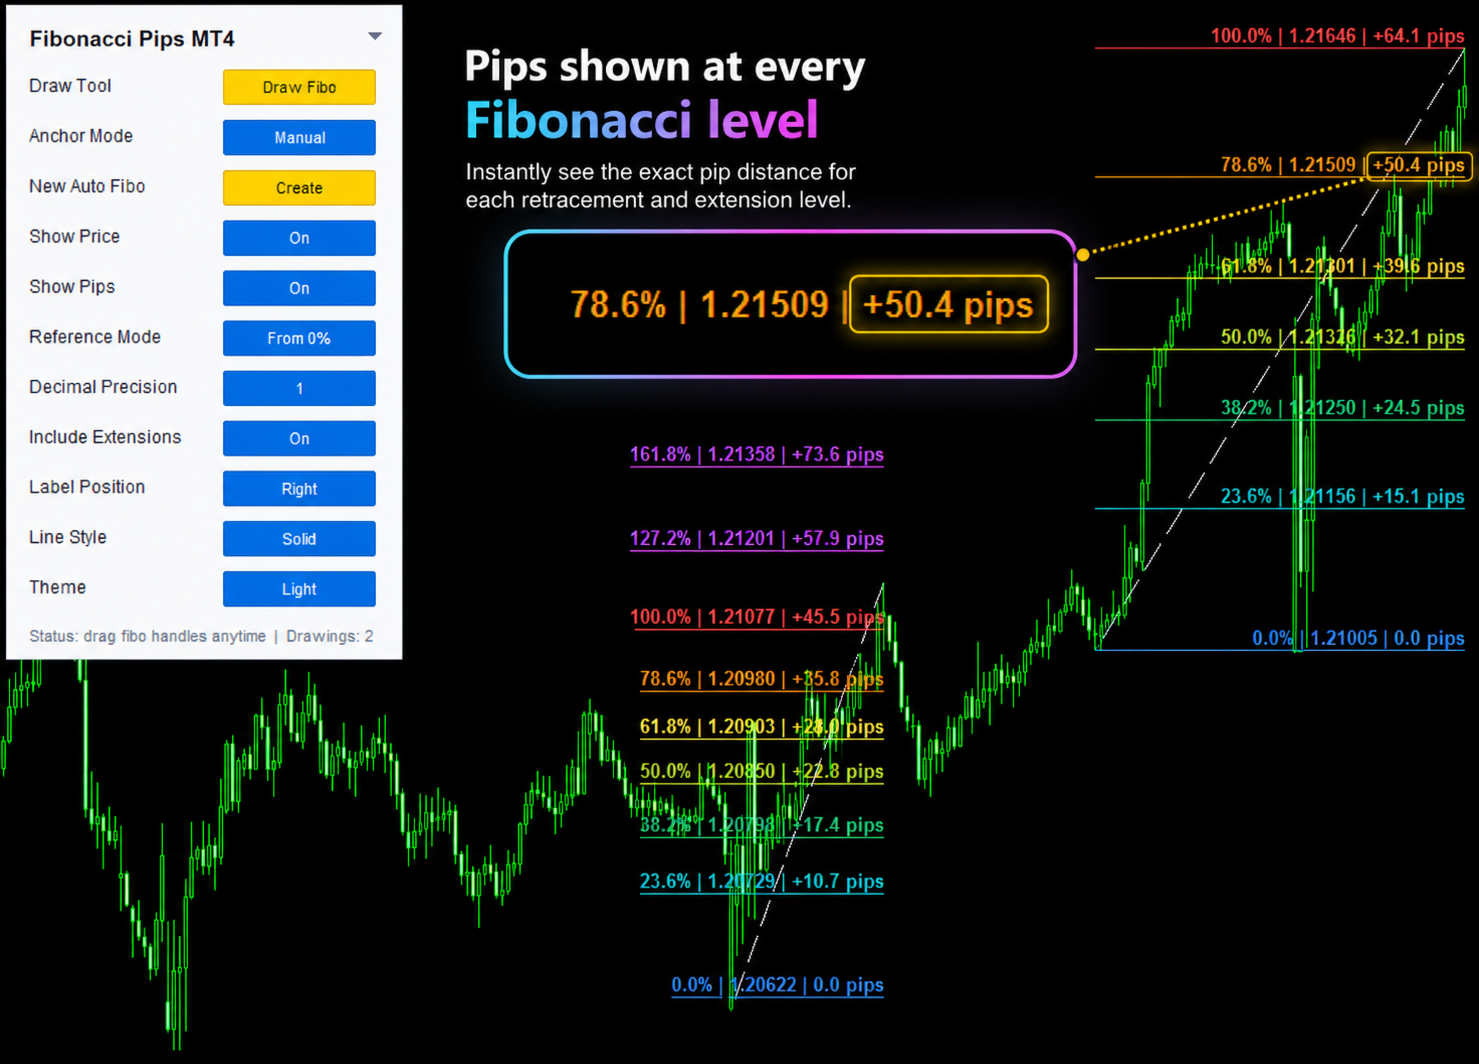
Fibonacci Pips MT4 shows levels, price, and pip distance instantly.
This Fibonacci Pips MT4 indicator was created mainly to solve one practical problem.
Many traders use Fibonacci in the market. But the small pain they face daily:
- Level is known, but pips are not known
- Target is known, but exact distance has to be calculated
- Pip confusion in Gold
- Pip confusion in JPY pairs
- Manual measurement is a waste of time
- Chart clutter
This product exactly solves that pain.
The purpose of this indicator:
To convert Fibonacci levels into pips language and show it to the trader.
Yes, Fibonacci Pips MT4 is created to show every Fibonacci level with exact price and pip distance, so traders can plan pullback entries, stop loss, and profit targets faster without manual pip calculation.
Example:
38.2% | 1.08528 | -57.4 pips
50.0% | 1.08351 | -75.1 pips
61.8% | 1.08175 | -92.7 pips
127.2% | 1.07195 | -190.7 pips
So as soon as the trader looks at the chart, they will understand:
- What is the price level?
- What is the Fibonacci level?
- What is the pip distance?
What is the practical use for a trader?
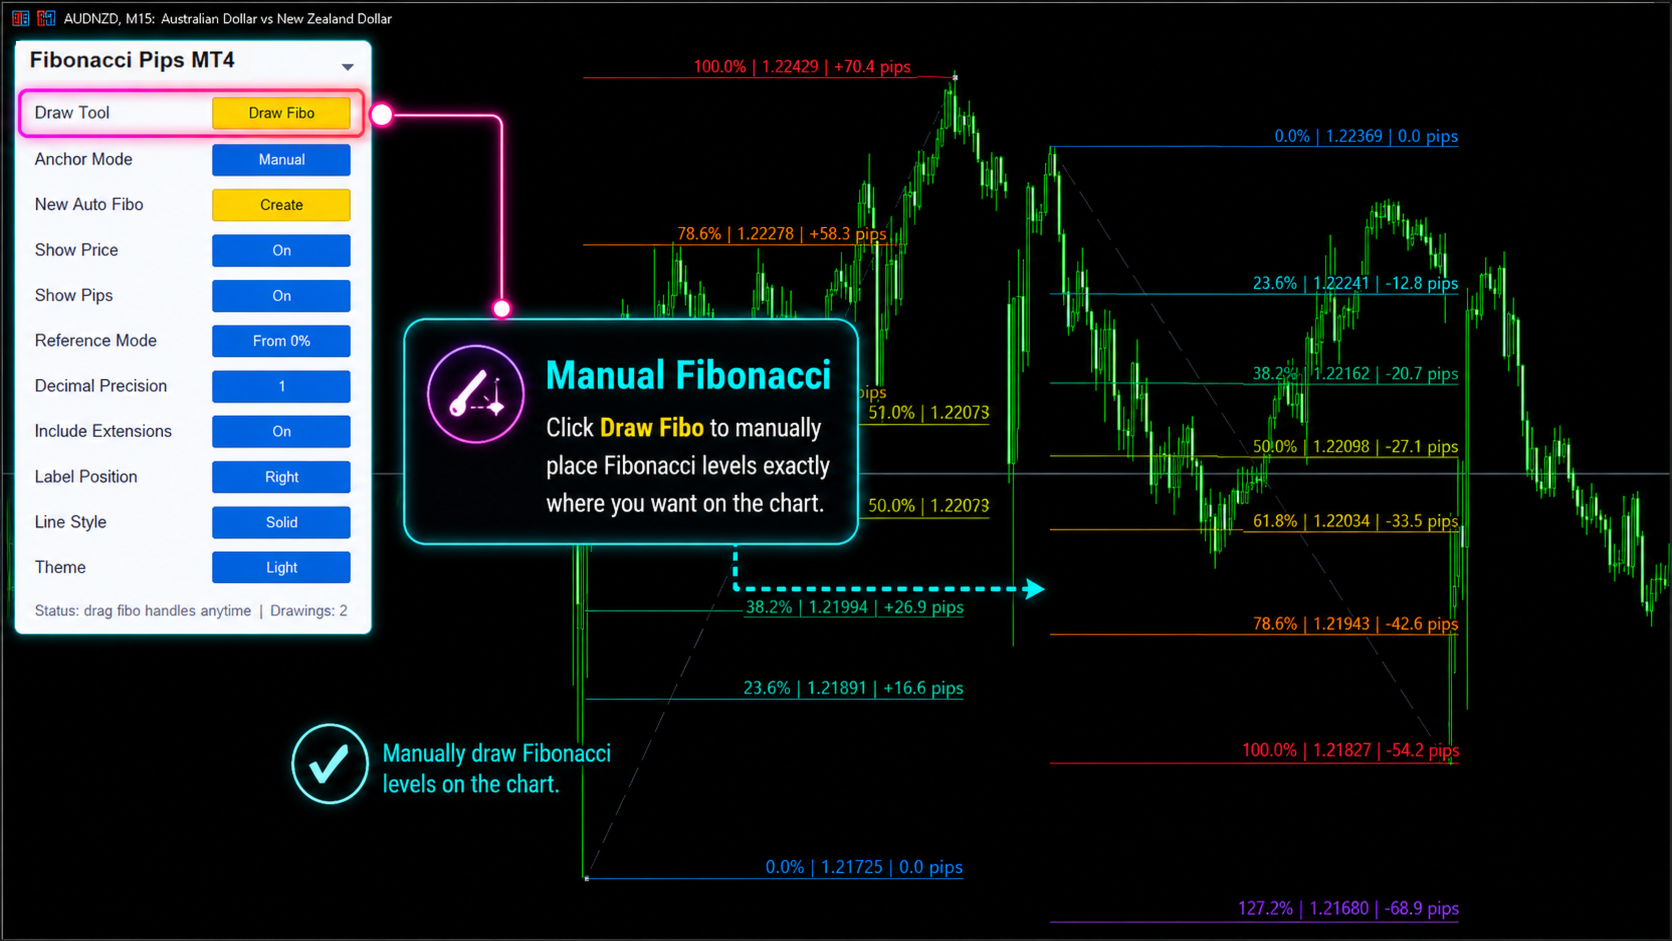
This is a practical utility indicator created to speed up the daily chart work for manual traders who use Fibonacci.
1. Pullback depth will be known easily
Suppose the market is in an uptrend.
Price moved from swing low to swing high.
Traders will usually wait for:
38.2 retracement
50.0 retracement
61.8 retracement
But in normal Fibonacci, only the level will be known.
In this indicator:
- 57.4 pips pullback to reach 38.2% level
- 75.1 pips pullback to reach 50.0% level
- 92.7 pips pullback to reach 61.8% level
So the trader will clearly know the pullback strength.
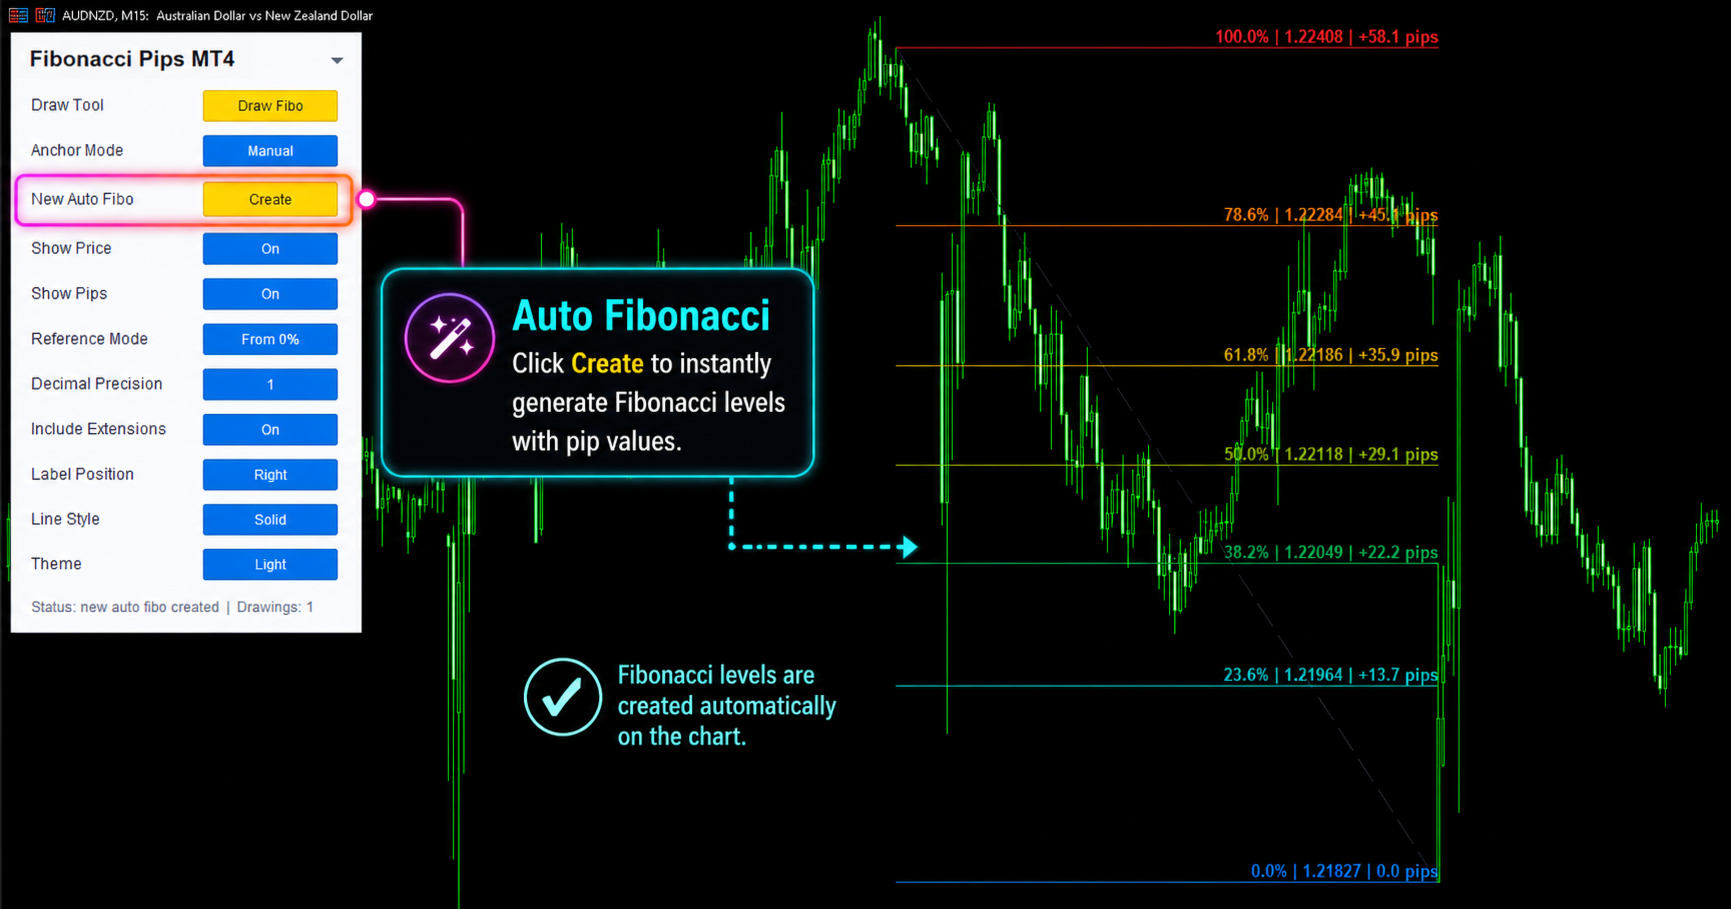
2. TP planning can be done fast
Extension levels:
127.2%
161.8%
These are common profit target zones.
This indicator will tell directly:
- 190.7 pips to reach 127.2% target
- 242.8 pips to reach 161.8% target
So the trader will immediately understand whether the target is realistic or not.
3. SL planning is easy
If a trader is going to place SL below 61.8:
How many pips from entry to SL?
This can be compared directly on the chart.
Risk calculation will become easy.
4. Will avoid manual calculation mistakes
Pips calculation is not the same for Forex, gold, indices, and crypto.
Example:
EURUSD pip logic is different
USDJPY pip logic is different
XAUUSD pip logic is different
BTCUSD movement logic is different
The value of this indicator is calculating pips cleanly and showing it in the label.
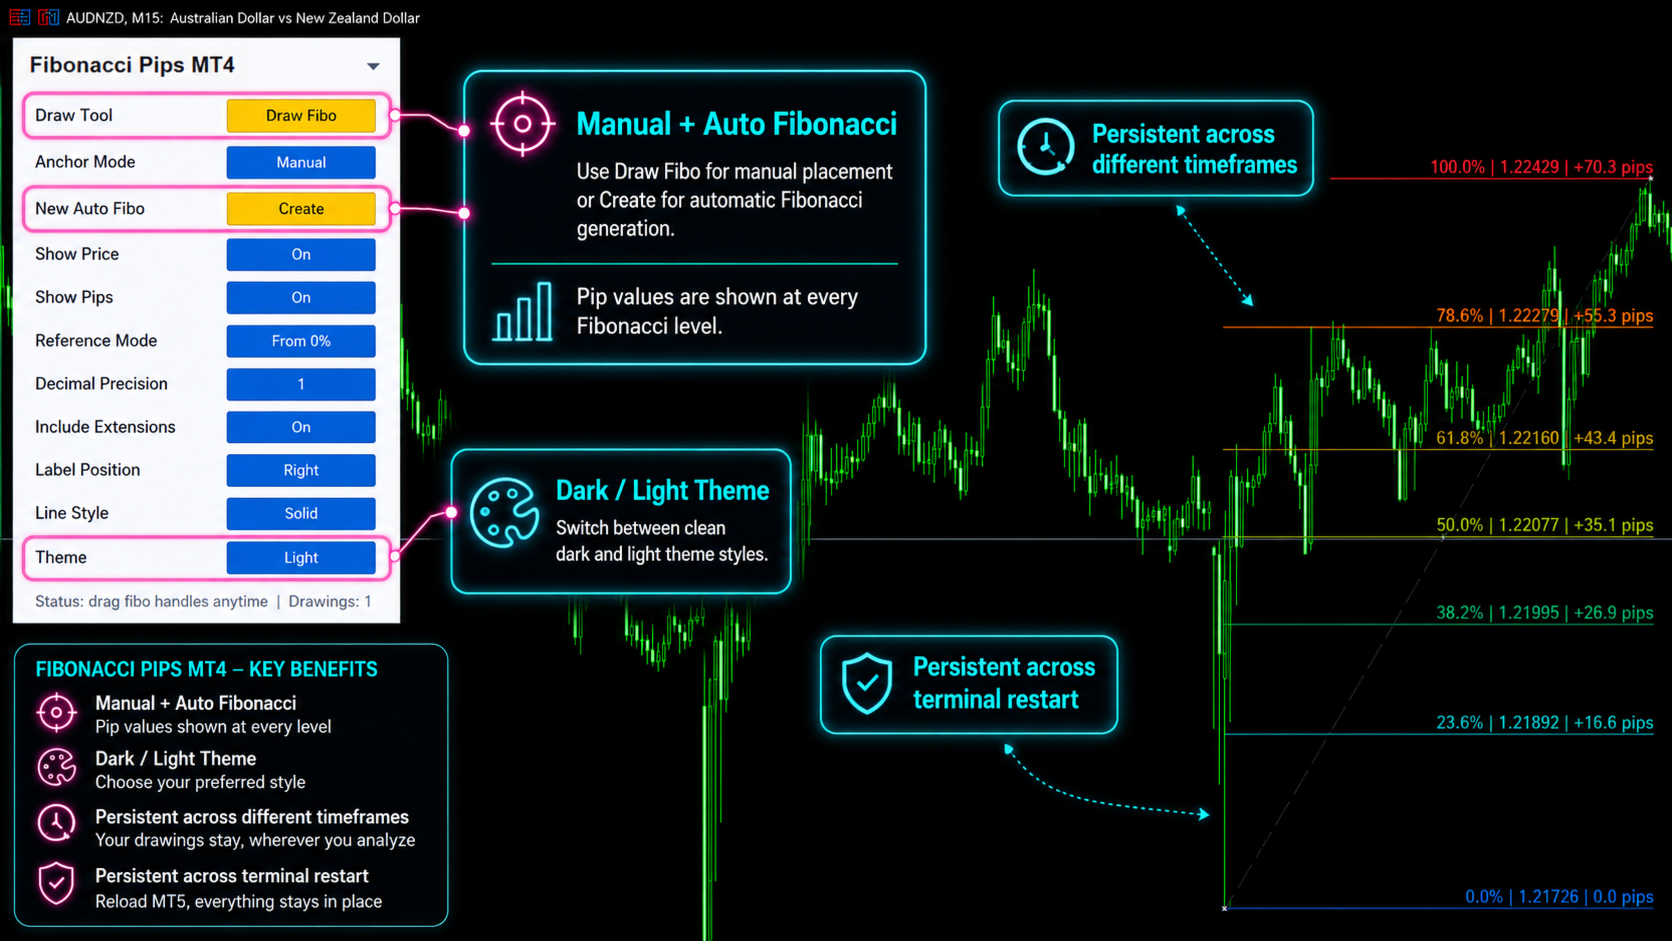
5. Fibonacci chart will become cleaner
In a normal chart, if a trader draws lines, puts text, uses crosshair, and adds many objects, it will become cluttered.
This indicator will professionally show:
- Level
- Price
- Pips
neatly on the right side alone.
Is this a signal indicator?
No friend. This is not a BUY / SELL signal indicator.
This is a trading measurement and planning tool.
Meaning:
Not to give signals, But
- To support trader decisions
- To make the Fibonacci level meaning clear
- To show the pip distance instantly
- To help with TP and SL planning
- Who will find it useful?
Who will find it useful?
- Fibonacci traders
- Scalpers
- Intraday traders
- Swing traders
- Gold traders
- Forex traders
- Index traders
- Crypto CFD traders
- Manual traders
- Price action traders
It is very useful especially for traders who use Fibonacci.
Real practical example
Suppose the price is moving up strongly in XAUUSD.
The trader draws Fibonacci.
In normal Fibonacci:
38.2
50.0
61.8
only these will be known.
In this indicator:
38.2% | 2334.50 | -82.0 pips
50.0% | 2330.20 | -125.0 pips
61.8% | 2325.90 | -168.0 pips
127.2% | 2368.40 | +257.0 pips
161.8% | 2382.70 | +400.0 pips
Seeing this, the trader will get clarity immediately:
- How much distance is the pullback zone?
- How much distance is the target?
- Is the risk reward practical?
- Is the trade worth it?