Volatility Adjusted Dynamic RSI

Dynamic RSI Volatility Based

Creator: https://www.quant-atlas.com/

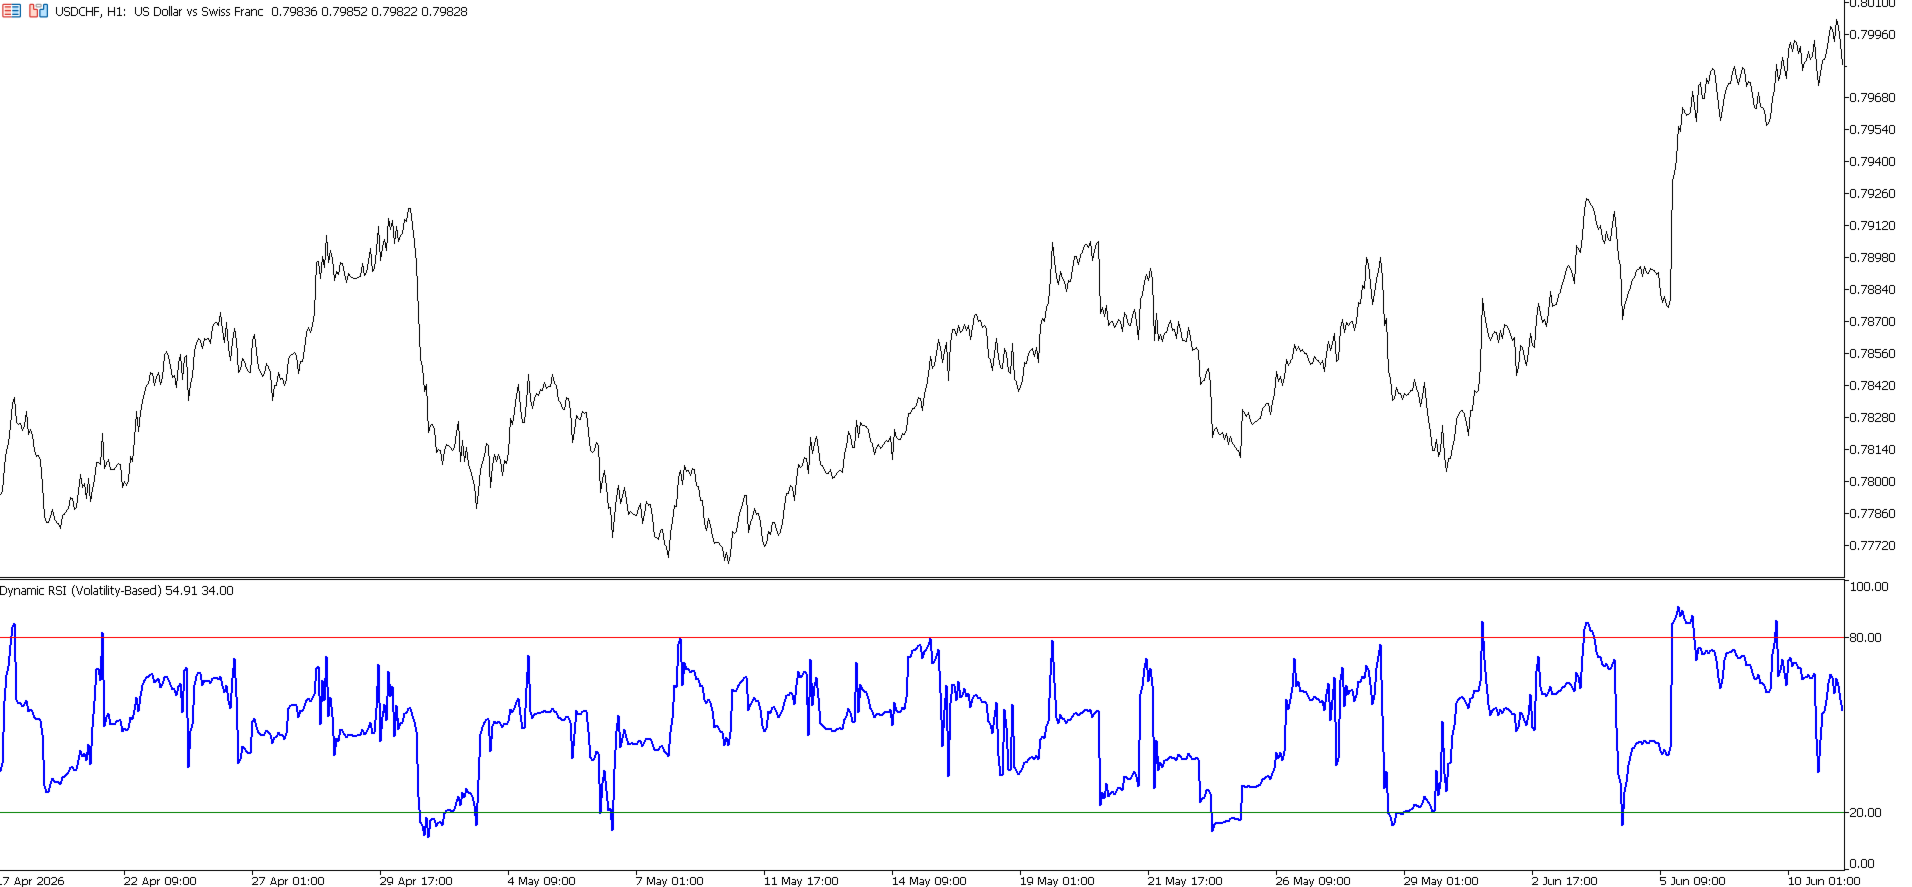
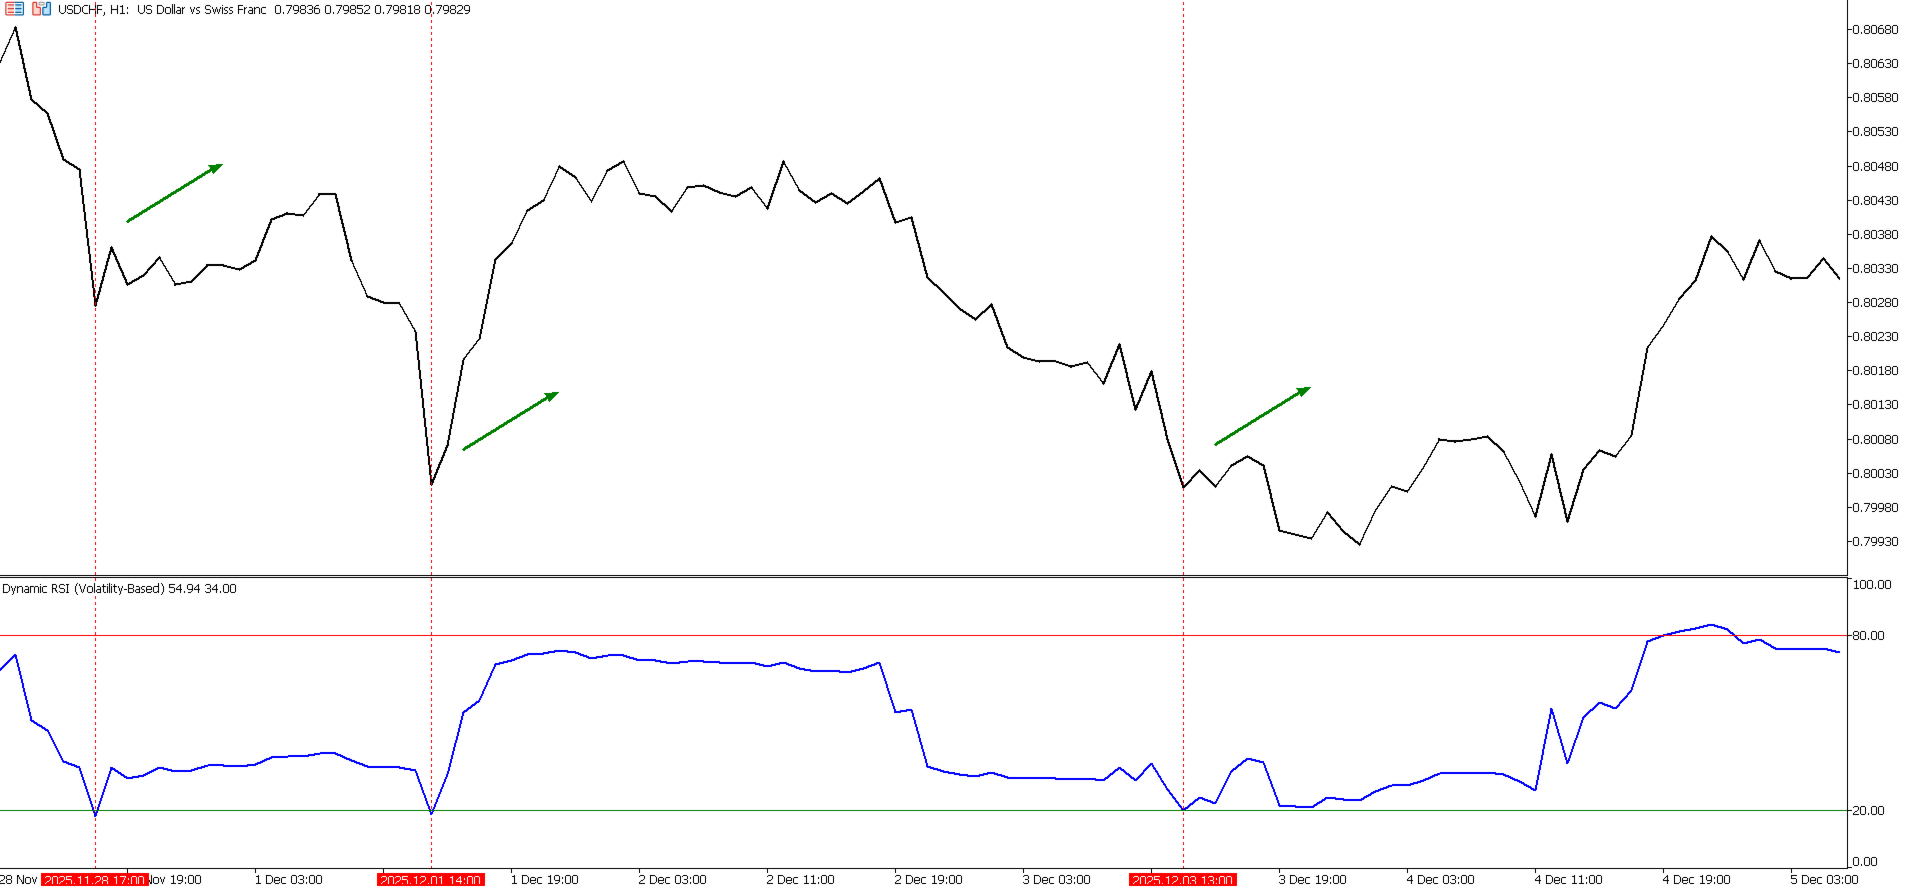
Dynamic RSI Volatility Based is an adaptive momentum indicator designed to adjust its RSI sensitivity according to changing market volatility.

Instead of relying on one fixed RSI period at all times, the indicator adapts its internal lookback based on recent volatility conditions. When volatility changes, the RSI calculation becomes more responsive or smoother depending on the current market environment.

This gives traders a more flexible view of momentum compared to a traditional static RSI.

Key Features

• Adaptive RSI calculation
• Volatility based period adjustment
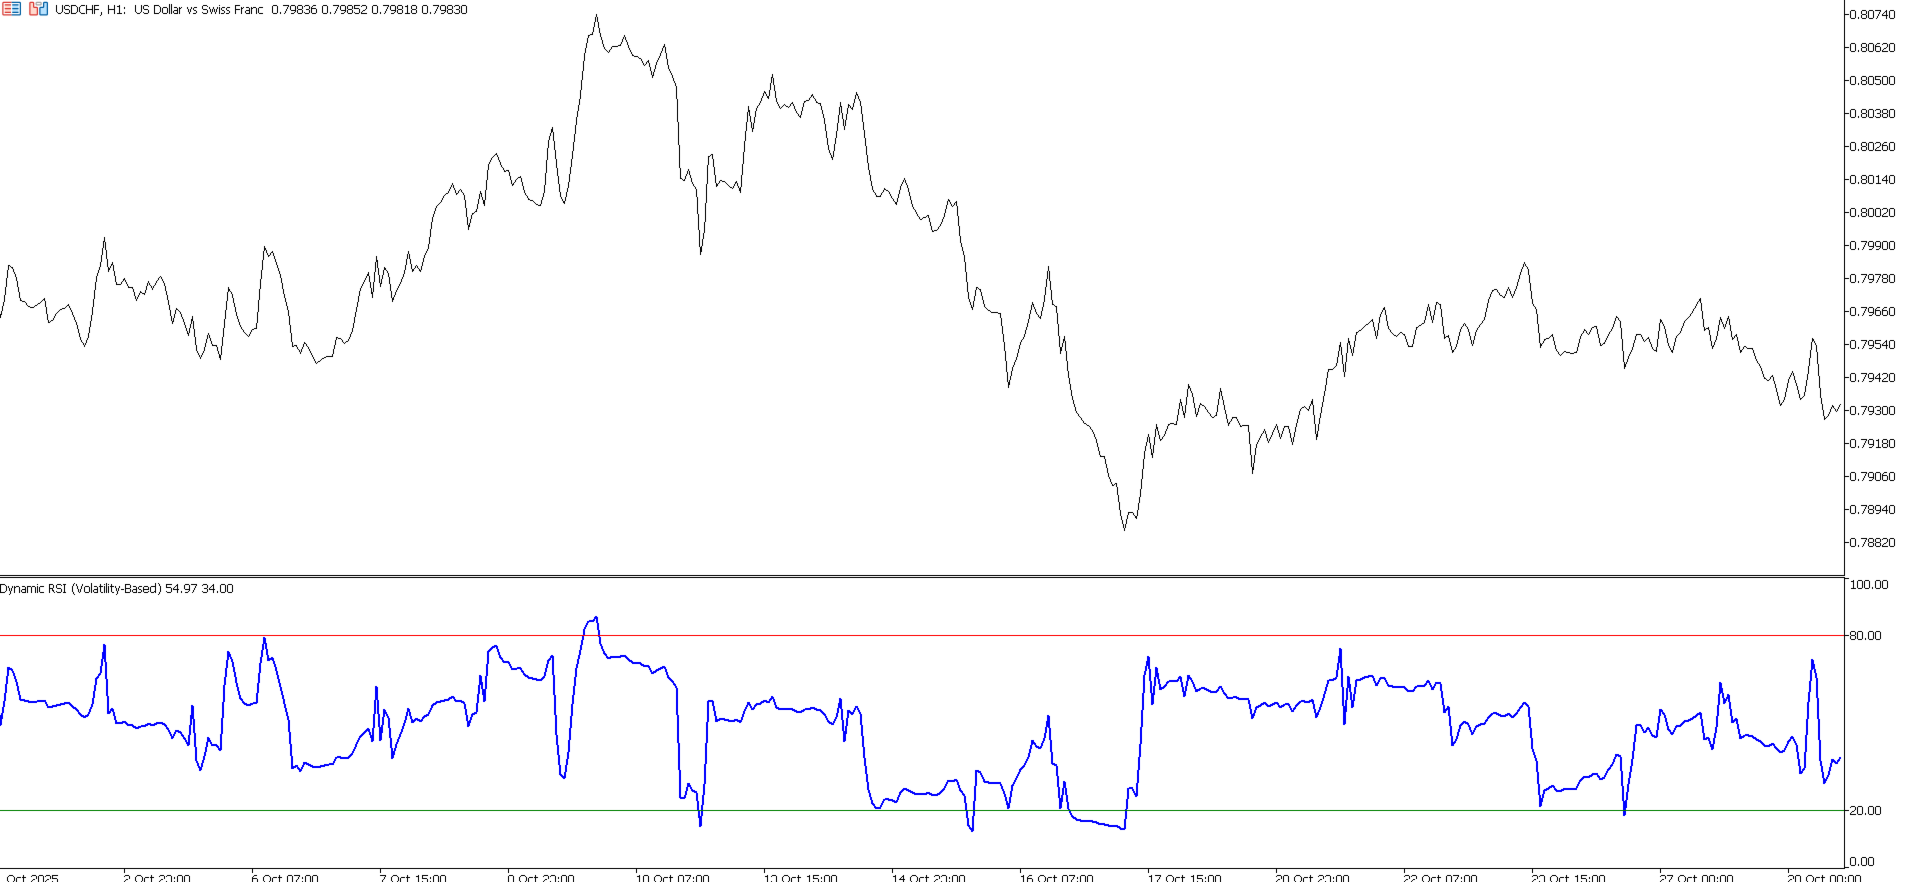
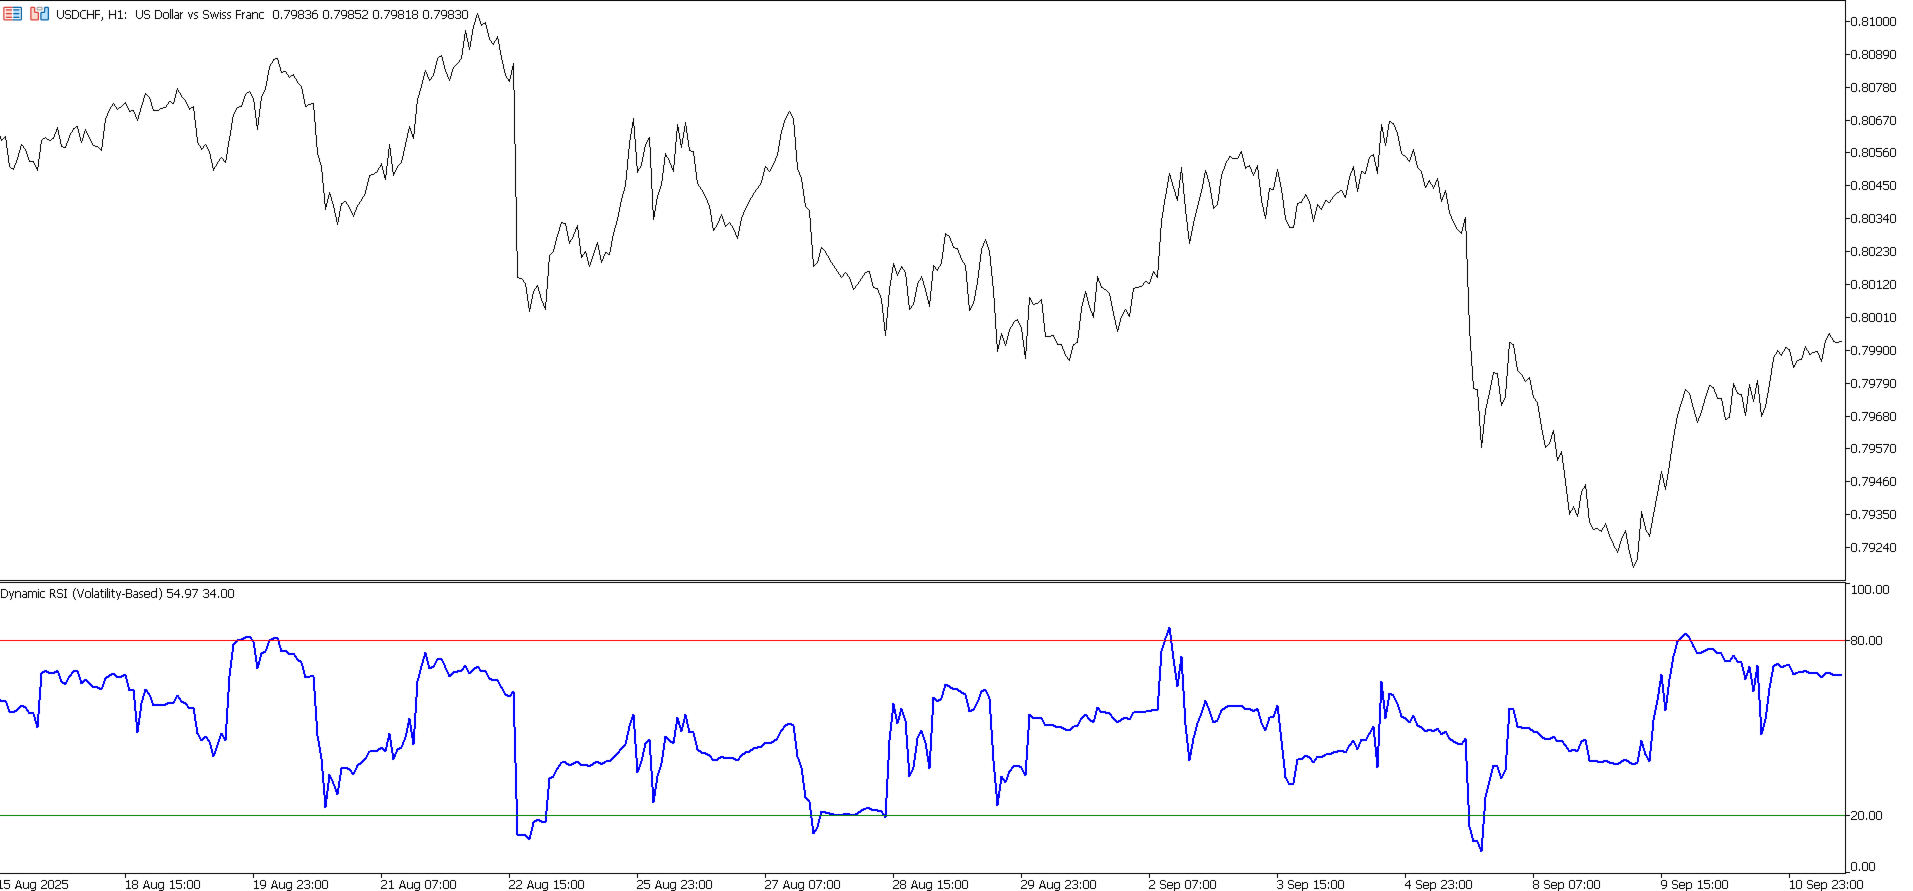
• Clean separate window display
• Blue dynamic RSI line
• Overbought level at 80
• Oversold level at 20
• Hidden dynamic period output for additional analysis
• Suitable for multiple markets and timeframes

How to Use

When the Dynamic RSI moves toward the upper zone, the market may be entering an overextended bullish condition.

When the Dynamic RSI moves toward the lower zone, the market may be entering an overextended bearish condition.

Because the lookback adapts to volatility, the indicator can help traders read momentum in both quiet and active market conditions.

Use Cases

• Momentum analysis
• Overbought and oversold monitoring
• Trend strength confirmation
• Pullback filtering
• Volatility aware market timing
• Additional confirmation within an existing strategy

Important

Dynamic RSI Volatility Based is a decision support tool. It does not guarantee future market direction and should not be used as a standalone trading system. It is best used together with price action, trend context, support and resistance, volatility analysis, and proper risk management.


Mais do autor
Yellow Indicator by Quant Atlas Creator:  https://www.quant-atlas.com/ Yellow Indicator is a clean reversal focused trading tool designed to highlight potential turning points using momentum behavior and RSI structure. The indicator looks for moments where momentum has moved through an important zone and begins to show signs of exhaustion. When conditions align, it plots dark yellow triangle signals directly on the chart. Both bullish and bearish signals use the same dark yellow visual identity,
FREE
Fibonacci Timing Indicator by Quant Atlas Creator:  https://www.quant-atlas.com/ Fibonacci Timing Indicator is a clean signal based trading tool designed to identify potential turning points through a timing sequence framework inspired by Fibonacci spacing. The indicator studies price behavior across selected historical reference points and looks for repeated directional pressure. When the sequence reaches completion, it plots a clear signal directly on the chart. Signal Display • Green upward t
FREE
Blue Indicator by Quant Atlas Creator:  https://www.quant-atlas.com/ Blue Indicator is a clean reversal focused trading tool designed to detect potential turning points through a slope based momentum framework. The indicator studies the momentum of price slope and highlights moments where that momentum begins to move away from an extreme zone. When conditions align, it plots blue triangle signals directly on the chart. Both bullish and bearish signals use the same blue visual identity, giving th
FREE
Creator:  https://www.quant-atlas.com/ Freyja is a visual pattern based indicator designed to highlight potential exhaustion and reversal areas using a structured time and price framework. The indicator studies how price behaves across repeated timing sequences and marks areas where the market may be approaching a potential turning point. It is built to give traders a clean visual layer that can be added to their existing analysis process. Signal Categories • Blue triangles Low conviction patte
FREE
Red Indicator  by Quant Atlas Creator:  https://www.quant-atlas.com/ Red Indicator is a clean reversal focused tool designed to highlight moments where price may be moving away from an extreme condition and entering a potential turning zone. The indicator uses a price derived volatility framework to detect areas where market pressure may have become stretched. When conditions align, it plots red triangle signals directly on the chart. Both bullish and bearish signals use the same red visual iden
FREE
Green Indicator by Quant Atlas Creator:  https://www.quant-atlas.com/ Green Indicator is a clean reversal focused trading tool designed to highlight potential turning points using momentum pressure and directional slope behavior. The indicator studies the relationship between momentum position and momentum direction. When market pressure reaches an extended condition and begins to shift, the indicator plots green triangle signals directly on the chart. Both bullish and bearish signals use the sa
FREE
Orange Indicator by Quant Atlas Creator:  https://www.quant-atlas.com/ Orange Indicator is a clean reversal focused indicator for MetaTrader 5, designed to highlight potential turning points directly on the chart using simple orange buy and sell markers. The indicator focuses on moments where price may be transitioning out of short term exhaustion and into a possible reaction phase. When a bullish setup appears, an orange upward triangle is displayed below the candle. When a bearish setup appear
FREE
Indigo Indicator by Quant Atlas Creator:  https://www.quant-atlas.com/ Indigo Indicator is a clean reversal focused trading tool designed to identify potential turning points through a price sequence framework. The indicator studies how price has behaved across multiple prior reference points and highlights moments where that sequence may be shifting. When conditions align, it plots indigo triangle signals directly on the chart. Both bullish and bearish signals use the same indigo visual identit
FREE
Violet Indicator  by Quant Atlas Creator:  https://www.quant-atlas.com/ Violet Indicator is a clean reversal focused trading tool designed to identify moments where price may be shifting away from an extended directional condition. The indicator uses a price derived trend framework to detect moments where market structure may be changing. When conditions align, it plots violet triangle signals directly on the chart. Both bullish and bearish signals use the same violet visual identity, giving the
FREE
Trader’s Cockpit is a simple non directional dashboard for MetaTrader 5 designed to give traders a quick, clear view of their trading environment directly on the chart. Creator:  https://www.quant-atlas.com/ The indicator does not generate buy or sell signals, does not predict market direction, and does not perform any trading action. Its purpose is to make the trader’s daily workflow easier by centralizing useful account, symbol, spread, session, and broker condition information in one compact
FREE
Vision  by Quant Atlas Creator:  https://www.quant-atlas.com/ Vision by Quant Atlas  is a multi component reversal signal indicator designed to identify short term bullish and bearish exhaustion points across liquid markets. The model aggregates several independent technical evidence layers, including momentum behavior, mean reversion pressure, volatility based conditions, trend interaction, timing structure, and moving average related confirmation. The final output is converted into visual conv
Reversal Indicator I   by Quant Atlas Creator:  https://www.quant-atlas.com/ Reversal Indicator I is a clean reversal focused indicator designed to help traders identify potential bullish and bearish turning points directly on the chart. The indicator highlights moments where the market may be approaching exhaustion and where a tactical reversal setup may be forming. Signals are displayed with simple visual triangles, making the tool easy to read without cluttering the chart. Key idea Markets of
Three Dimensional Reversal Indicator  by Quant Atlas Creator:  https://www.quant-atlas.com/ Three Dimensional Reversal Indicator is a clean and focused reversal tool designed to identify potential market turning points through a three dimensional view of price behavior. The model combines three key dimensions: • Time How long market pressure has remained one sided. • Price Where price is currently positioned relative to its recent behavior. • Price Derived Structure A transformed view of pric
Fibonacci Moving Average by Quant Atlas Fibonacci Moving Average is a visual trend structure indicator built around a layered Fibonacci based moving average framework. The indicator plots two dynamic average lines directly on the price chart, creating a clean view of how price behaves relative to broader trend structure. The lines automatically change color depending on the position of price, making market direction easier to read at a glance. Visual Logic • Blue line state: price is trading abo
The Rainbow Dragon Indicator by Quant Atlas Creator:  https://www.quant-atlas.com/ The Rainbow Dragon is a composite signal engine that aggregates the seven Rainbow indicators — Blue, Green, Indigo, Red, Violet, Yellow, and Orange — into a single confluence-based reading. Rather than relying on any one model, it treats each Rainbow component as an independent voter and fires only when enough of them agree, giving you a diversified, multi-method read on the market instead of a single point of vie
HorizonsFX Stability is a multi currency Expert Advisor for MetaTrader 5 designed to trade major FX pairs using a structured daily signal model. The system scans several major currency pairs, evaluates directional pressure, volatility behavior, and market structure conditions, then opens trades when the internal score reaches a valid setup. The product is designed for traders who want a systematic FX robot with clear risk controls, multi pair diversification, and simple fixed lot execution. Hori
Yubel Divergence Detection is a momentum exhaustion indicator for MetaTrader 5 designed to help traders identify potential directional turning points when price movement begins to lose internal strength. Creator:  https://www.quant-atlas.com/ The indicator focuses on divergence style behavior and momentum fatigue, highlighting moments where the market may be preparing for a reversal, continuation failure, or short term directional shift. It is built as a visual signal tool, giving traders a fast
Filtro:
Sem comentários
Responder ao comentário