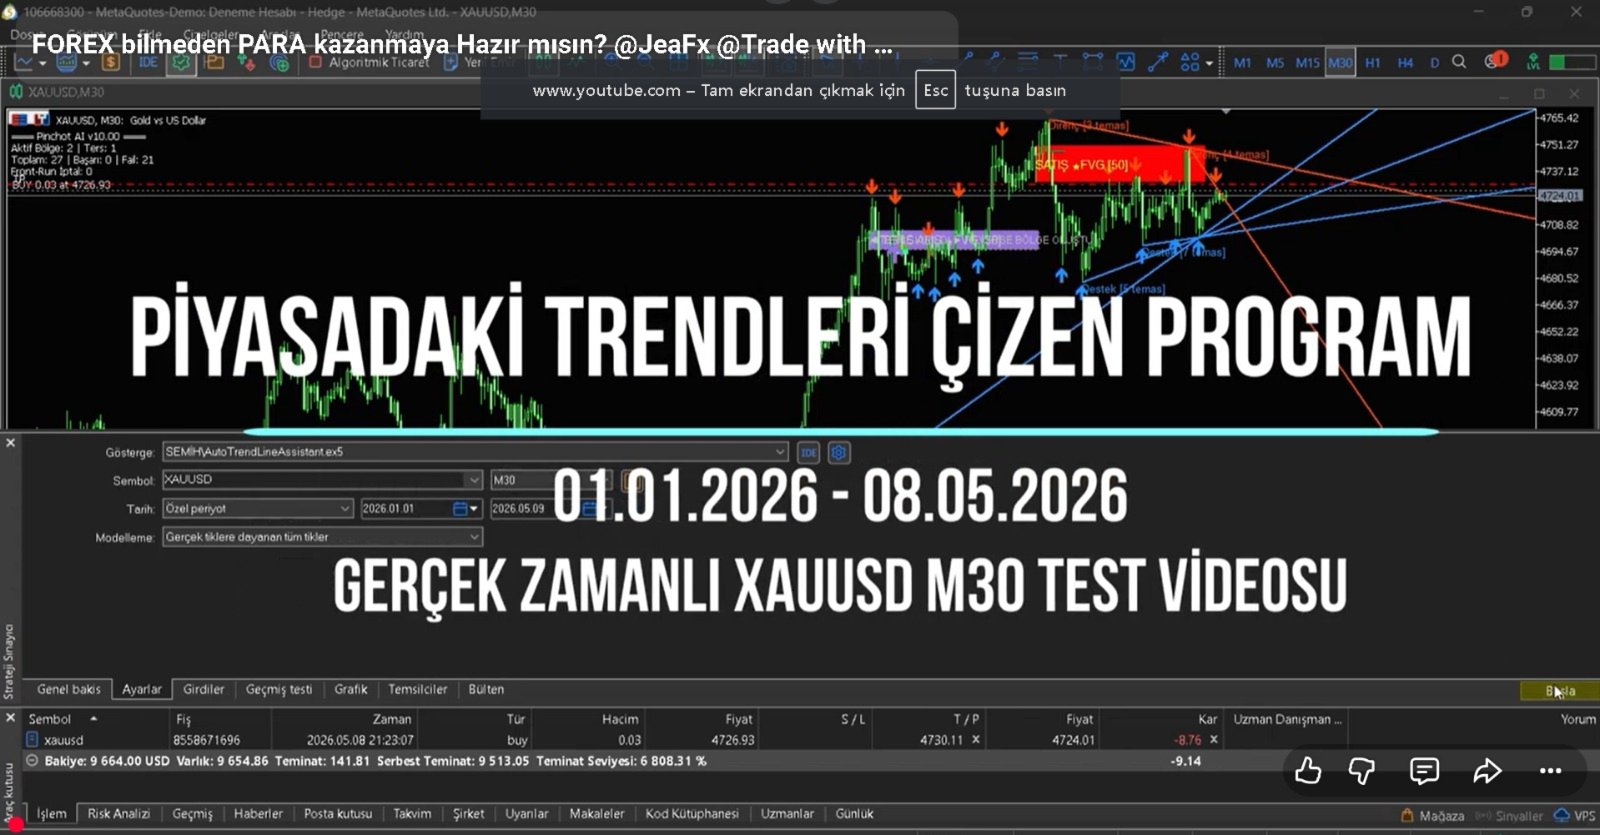
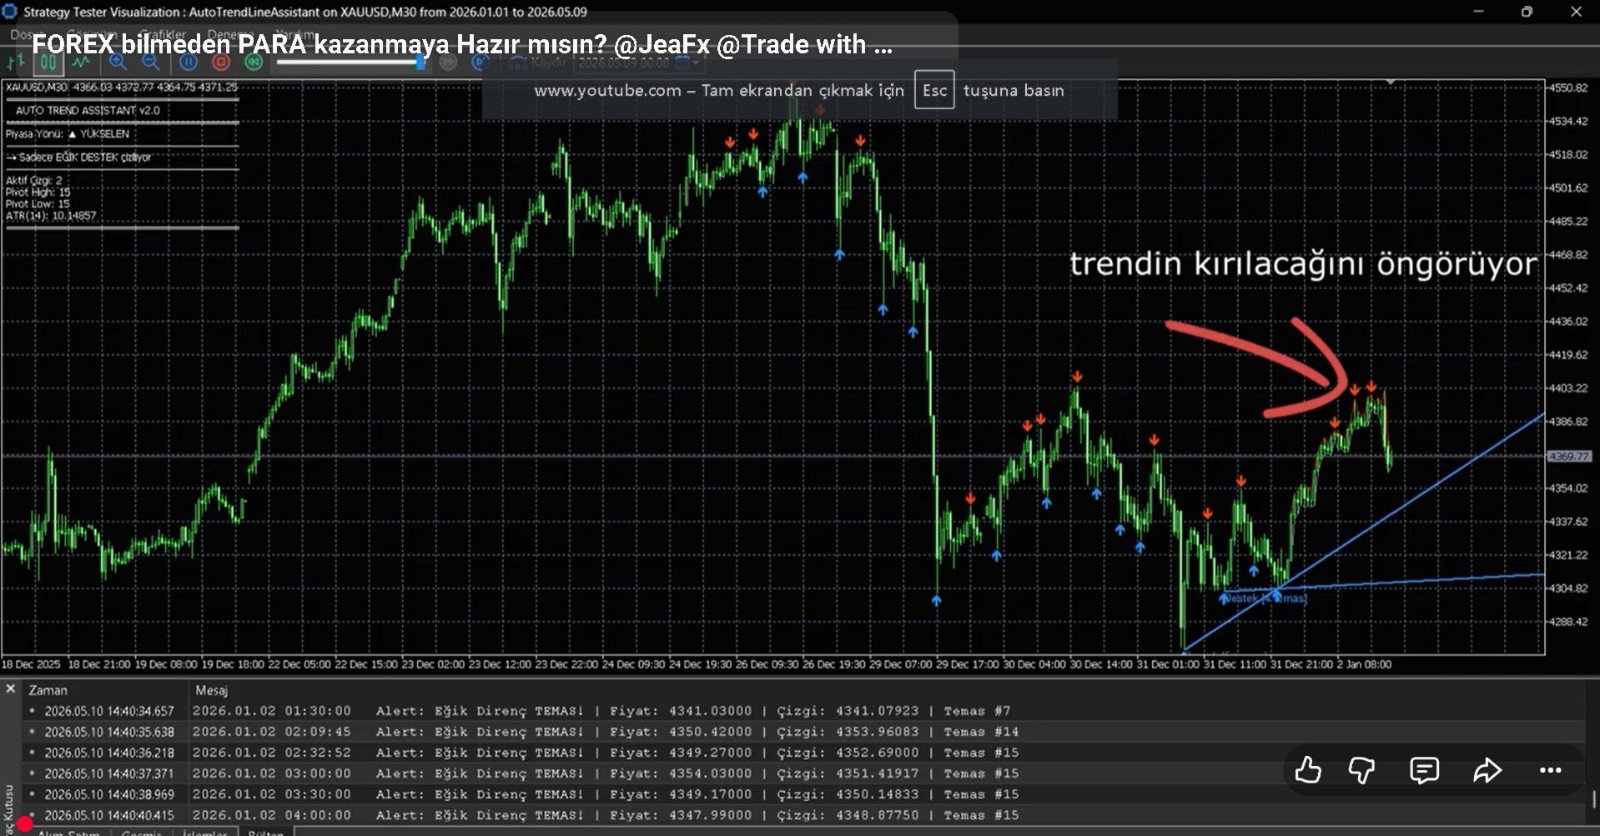
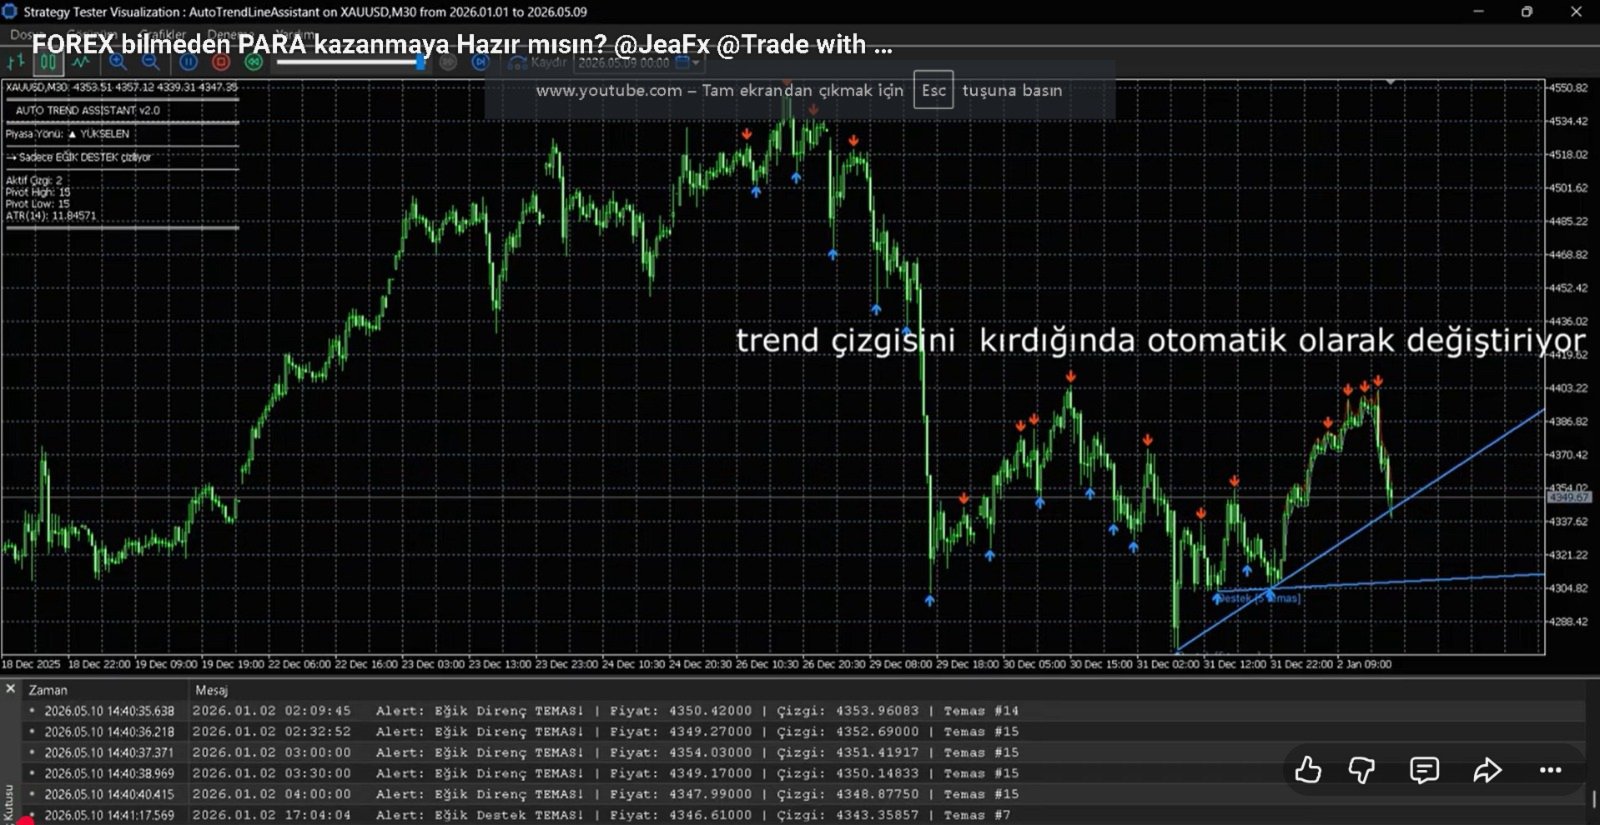
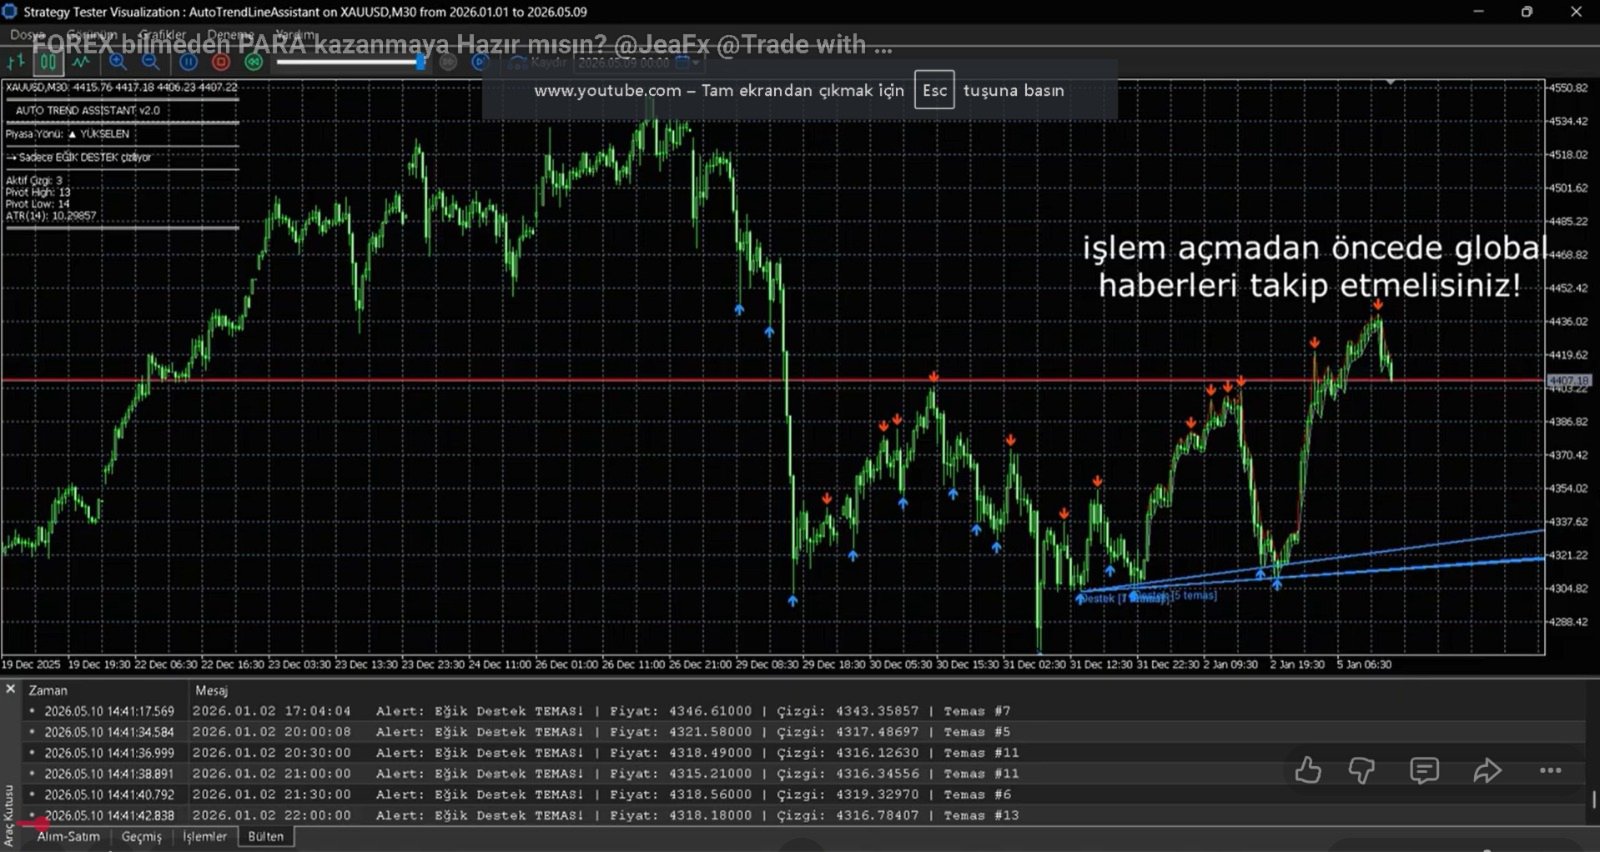
AutoTrendLineAssistant

  • Indicadores
  • Semih Erten
    Semih Erten
    TRMentorFx — Otomatikleştirilmiş Forex Çözümleri
    2021 yılından bu yana forex piyasalarında aktif olarak çalışmaktayım. Bu süreçte edindiğim bilgi ve deneyimi, tamamen kendi geliştirdiğim strateji modellerine dönüştürdüm.
  • Versão: 2.0
  • Ativações: 5
# AUTO TREND LINE ASSISTANT v2.0
### MQL5 Market — Ürün Açıklaması / Çalışma Mantığı / Kullanım Talimatları

---

## 🔷 ÜRÜN AÇIKLAMASI (MQL5 Market Listing)

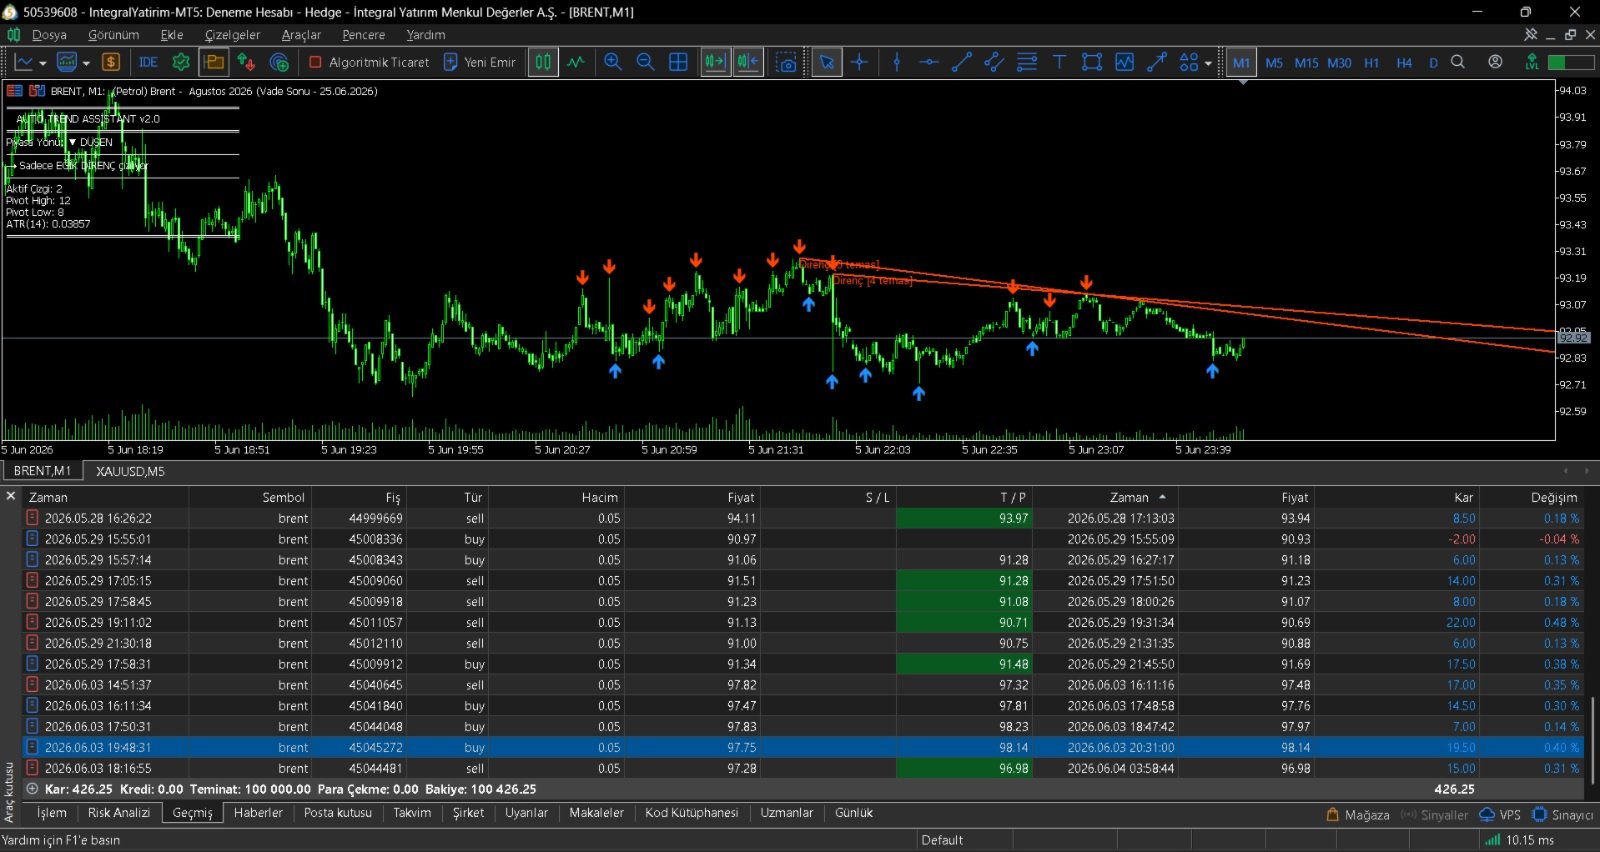
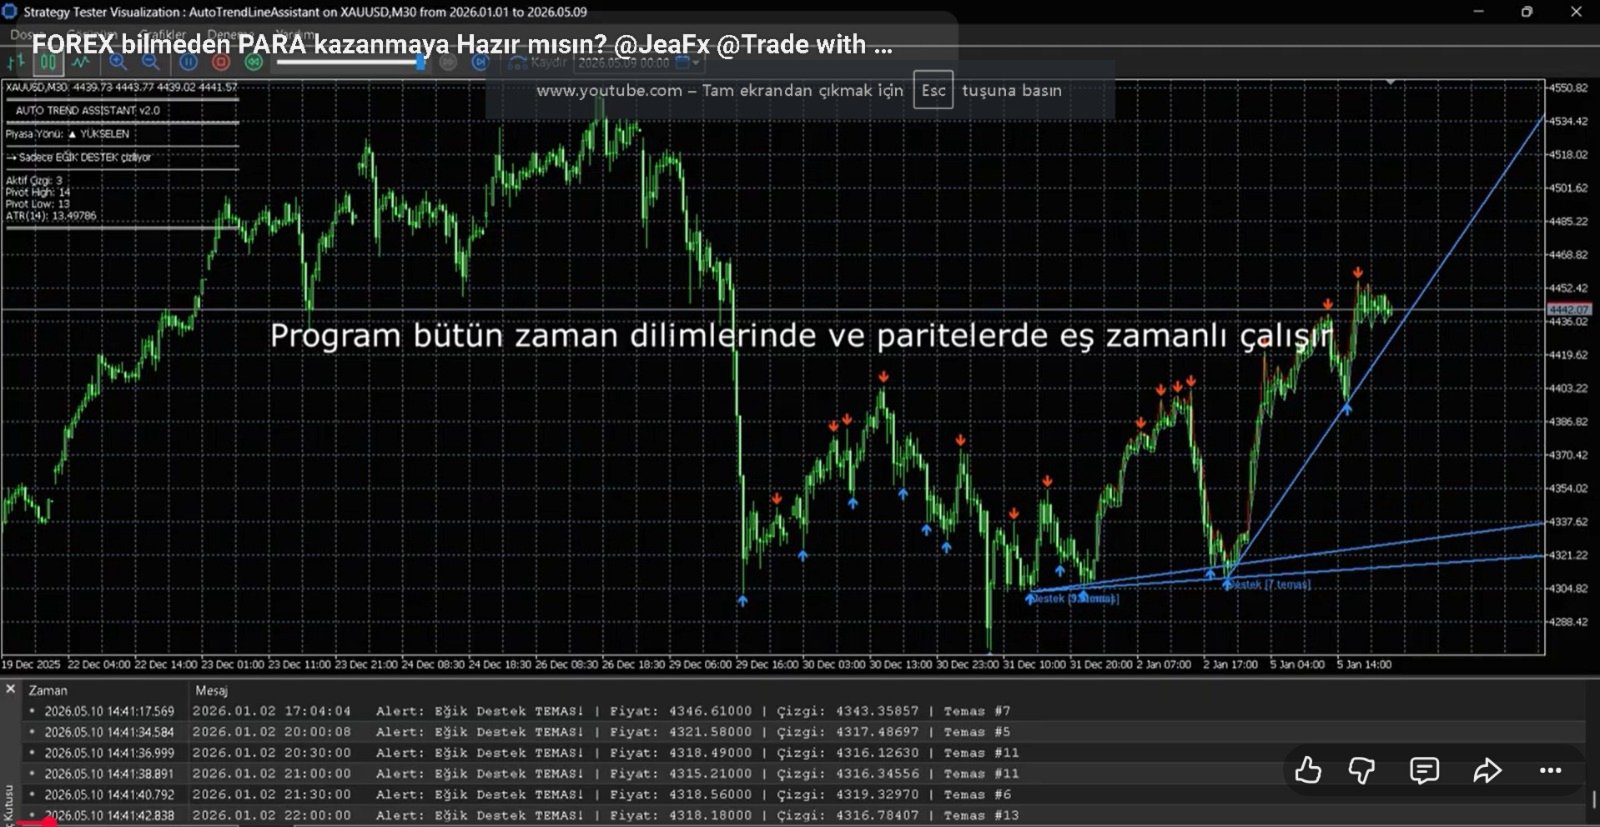
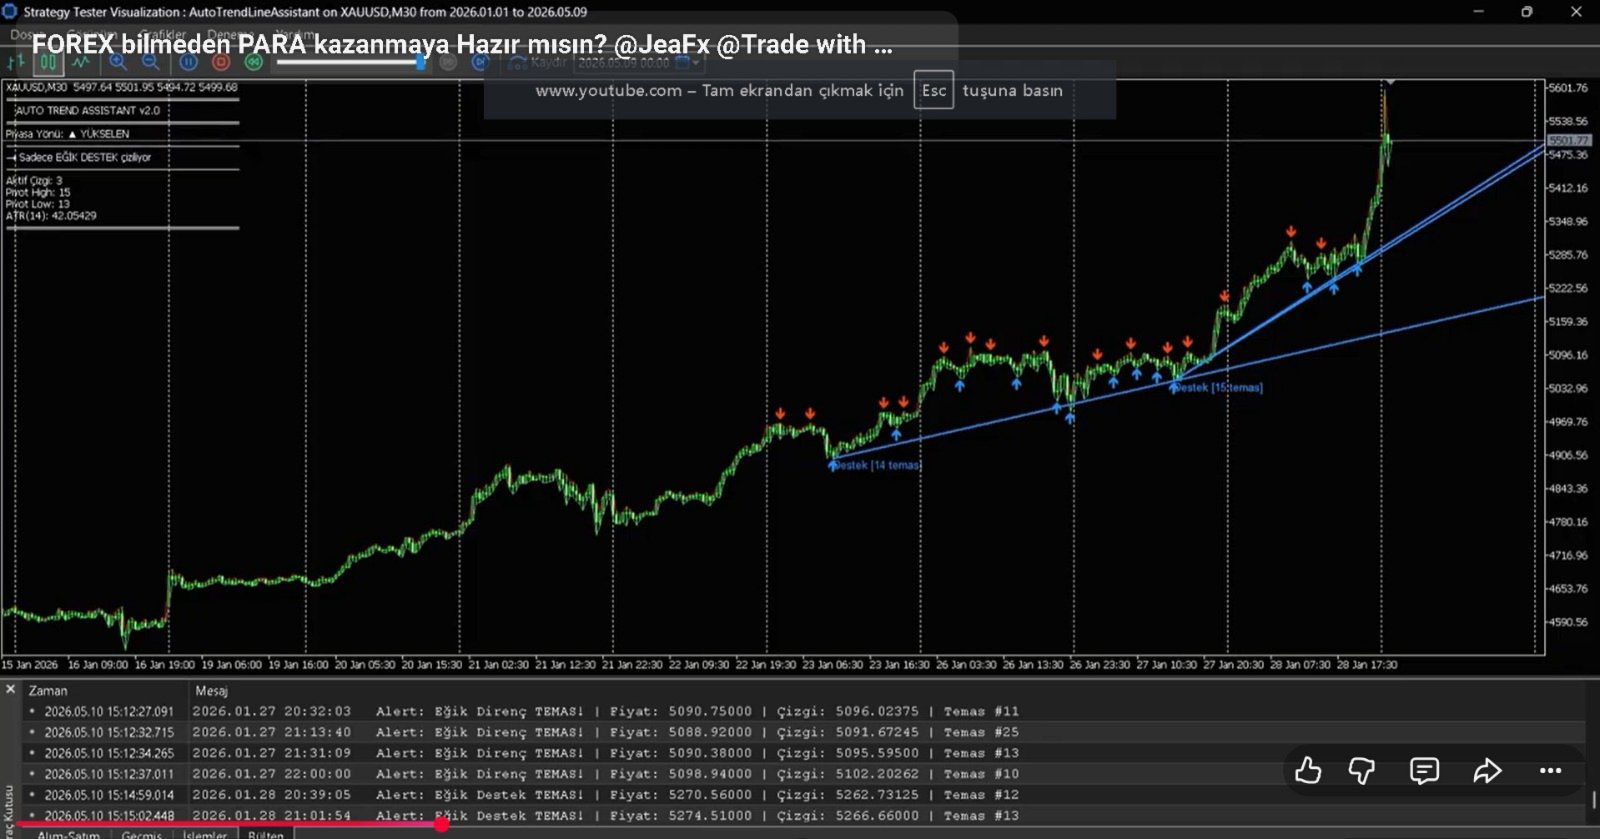
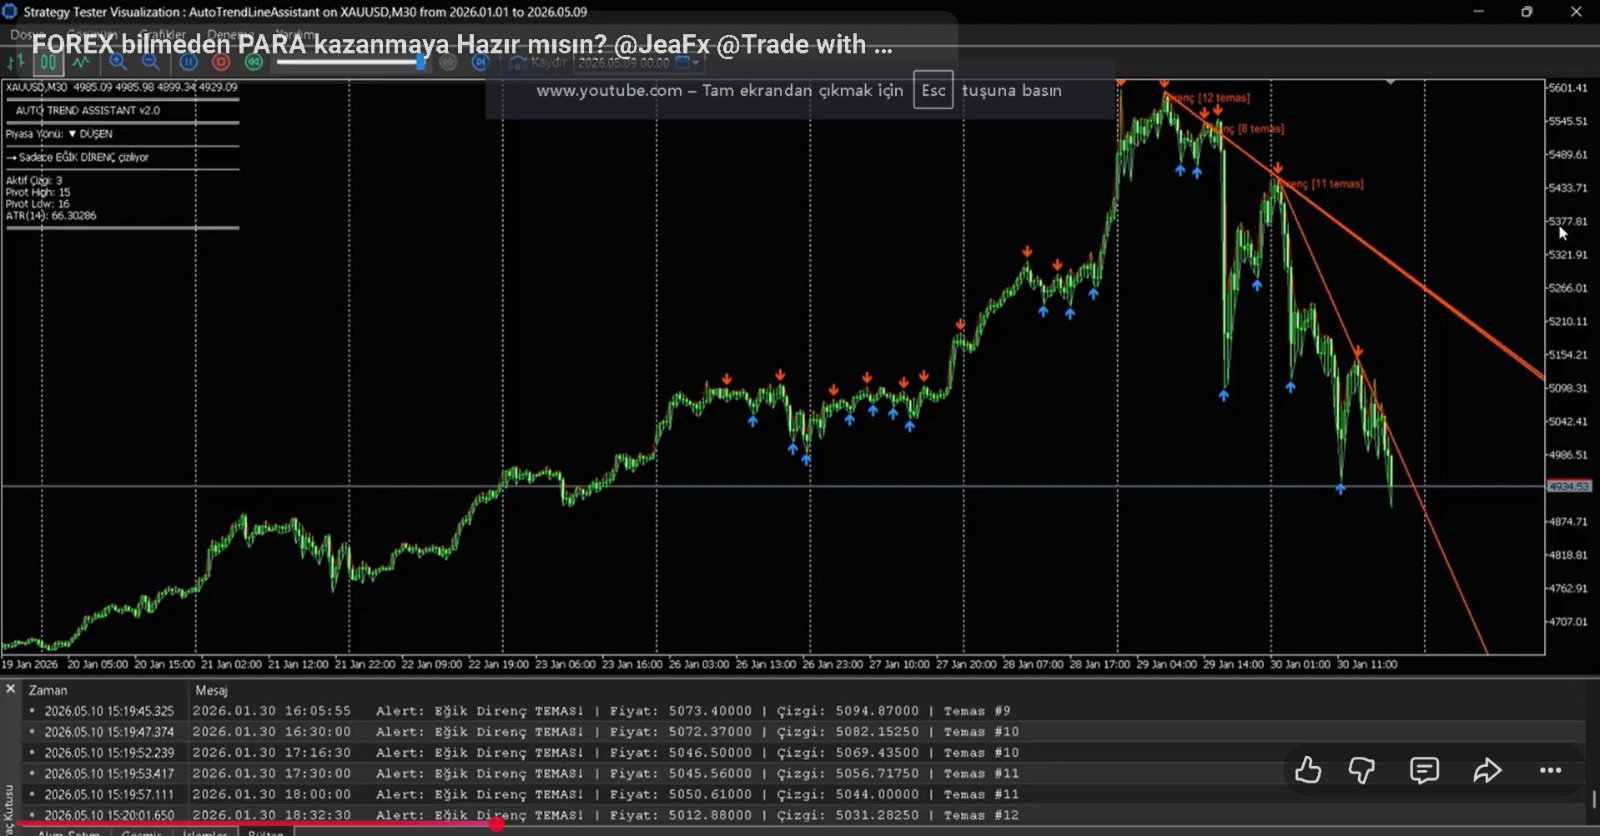
**Auto Trend Line Assistant v2.0**, piyasanın anlık yönünü otomatik olarak analiz eden ve kurallara dayalı şekilde yalnızca doğru trend çizgisini çizen akıllı bir MetaTrader 5 göstergesidir.

> **Tek cümleyle:** Yükselen piyasada sadece eğik destek, düşen piyasada sadece eğik direnç — fazlası yok, eksiği yok.

Klasik trend çizgisi araçlarının aksine bu gösterge, **gereksiz çizgilerle ekranı doldurmaz**. Piyasanın yapısını okur, yönüne karar verir ve o yöne uygun tek tip çizgiyi algoritmik doğrulukla yerleştirir.

---

### ✅ NE İŞE YARAR?

| Sorun | Çözüm |
|---|---|
| Manuel trend çizgisi çizmek zaman alır | Tamamen otomatik, her bar güncellemesinde yeniden hesaplar |
| Yanlış tip çizgi çizilir (düşen trendde destek aramak gibi) | Piyasa yönünü tespit edip sadece kurala uygun çizgi çizer |
| Pivot noktalarını gözle bulmak hatalı olur | Matematiksel pivot algoritması, sol/sağ bar karşılaştırmasıyla doğrular |
| Zayıf trend çizgileri güçlülerle karışır | Güç skoru (temas sayısı + uzunluk + güncellik) ile sıralama yapar |
| Temas ve kırılımları takip etmek zordur | Anlık Alert, Push Bildirim ve E-posta uyarısı sistemi |

---

### 🎯 TEMEL ÖZELLİKLER

- **Akıllı Piyasa Yönü Tespiti** — Higher High/Higher Low ve Lower High/Lower Low yapısıyla trend yönü belirlenir
- **Kural Bazlı Çizgi Seçimi** — Yükselen trendde SADECE eğik destek, düşen trendde SADECE eğik direnç
- **ATR Tabanlı Tolerans** — Temas ve kırılım eşikleri piyasanın volatilitesine göre otomatik ayarlanır
- **Güç Skoru Algoritması** — Her çizgiye temas sayısı, uzunluk ve güncellik skoruna göre puan verilir, en güçlüler öne çıkar
- **Çoklu Çizgi Desteği** — Aynı anda en fazla N adet trend çizgisi gösterilir (parametreyle ayarlanır)
- **Gerçek Zamanlı Uyarılar** — Fiyat çizgiye temas ettiğinde ve çizgiyi kırdığında anında bildirim
- **Görsel Pivot İşaretleri** — Tepe ve dip pivotları grafik üzerinde işaretlenir
- **Bilgi Paneli** — Piyasa yönü, aktif çizgi sayısı, pivot sayısı ve ATR değeri canlı gösterilir
- **Tüm Sembol ve Zaman Dilimlerine Uyumlu** — Forex, Kripto, Hisse, Emtia, Endeks

---

### 📊 UYUMLU PLATFORMLAR

- MetaTrader 5 (Build 2000+)
- Tüm broker ve semboller
- Tüm zaman dilimleri (M1'den MN'e kadar)

---

---

## ⚙️ ÇALIŞMA MANTIĞI

### ADIM 1 — Pivot Noktalarının Tespiti

Gösterge, her hesaplama döngüsünde klasik **Williams Fractal** mantığına benzer bir pivot algoritması çalıştırır.

**Tepe Pivot (Pivot High):**
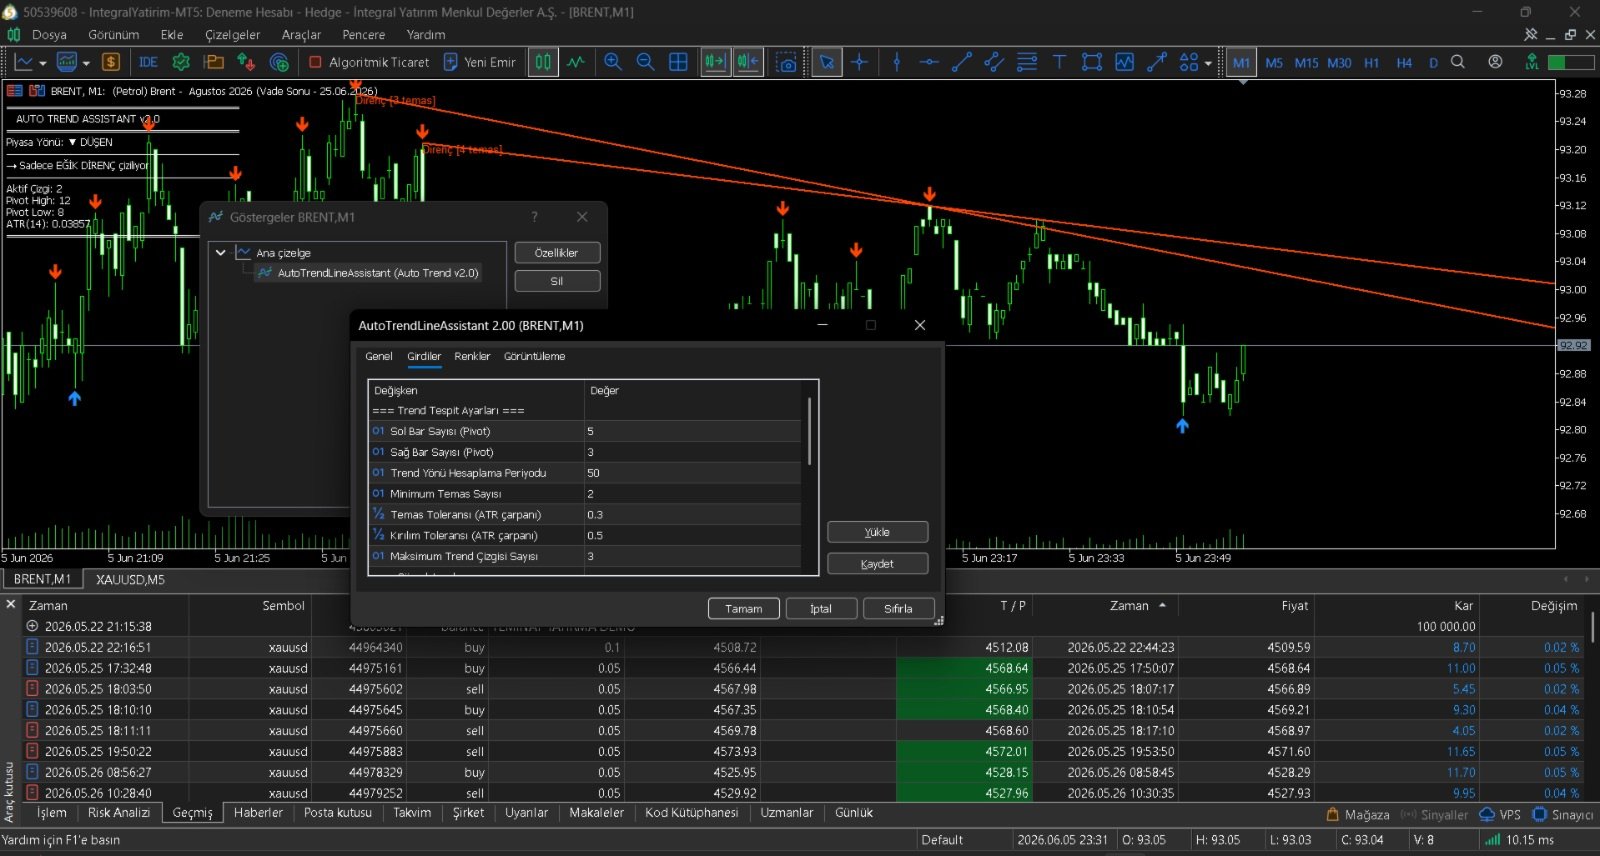
Bir bar, solundaki `InpLeftBars` kadar barın en yüksek değerinden ve sağındaki `InpRightBars` kadar barın en yüksek değerinden büyükse bu bar bir **pivot tepe** olarak işaretlenir.

**Dip Pivot (Pivot Low):**
Aynı mantıkla, bir bar solundaki ve sağındaki tüm barların en düşük değerinden küçükse bu bar bir **pivot dip** olarak işaretlenir.

> Örnek: `InpLeftBars = 5`, `InpRightBars = 3` → Bir tepe pivotu oluşabilmesi için o barın solundaki 5 bar ve sağındaki 3 barın hepsinden yüksek olması gerekir.

---

### ADIM 2 — Piyasa Yönünün Belirlenmesi

Son bulunan pivot noktaları karşılaştırılarak piyasa yapısı okunur:

```
Higher High + Higher Low → YÜKSELEN TREND (TREND_UP)
Lower High  + Lower Low  → DÜŞEN TREND   (TREND_DOWN)
Karışık yapı             → YATAY         (TREND_SIDEWAYS)
```

Pivot bazlı analizin yanı sıra, `InpTrendLookback` periyodundaki kapanış fiyatı değişimi ve ortalama bar aralığı da yardımcı kriter olarak kullanılır.

---

### ADIM 3 — Kurala Göre Trend Çizgilerinin Seçimi

Bu, göstergenin kalbidir. Şu kural **asla değişmez:**

| Piyasa Yönü | Çizilen Çizgi Tipi | Kullanılan Pivotlar |
|---|---|---|
| YÜKSELEN | Sadece Eğik Destek | Dip Pivotları (Low) |
| DÜŞEN | Sadece Eğik Direnç | Tepe Pivotları (High) |
| YATAY | Her iki tip | Her iki pivot grubu |

**Yükselen Piyasada Eğik Destek Algoritması:**
1. Tüm dip pivot çiftleri kombinasyonları incelenir
2. Eğim pozitif olmak zorundadır (Higher Lows yapısı)
3. İki pivot arasında minimum bar mesafesi kontrolü yapılır
4. Çizgi boyunca tüm barlar taranır — fiyat çizginin tolerans dışı altına inmemeli
5. Minimum temas sayısı (`InpMinTouches`) sağlanmalı
6. Güç skoru hesaplanır ve sıralanır

**Düşen Piyasada Eğik Direnç Algoritması:**
1. Tüm tepe pivot çiftleri kombinasyonları incelenir
2. Eğim negatif olmak zorundadır (Lower Highs yapısı)
3. Çizgi boyunca fiyat tolerans dışı üstüne çıkmamalı
4. Minimum temas ve güç skoru kriterleri uygulanır

---

### ADIM 4 — Güç Skoru Hesaplama

Her aday trend çizgisine 0–100 arasında bir **güç puanı** verilir:

```
Güç = Temas Skoru (40%) + Uzunluk Skoru (30%) + Güncellik Skoru (30%)

Temas Skoru   = min(temas_sayısı / 5, 1.0) × 40
Uzunluk Skoru = min(çizgi_uzunluğu / 100 bar, 1.0) × 30
Güncellik     = max(0, (50 - son_pivottan_uzaklık) / 50) × 30
```

En yüksek puanlı çizgiler grafiğe çizilir. `InpMaxTrendLines` parametresiyle kaç çizgi gösterileceği belirlenir.

---

### ADIM 5 — ATR Tabanlı Tolerans Sistemi

Sabit pip değeri yerine **ATR (Average True Range)** kullanılması, göstergenin farklı enstrümanlarda ve farklı volatilite ortamlarında tutarlı çalışmasını sağlar.

```
Temas Toleransı = ATR(14) × InpTouchTolerance
Kırılım Toleransı = ATR(14) × InpBreakTolerance
```

- Düşük volatilite dönemlerinde tolerans daralır → daha hassas
- Yüksek volatilite dönemlerinde tolerans genişler → sahte kırılımları filtreler

---

### ADIM 6 — Uyarı Sistemi

**Temas Uyarısı:**
Mevcut barda fiyat (High veya Low), trend çizgisine temas toleransı içine girdiğinde tetiklenir.

**Kırılım Uyarısı:**
Önceki bar çizginin doğru tarafında kapanırken mevcut bar çizginin yanlış tarafında kırılım toleransını aşarak kapanırsa tetiklenir. Kırılan çizgi otomatik olarak deaktive edilir.

Uyarı kanalları: `Alert()` penceresi · Push Bildirim · E-posta

---

---

## 📋 KULLANIM TALİMATLARI

### Kurulum

1. `.ex5` dosyasını indirin
2. MetaTrader 5'i açın
3. **Dosya → Veri Klasörü Aç** → `MQL5/Indicators/` klasörüne dosyayı kopyalayın
4. MetaTrader 5'i yeniden başlatın veya **Navigator** panelinde sağ tık → **Yenile** yapın
5. İstediğiniz grafik üzerine sürükleyip bırakın

---

### Parametre Ayarları

#### 🔧 Trend Tespit Ayarları

| Parametre | Varsayılan | Açıklama |
|---|---|---|
| `InpLeftBars` | 5 | Pivot tespiti için solda kaç bar bakılacak. Düşürürseniz daha fazla pivot bulur, artırırsanız daha az ama daha güçlü pivotlar |
| `InpRightBars` | 3 | Pivot tespiti için sağda kaç bar bakılacak. Düşük değer daha hızlı sinyal verir |
| `InpTrendLookback` | 50 | Piyasa yönü hesabında kullanılan bar sayısı |
| `InpMinTouches` | 2 | Bir trend çizgisinin geçerli sayılması için minimum temas sayısı. 3'e yükseltirseniz sadece çok güçlü çizgiler gösterilir |
| `InpTouchTolerance` | 0.3 | Temas için kabul edilen mesafe (ATR çarpanı). Büyütürseniz daha "geniş" temaslar kabul edilir |
| `InpBreakTolerance` | 0.5 | Kırılım için gereken mesafe (ATR çarpanı). Büyütürseniz daha az kırılım uyarısı alırsınız |
| `InpMaxTrendLines` | 3 | Aynı anda gösterilecek maksimum trend çizgisi sayısı |

#### 🎨 Görsel Ayarlar

| Parametre | Varsayılan | Açıklama |
|---|---|---|
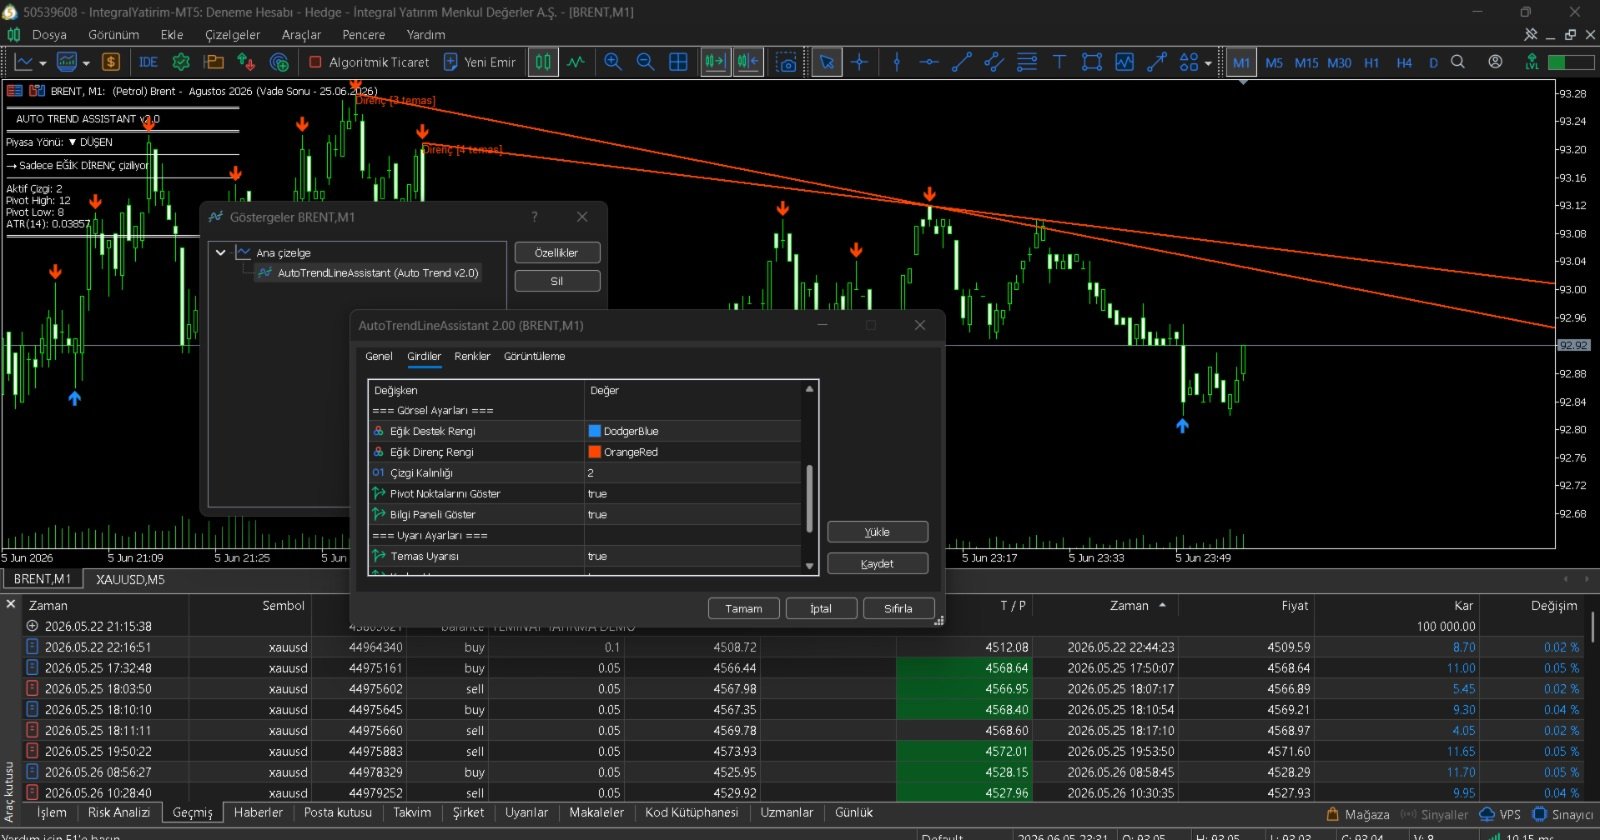
| `InpSupportColor` | DodgerBlue | Eğik destek çizgisi rengi |
| `InpResistanceColor` | OrangeRed | Eğik direnç çizgisi rengi |
| `InpLineWidth` | 2 | Çizgi kalınlığı (1–5) |
| `InpShowPivots` | true | Pivot noktalarını grafik üzerinde göster/gizle |
| `InpShowInfo` | true | Sol üst köşedeki bilgi panelini göster/gizle |

#### 🔔 Uyarı Ayarları

| Parametre | Varsayılan | Açıklama |
|---|---|---|
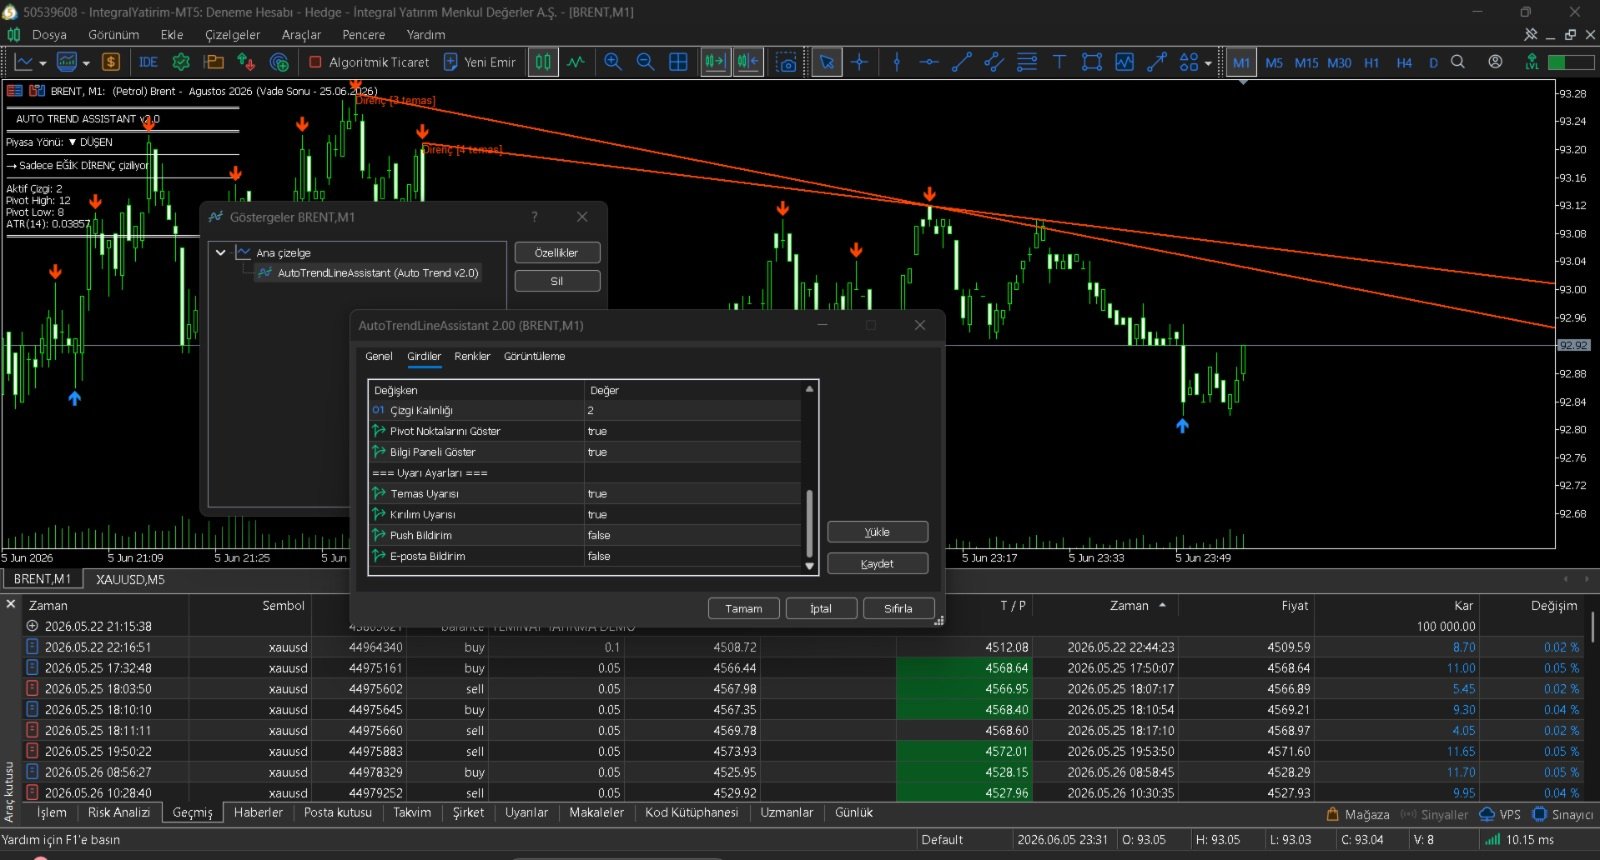
| `InpAlertTouch` | true | Fiyat trend çizgisine temas ettiğinde uyarı |
| `InpAlertBreak` | true | Trend çizgisi kırıldığında uyarı |
| `InpPushNotify` | false | MetaTrader mobil uygulamasına push bildirim gönder |
| `InpEmailNotify` | false | MT5 ayarlarındaki e-posta adresine bildirim gönder |

---

### Önerilen Ayarlar (Kullanım Senaryosuna Göre)

#### 📈 Scalping (M1–M5)
```
InpLeftBars     = 3
InpRightBars    = 2
InpTrendLookback = 30
InpMinTouches   = 2
InpTouchTolerance = 0.4
InpMaxTrendLines  = 2
```

#### 📊 Swing Trading (H1–H4)
```
InpLeftBars     = 5
InpRightBars    = 3
InpTrendLookback = 50
InpMinTouches   = 2
InpTouchTolerance = 0.3
InpMaxTrendLines  = 3
```

#### 📉 Pozisyon Trading (D1–W1)
```
InpLeftBars     = 8
InpRightBars    = 5
InpTrendLookback = 100
InpMinTouches   = 3
InpTouchTolerance = 0.25
InpMaxTrendLines  = 2
```

---

### Grafik Üzerinde Göstergeler

| Görsel Öğe | Anlamı |
|---|---|
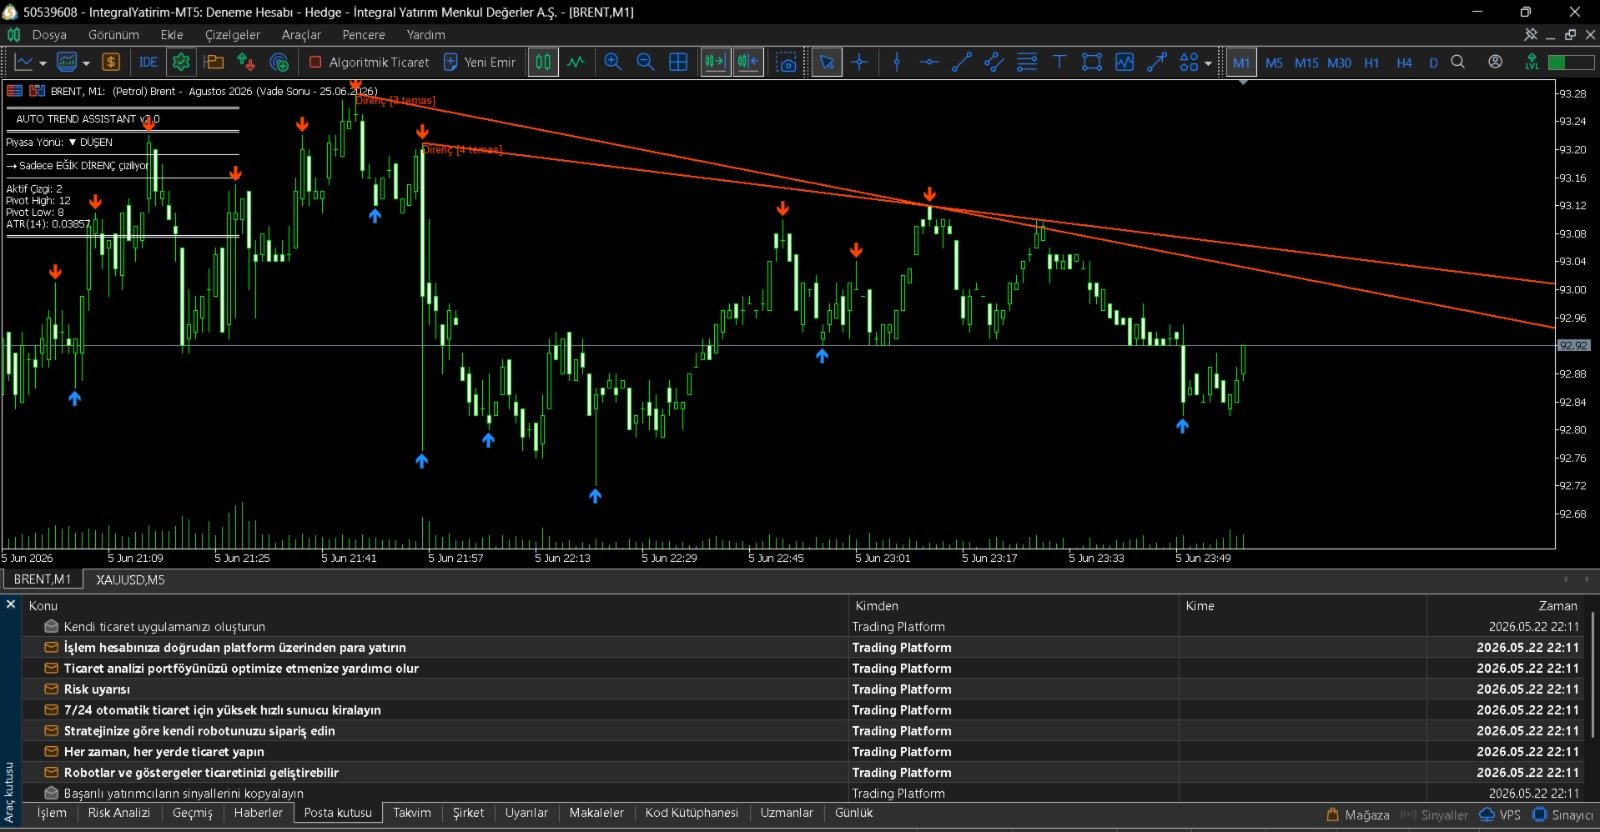
| 🔵 Mavi yukarı ok | Dip pivot noktası tespit edildi |
| 🔴 Kırmızı aşağı ok | Tepe pivot noktası tespit edildi |
| Mavi eğik çizgi | Aktif eğik destek (yükselen trendde) |
| Kırmızı eğik çizgi | Aktif eğik direnç (düşen trendde) |
| Çizgi etiketi | Çizgi tipi + temas sayısı gösterir |
| Sağ üst panel | Piyasa yönü, aktif çizgi sayısı, ATR |

---

### Uyarılar Nasıl Çalışır?

**Temas Uyarısı örneği:**
```
Eğik Destek TEMAS! | Fiyat: 1.08542 | Çizgi: 1.08510 | Temas #3
```
Bu uyarı, fiyatın destek çizgisine yaklaştığını gösterir.
→ Yükselen trendde bu, **alım fırsatı** sinyali olabilir.

**Kırılım Uyarısı örneği:**
```
Eğik Destek KIRILDI! | Fiyat: 1.08201 | Çizgi: 1.08490
```
Bu uyarı, destek çizgisinin aşağı kırıldığını gösterir.
→ **Trend dönüşü** veya **short fırsatı** sinyali olabilir.

---

### Sık Yapılan Hatalar ve Çözümleri

| Hata | Neden | Çözüm |
|---|---|---|
| Çizgi görünmüyor | Pivot bulunamadı | `InpLeftBars` ve `InpRightBars` değerlerini düşürün |
| Çok fazla çizgi var | `InpMinTouches` düşük | 3'e yükseltin |
| Yanlış trend yönü gösteriyor | `InpTrendLookback` çok kısa | Değeri artırın |
| Çok fazla uyarı geliyor | Toleranslar düşük | `InpTouchTolerance` değerini artırın |
| Kırılım uyarısı çok erken tetikleniyor | `InpBreakTolerance` düşük | 0.7–1.0 arasına yükseltin |

---

### ⚠️ Önemli Notlar

- Bu gösterge **analiz aracıdır**, tek başına alım/satım kararı vermez. Fiyat aksiyonu, hacim ve diğer analizlerle birlikte kullanın.
- Uyarılar **gecikmeli** tetiklenebilir; bar kapanışında değerlendirme yapılır.
- Push bildirimi için MetaTrader 5 hesabınızda MetaQuotes ID tanımlanmış olmalıdır.
- E-posta bildirimi için **Araçlar → Seçenekler → E-posta** menüsünden SMTP ayarları yapılmış olmalıdır.
- Gösterge, geçmiş bar verilerini kullanarak test edilebilir; ancak gerçek zamanlı performans için canlı piyasada gözlemleyin.

---

*Auto Trend Line Assistant v2.0 — Algoritmik Trend Analizi, Basit Kural, Güçlü Sonuç.*
Produtos recomendados
Was: $249  Now: $99   Market Profile defines a number of day types that can help the trader to determine market behaviour. A key feature is the Value Area, representing the range of price action where 70% of trading took place. Understanding the Value Area can give traders valuable insight into market direction and establish the higher odds trade. It is an excellent addition to any system you may be using. Inspired by Jim Dalton’s book “Mind Over Markets”, this indicator is designed to suit the
VELOS Trading Indicator Precision. Speed. Confidence. The VELOS Trading Indicator is a professional, non-repainting MT5 trading system developed by DC Trading to help traders identify high-probability trading opportunities with confidence. Designed for both beginner and experienced traders, VELOS combines trend analysis, momentum confirmation, and volatility filtering into one intelligent indicator, delivering precise entry and exit signals while reducing false setups. Built for fast-moving m
ONNYX INDICATOR versão 1.14 Indicador de oferta e demanda para MetaTrader 5 com sinais confirmados sem repaint. Detecta pivôs confirmados, ajusta a largura das zonas pelo ATR, exibe a qualidade em porcentagem e desenha setas BUY/SELL em candles fechados. PRINCIPAIS RECURSOS - Zonas de oferta e demanda com pontuação percentual dentro da zona. - Setas BUY/SELL ampliadas após o fechamento do candle. - Filtro de tendência por EMA e confirmação opcional de rejeição. - Painel de tendência, níveis e co
What if you could finally SEE where the market really wants to go? Most traders watch price. Pros watch VOLUME — where the money was actually traded. Volume Profile Fibo Confluence puts that reading right in front of you, in plain language, no jargon. WHAT YOU SEE ON YOUR CHART • The POC, the most-traded price: the market's natural magnet • The value area (VAH / VAL): the "house" where price spends its time • Automatic Fibonacci retracement + the golden pocket • Low-volume nodes
Pro Gold System Indicator
PEDRO JOAQUIM GONCALVES GOMES
ADVANCED FUNCTIONALITIES: Trend Score (0-100) with visual bar Intelligent signals with adjustable strength (1-10) Risk management with automatic TP/SL Audible and visual alerts Price zones with smooth filling Multi-indicator analysis (RSI, ATR, BB, EMAs) DESIGN FEATURES Modern Visual: Smooth and well-spaced lines (EMA with 2-3px width) Vibrant and professional colors (Sky Blue, Orange, Gold) Modern arrows (code 233/234) for buy/sell signals Configurable dark/light theme Adjustable transparency f
Market Structure, Liquidity and Price Action Analysis for MetaTrader 5 A chart can contain plenty of information and still leave a trader without a clear decision. A BOS label may appear, liquidity may be nearby, and an order block may remain active, yet the real challenge is understanding how those elements relate to one another. ICT Yoshi Pro organizes that process into a cleaner, more disciplined MetaTrader 5 workflow. What ICT Yoshi Pro Does ICT Yoshi Pro is a manual decision-support indicat
A Master Edition é uma ferramenta analítica de nível profissional projetada para visualizar a estrutura do mercado através da lente do volume e do fluxo de dinheiro. Ao contrário dos indicadores de volume padrão, esta ferramenta exibe um Perfil de Volume Diário diretamente no seu gráfico, permitindo ver exatamente onde a descoberta de preços ocorreu e onde o "dinheiro inteligente" está posicionado. Esta Master Edition é projetada para clareza e velocidade, apresentando um sistema único de Auto-T
Noize Absorption Index - is the manual trading system that measures the difference of pressure between bears forces and bulls forces. Green line - is a noize free index that showing curent situation. Zero value of index shows totally choppy/flat market.Values above zero level shows how powerfull bullish wave is and values below zero measures bearish forces.Up arrow appears on bearish market when it's ready to reverse, dn arrow appears on weak bullish market, as a result of reverse expectation.
SMC Smart Flow Pro
Thitipong Nookhunthod
Short Description: SMC Smart Flow Pro is an advanced Smart Money Concept indicator that automatically detects Break of Structure (BOS), Change of Character (CHoCH), and projects precise TP/SL target levels on all timeframes — built for serious traders who trade with institutional flow. Full Description: SMC Smart Flow Pro is a premium Smart Money Concept (SMC) indicator for MetaTrader 5, engineered for traders who want to trade alongside institutional order flow. By automatically mapping m
Here   our more valuable tools SMC Trend Trading   ,  Easy SMC Trading  ,  Institutional SMC Architect Volume Analysis Tools  ,  Volume flow Profile  ,  Market volume profile  , FVG with Volume  , Liquidity Heatmap Profile  ,  Volume Spread Analysis The    Liquidity Heatmap   is a sophisticated institutional trading tool designed to reveal where over-leveraged traders are trapped. By calculating estimated liquidation levels based on volume spikes and leverage, this indicator draws a dynamic "h
Passband Filter Pro Passband Filter Pro is a trend and cycle oscillator for MetaTrader 5. It is built on the Ehlers Super Passband Filter, a band pass filter that removes long term trend drift and short term noise so that only the dominant market cycle remains. The result is a clean oscillator with a color cloud that shows overbought and oversold conditions, cycle turns, and momentum on forex, gold, indices, stocks and crypto. Most traders enter too early or too late. Simple moving averages la
O nível Premium é um indicador único com mais de 80% de precisão nas previsões corretas! Este indicador foi testado pelos melhores Especialistas em Negociação por mais de dois meses! O indicador do autor você não encontrará em nenhum outro lugar! A partir das imagens você pode ver por si mesmo a precisão desta ferramenta! 1 é ótimo para negociar opções binárias com um tempo de expiração de 1 vela. 2 funciona em todos os pares de moedas, ações, commodities, criptomoedas Instruções: Assim
Volume Profile Multiple — Perfis de Volume Múltiplos com Buffers para Trading Algorítmico Cansado de desenhar o Volume Profile bloco por bloco, tendo que redesenhar e recalcular tudo sempre que muda de timeframe? O Volume Profile Multiple desenha automaticamente vários perfis de volume consecutivos no gráfico, revelando onde o interesse institucional realmente esteve em cada trecho do mercado — e não apenas no último intervalo visível. O que o indicador faz por você O indicador divide o históric
O indicador DYJ BoS identifica e marca automaticamente os principais elementos das alterações na estrutura do mercado, incluindo: Ruptura da Estrutura (BoS): ocorre quando o preço faz um grande movimento, rompendo o ponto anterior da estrutura. Marca possíveis linhas de tendência de alta e de baixa (UP e DN, ou seja, novos máximos e novos mínimos consecutivos) e, quando o preço rompe essas linhas, marca-as com setas vermelhas (de baixa) e verdes (de alta) . Um BoS ocorre normalmente quando o
Structure King AI Signal Structure King AI Signal is a professional MetaTrader 5 trading indicator designed to help traders analyze market structure, trend direction, multi-timeframe confirmation and trade management from one clean dashboard. Key Features • Market Structure & Trend Analysis • BUY / SELL Signals • Multi-Timeframe (HTF) Confirmation • Entry Price Levels • Dynamic Stop Loss (SL) • TP1 / TP2 / TP3 Levels • ATR Volatility Analysis • ADX Trend Strength Filter • Adaptive Market Filter
Your Trend Friend
Luigi Nunes Labigalini
5 (1)
A tendência é sua amiga! Veja a cor do indicador e faça suas operações nessa direção. Ele não repinta. Ou seja, depois que cada candle se fecha, a cor dele é definitiva e não irá se alterar. Você pode focar em movimentos mais curtos e rápidos ou tendências mais longas, basta testar o que melhor se encaixa no seu operacional de acordo com o ativo e tempo gráfico usado. Altere o parâmetro de entrada "Length" e o indicador irá se adaptar automaticamente (quanto maior ele for, maior a tendência an
DAILY OH/OL SDEV QUANT MODEL - STATISTICAL TRADING WITH PRECISION RISK MANAGEMENT TRADE WITH MATHEMATICAL CERTAINTY - KNOW YOUR EXACT STOP-LOSS AND TAKE-PROFIT BEFORE YOU ENTER This indicator analyzes 5,000+ days of price history to give you: Exact entry levels (sigma bands locked at daily open) Exact stop-loss distance (from M
WBS SMC Without Repaint – Ultimate XAUUSD Scalping Engine (M5 Timeframe) Take your Gold trading to the institutional level with "WBS SMC Without Repaint", a highly advanced premium indicator engineered specifically for XAUUSD (Gold) on the M5 (5-Minute) timeframe.  Built upon the core pillars of Smart Money Concepts (SMC) combined with precise algorithmic candle pattern recognition, this tool identifies high-probability institutional footprints in real-time. Best of all: 100% ABSOLUTELY
C88 Projected Candle See the Bigger Picture Before the Candle Closes C88 Projected Candle is a professional market visualization indicator that projects the current higher timeframe candle directly onto your active chart. It helps traders understand the evolving market structure without constantly switching between timeframes. Whether you trade Price Action, ICT, Smart Money Concepts (SMC), or Volume Profile, this indicator provides a cleaner and more intuitive way to read market context. Key Fe
Cumulative Volume Delta (CVD) MA-X: Ferramenta Inteligente de Sentimento de Fluxo de Ordens Desvende a mecânica oculta do mercado com o Cumulative Volume Delta (CVD) MA-X . Enquanto os indicadores de volume padrão apenas dizem quanto foi negociado, o CVD MA-X diz QUEM está vencendo a batalha entre compradores e vendedores e QUANDO . Ao agregar a ação do preço em nível de tick e a distribuição de volume, este indicador fornece um mapa cristalino da convicção e exaustão do mercado. A Vantagem do
Nosso indicador   Basic Support and Resistance   é a solução necessária para aumentar sua análise técnica.Este indicador permite que você forneça níveis de suporte e resistência no gráfico/   versão MT4 grátis Recursos Integração dos níveis de Fibonacci: Com a opção de exibir níveis de Fibonacci, juntamente com os níveis de suporte e resistência, nosso indicador fornece uma visão ainda mais profunda do comportamento do mercado e possíveis áreas de reversão. Otimização de desempenho: Com a opçã
Visual CrossPulse Dynamics Indicator
AL MOOSAWI ABDULLAH JAFFER BAQER
Visual CrossPulse Dynamics: Trade with the Market's True Rhythm Unlock a new level of market insight with Visual CrossPulse Dynamics, a sophisticated trading indicator designed to adapt to ever-changing volatility and reveal the true direction of the trend. Are you tired of indicators that lag in fast-moving markets or give false signals during consolidation? The Visual CrossPulse Dynamics indicator solves this problem by using an advanced, adaptive algorithm that intelligently adjusts to the m
Multi Timeframe Smc Bias Finder Trading in alignment with higher timeframe structure is one of the most consistently profitable habits a trader can build. The difficulty has always been execution: switching between timeframes, manually reading structure, and keeping track of whether the Daily, 4-Hour and 1-Hour are all pointing in the same direction before committing to a position. Multi Timeframe Smc Bias Finder resolves that entirely. Three tools in one indicator: A live multi-timeframe bias d
SMC Indicator BOS & CHoCH analyze market structure using Smart Money Concepts The indicator combines BOS (Break of Structure), CHoCH (Change of Character), Fair Value Gaps (FVG), Liquidity Sweep logic and ATR filtering to provide a structured view of market movements and potential trading opportunities. The indicator automatically identifies swing highs and swing lows and monitors structural breaks in the market. BOS (Break of Structure) identifies potential continuation of the current market st
Este é sem dúvida o indicador de reconhecimento automático de formação de preço harmônico mais completo que você pode encontrar para a MetaTrader Platform. Ele detecta 19 padrões diferentes, leva as projeções de Fibonacci tão a sério quanto você, exibe a Zona de Reversão Potencial (PRZ) e encontra níveis adequados de stop loss e take-profit. [ Guia de instalação | Guia de atualização | Solução de problemas | FAQ | Todos os produtos ] Detecta 19 formações harmônicas de preços diferentes Traça
PatternScope — Multi-Pattern Recognition for MT5 PatternScope is a multi-pattern recognition indicator for MetaTrader 5. It scans price action for classic chart patterns, confirms breakouts, and draws clear   Entry, Stop Loss and Take Profit   levels. A compact dashboard shows the latest pattern, bias and Risk:Reward. Patterns:   Double Top/Bottom, Triple Top/Bottom, Head and Shoulders (and inverted), Bullish & Bearish Flag, Pennant, Rising & Falling Wedge, Triangle, Rectangle, Cup and Handle —
Pattern Recognition EA
Claudiu-georgian Zavera
Pattern Recognition EA - From Learn to Earn. The market repeats itself. This EA finds every past repeat of the current candle sequence - and lets history vote the direction. ONE SHAPE. EVERY REPEAT IN HISTORY VOTES. The last N candles on your signal timeframe form a shape. The EA scans the history you choose - a fixed number of bars or everything your broker provides - for the SAME shape, and checks what happened next, every single time. Only when enough repeats exist AND a clear majority of t
This indicator is the mql5 version of the   SSLHybrid   indicator. MT4 Version Find out more here:  https://www.mql5.com/en/users/rashedsamir/seller Description of TradingView version: This script is designed for the NNFX Method, so it is recommended for Daily charts only. Tried to implement a few VP NNFX Rules This script has a SSL / Baseline (you can choose between the SSL or MA), a secondary SSL for continiuation trades and a third SSL for exit trades. Alerts added for Baseline entries, SSL
Max Min Delta Indicator - Market Volume Imbalance Analysis Gain Deeper Insights into Market Volume Imbalance with Delta Analysis What is the Max Min Delta Indicator? The Max Min Delta Indicator is a powerful market volume analysis tool that visually represents maximum and minimum delta values using a histogram. It helps traders identify market strength, weakness, absorption, and aggressive buying/selling activity with precision. Key Features Histogram Visualization: Displays Max Delta (Green) an
Os compradores deste produto também adquirem
Trend Sniper X
Sarvarbek Abduvoxobov
4.86 (42)
Trend Sniper X é um indicador de acompanhamento de tendência para múltiplos tempos gráficos no MetaTrader 5 que ajuda os traders a identificar a direção da tendência e potenciais pontos de reversão com clareza e precisão. para MT4: https://www.mql5.com/en/market/product/193245 Informações sobre o preço: O preço atual é promocional e está sujeito a alterações à medida que novas atualizações e funcionalidades forem lançadas. Oferta Bônus: Para obter o Auto-Trade Assistant EA GRATUITO para este in
Smart Trend Trading System — MetaTrader 5 Após a compra, envie-me uma mensagem no MQL5 para receber Smart Universal Expert Advisor GRÁTIS, além do curso online, do manual em PDF e do acesso ao grupo privado. O STTS reúne a direção da tendência, sinais de entrada e saída, zonas de reversão e níveis de preço importantes diretamente no seu gráfico. Siga o sistema manualmente ou conecte um EA compatível separado para executar operações automaticamente com as configurações que você escolher. UM SISTE
Zoryk Gold
Reda El Koutbane
4.78 (18)
O desconto termina em 24 horas — próximo preço $ 69 ZORYK — Sistema avançado de sinais para XAUUSD no MetaTrader 5 Você conhece essa sensação. Você passa muito tempo analisando o ouro. Espera pela entrada certa. Finalmente abre a operação e o preço começa imediatamente a se mover contra você. Você fecha cedo demais, move o Stop Loss ou hesita por alguns segundos. Depois disso, o mercado alcança exatamente o destino que você esperava originalmente, mas sem você dentro da operação. O problema ne
Um novo Rei chegou à cidade - Indicador + Gestão de Ordens (TP1 + TP2 + TP3) + Enviador opcional de sinais para Telegram INCLUÍDO (GRÁTIS) (SISTEMA COMPLETO DE TRADING e SINAIS) Nosso melhor EA para Ouro: Gold Slayer Este indicador inclui uma estratégia avançada, um sistema de trading com gestão de ordens personalizável e um sistema de reversão à média que combina extensões de envelopes, apoiado por múltiplos filtros inteligentes de confirmação, como o RSI, para capturar entradas de reversão de
Tenha sua vantagem no trading à vista! M5 Sniper é um novo indicador da MeanFX. Ele combina sinais de trading precisos com níveis adaptativos de TP/SL — criando, como resultado, as melhores operações estatísticas possíveis! O preço aumenta a cada 5 compras, o próximo preço é de 69$ Envie-me uma mensagem após a compra para receber dicas/guia e um EA bônus O que o faz se destacar? Desempenho estatístico comprovado no Gold XAUUSD ( funciona em praticamente todos os ativos , com foco em dominar um ú
SMC Intraday Formula
VividMind Digital Solutions
5 (26)
Vamos ser honestos primeiro. Nenhum indicador sozinho vai te tornar lucrativo. Se alguém te disser o contrário, está te vendendo um sonho. Qualquer indicador que mostre setas perfeitas de compra/venda pode ser feito para parecer impecável — basta dar zoom na parte certa da história e tirar um print das operações vencedoras. Nós não fazemos isso.  SMC Intraday Formula é uma ferramenta. Ela lê a estrutura do mercado para você, identifica as zonas de maior probabilidade de preço e mostra exatament
SuperScalp Pro
Van Minh Nguyen
4.54 (37)
SuperScalp Pro - Professional Multi-Layer Confluence Scalping System O SuperScalp Pro é um indicador avançado de scalping que aprimora o Supertrend clássico com vários filtros inteligentes de confirmação. Ele ajuda a identificar oportunidades de Buy/Sell com maior probabilidade de sucesso, reduzindo significativamente os sinais falsos. Setas claras de Buy e Sell aparecem diretamente no gráfico, juntamente com os níveis de Stop Loss e Take Profit baseados em ATR, calculados automaticamente em tem
Auto Optimized SpeedAngle é um sistema de vetorização de momentum de nível institucional que elimina o sobreajuste ( curve-fitting ) por meio da otimização contínua de avanço ( Walk-Forward Optimization , WFO). Em vez de depender de entradas estáticas que se degradam quando os regimes de mercado mudam, o indicador recalibra dinamicamente seus parâmetros utilizando validação fora de amostra ( Out-of-Sample , OOS), garantindo que os sinais exibidos representem vantagens estatísticas genuínas e não
Boba Analysis Suite
Trade Ready Solutions LLC
5 (1)
Boba Analysis Suite O Boba Analysis Suite é um indicador de análise para o MetaTrader 5. Reúne a estrutura do mercado, as zonas de preço relevantes e o contexto geral do mercado numa única visualização do gráfico. Desenvolvido a partir da experiência prática como trader e formador de traders, apoia um processo de análise estruturado: avaliar a direção do mercado, identificar níveis importantes e analisar vários períodos gráficos em conjunto. Análise em contexto O significado de cada sinal depend
GoldenX Entry MT5
VividMind Digital Solutions
5 (17)
GoldenX Entry é um indicador para MT5 com um algoritmo adaptativo Smart Entry Trend, um sistema de pontuação de sinais, um detector de regime de mercado e um filtro de volatilidade. Cada sinal inclui um nível de entrada calculado, três níveis de Take-Profit (TP1, TP2, TP3) e um nível de Stop-Loss. Ele é construído sobre múltiplas camadas analíticas projetadas para se adaptar a diferentes condições de mercado, combinando um sistema analítico multicamadas com um otimizador integrado e um sistema d
A lenda está de volta: Entry Points Pro 10. O relançamento do lendário indicador que se manteve por 3 anos no Top-3 do MQL5 Market. Centenas de avaliações entusiasmadas (589 nas duas versões), milhares de traders operam com ele todos os dias, 31.000+ downloads da versão demo   MT4+MT5 . Li cada avaliação de vocês ao longo de cinco anos — e, em vez de promessas, coloquei as respostas dentro da versão 10. Do autor que está no mercado desde 1999 e valoriza a honestidade, a própria reputação e os se
Adaptive Price Action Engine Compre um indicador, ganhe o EA de graça Análise Auto-Otimizada de Tendências e Padrões de Candlestick em Múltiplos Timeframes Os mercados estão em constante mudança, e nem todos os padrões de Price Action têm o mesmo valor em todas as condições de mercado. O Adaptive Price Action Engine foi desenvolvido para se adaptar às mudanças nas condições do mercado, combinando estrutura de tendência, análise Multi-Timeframe, padrões de candlestick e otimização estatística em
ARIPoint
Temirlan Kdyrkhan
1 (4)
ARIPoint is a powerful trading companion designed to generate high-probability entry signals with dynamic TP/SL/DP levels based on volatility. Built-in performance tracking shows win/loss stats, PP1/PP2 hits, and success rates all updated live. Key Features: Buy/Sell signals with adaptive volatility bands Real-time TP/SL/DP levels based on ATR Built-in MA Filter with optional ATR/StdDev volatility Performance stats panel (Success, Profit/Loss, PP1/PP2) Alerts via popup, sound, push, or email Cu
Gann Made Easy   é um sistema de negociação Forex profissional e fácil de usar, baseado nos melhores princípios de negociação usando a teoria do sr. W. D. Gann. O indicador fornece sinais precisos de COMPRA e VENDA, incluindo níveis de Stop Loss e Take Profit. Você pode negociar mesmo em movimento usando notificações PUSH. Entre em contato comigo após a compra para receber instruções de negociação e ótimos indicadores extras gratuitamente! Provavelmente você já ouviu muitas vezes sobre os método
M1 Sniper MT5
Oleg Rodin
5 (7)
O   M1 SNIPER   é um sistema indicador de negociação fácil de usar. É um indicador de seta projetado para o período M1. O indicador pode ser usado como um sistema independente para scalping no período M1 e pode ser usado como parte do seu sistema de negociação existente. Embora este sistema de negociação tenha sido projetado especificamente para negociação no M1, ele também pode ser usado em outros períodos. Originalmente, desenvolvi este método para negociar XAUUSD e BTCUSD. Mas considero-o úti
FiboSniper Pro
Van Minh Nguyen
5 (4)
FiboSniper Pro – Multi-Filter Fibonacci System with Auto SL/TP and Control Panel FiboSniper Pro é um indicador técnico que combina Fibonacci Envelopes dinâmicos com vários filtros de confirmação para gerar sinais seletivos de Buy e Sell. Os níveis de Fibonacci são calculados com base em Moving Average e ATR e, em seguida, filtrados por ADX, EMA, RSI, ATR, Volume, Time e estrutura das velas. O indicador exibe diretamente no gráfico os níveis automáticos de Stop Loss e Take Profit baseados em ATR,
Get Ready for Major New Features in Our Next Update — Version 2.52 Coming Soon! [NEW]  We’re taking market analysis to the next level with 4   new features designed to meet your trading needs. Introducing: TRADE OVERVIEW DASHBOARD  CONFLUENCE AT ZONE  OTE   Strong & Weak High/Low  1. TRADE OVERVIEW DASHBOARD A dashboard that helps you see the overall market picture more easily, with key information from multiple timeframes and trading guidance to support your trading decisions, helping you an
Break and Retest Hunter
Mohamed Hassan
3.67 (3)
Break and Retest Hunter is a powerful MetaTrader 5 indicator designed to automatically identify support and resistance levels, breakout structures, and potential retest opportunities in real time. Bonus Indicator: After purchasing Break and Retest Hunter , contact me to receive Trade Indicator Assistant EA completely free as a bonus utility. $65 for the next 10 copies . Next price is $120.  Combining adaptive market analysis, clear BUY/SELL signals, Fibonacci-based profit targets, and a premiu
Apex Patterns PRO Compre o indicador - Obtenha um Expert Advisor baseado nele GRATUITAMENTE. Inteligência Auto-otimizada de Padrões e Rompimentos Os rastreadores de padrões tradicionais dependem de entradas fixas, frequentemente apresentando baixo desempenho quando a volatilidade e as estruturas do mercado mudam. O Apex Patterns PRO foi projetado para se adaptar às mudanças nas condições do mercado, combinando o reconhecimento estrutural de padrões de gráfico, filtragem de momentum e auto-otimi
Gold Trend Coach MT5
Cristhian Alexander Gaibor Cuasquer
5 (2)
Gold Trend Coach é um indicador de tendência para ouro (XAUUSD) no MetaTrader 5 com sinais de compra e venda, stop loss e três alvos de take profit, confirmados no fechamento da vela, um painel coach multi-timeframe e alertas no seu celular e no Telegram. Feito para scalping em M5 e intraday em M15 durante as sessões de Londres e Nova York. Gold Trend Coach: sinais de tendência para o ouro XAUUSD com entrada, stop e três alvos. Preço de lançamento $39 para as primeiras 20 cópias, depois $59. Es
Neuro Poseidon MT5
Daria Rezueva
4.75 (52)
Neuro Poseidon is a new indicator by Daria Rezueva. It combines precise trading signals with adaptive TP/SL levels - creating best possible trades as a result! Message me and get  Neuro Poseidon Assistant  as a gift to automize your trading process! What makes it stand out? 1. Proven profitability on all assets and timeframes 2. Only confirmed BUY and SELL signals present on the chart 3. Adaptive TP & SL levels generated by the software for each trade 4. Easy to understand - suitable for al
Trend Catcher ind mt5
Ramil Minniakhmetov
5 (18)
INDICADOR TREND CATCHER O Indicador Trend Catcher analisa os movimentos de preços do mercado, utilizando uma combinação de indicadores de análise de tendências adaptativos, proprietários e personalizados pelo autor. Identifica a verdadeira direção do mercado, filtrando o ruído de curto prazo e focando a força do momentum subjacente, a expansão da volatilidade e o comportamento da estrutura de preços. Utiliza também uma combinação de indicadores personalizados de suavização e filtragem de tendê
Unix Scalper
Issam Kassas
4 (4)
Unix Scalper — MetaTrader 5 Após a compra, envie-me uma mensagem no MQL5 para receber Smart Universal Expert Advisor GRÁTIS, além do curso online, do manual em PDF e do acesso ao grupo privado. Identifique a oportunidade. Veja o plano. Escolha como operar. O UNIX Scalper reúne análise de mercado, decisões BUY/SELL/WAIT e níveis de Entry, Stop Loss, TP1 e TP2 em um painel organizado. VEJA O SINAL E O PLANO • Decisões claras: BUY, SELL ou WAIT. • Níveis definidos: Entry, Stop Loss, TP1 e TP2. •
Advanced Supply Demand MT5
Bernhard Schweigert
4.53 (15)
Atualmente com 33% de desconto! A melhor solução para qualquer Trader Novato ou especialista! Este indicador é uma ferramenta de negociação exclusiva, de alta qualidade e acessível porque incorporamos uma série de recursos proprietários e uma nova fórmula. Com esta atualização, você poderá mostrar fusos horários duplos. Você não só será capaz de mostrar um TF mais alto, mas também mostrar ambos, o TF do gráfico, MAIS o TF mais alto: MOSTRANDO ZONAS ANINHADAS. Todos os traders de Oferta e Demanda
FX Trend MT5 NG
Daniel Stein
5 (6)
FX Trend NG: A Nova Geração de Inteligência de Tendência Multi-Mercado Visão Geral FX Trend NG é uma ferramenta profissional de análise de tendências e monitoramento de mercado em múltiplos períodos de tempo. Permite compreender a estrutura completa do mercado em segundos. Em vez de alternar entre vários gráficos, você visualiza instantaneamente quais ativos estão em tendência, onde o momentum está enfraquecendo e onde existe alinhamento forte entre diferentes timeframes. Oferta de Lançamento
Apresentando       Quantum Breakout PRO   , o inovador Indicador MQL5 que está transformando a maneira como você negocia Breakout Zones! Desenvolvido por uma equipe de traders experientes com experiência comercial de mais de 13 anos,       Quantum Breakout PRO       foi projetado para impulsionar sua jornada comercial a novos patamares com sua estratégia de zona de fuga inovadora e dinâmica. O Quantum Breakout Indicator lhe dará setas de sinal em zonas de breakout com 5 zonas-alvo de lucro e su
O Scalper Vault é um sistema de negociação poderoso e completo, projetado para traders que buscam consistência em operações intraday. Este indicador de alta precisão funciona como um sistema de negociação autônomo, oferecendo análises de nível institucional tanto para o mercado Forex quanto para Opções Binárias. ENTRE EM CONTATO COMIGO APÓS A COMPRA PARA RECEBER DICAS DE NEGOCIAÇÃO E UM BÔNUS EXCLUSIVO! Ao eliminar suposições e análises manuais complexas, o Scalper Vault permite que você foque
Volatility Master for MetaTrader is a real-time dashboard tool that scans up to  50 symbols  to identify high-volatility , trending markets instantly. With bullish/bearish signals, customizable alerts, and a user-friendly interface, it helps you avoid range-bound conditions and focus on high-probability trades. Clarity leads to confidence. Trade confidently and protect your capital effectively with this powerful dashboard. We don't offer free or bonus indicators in exchange of reviews from you.
Smart Price Action Concepts — MetaTrader 5 Após a compra, envie-me uma mensagem no MQL5 para receber Smart Universal Expert Advisor GRÁTIS, além do curso online, do manual em PDF e do acesso ao grupo privado. Veja a estrutura. Identifique as zonas. Monte seu plano de trading. Reúna Smart Money Concepts (SMC), análise no estilo ICT e ação do preço em um gráfico organizado. Identifique a estrutura do mercado, os blocos de ordens, os níveis de referência de liquidez e os desequilíbrios. Depois, esc
O   SR Liquidity   é um indicador de trading projetado para revelar as zonas ocultas onde a liquidez do mercado se concentra e o preço reage com maior intensidade. Essas áreas específicas de liquidez funcionam como níveis poderosos de suporte e resistência, oferecendo um mapa claro de onde é mais provável que o mercado reverta. Em vez de traçar linhas comuns de Suporte e Resistência, o SR Liquidity analisa o comportamento real dos preços para detectar as zonas onde se acumulam pressões de compra
Mais do autor
️ **This document and indicator do not constitute investment advice. Past performance is no guarantee of future results.** 1. Product Introduction **ATR Fibonacci Trend Envelopes** combines three proven concepts into a single tool: * **Volatility-sensitive trend engine** — Dynamic bands that expand and contract with the ATR around a selectable moving average baseline (SMA/EMA/WMA/HMA/RMA). If the price breaks above the upper band on a candle close, a **BULL** regime begins; if it breaks bel

Filtro:
Sem comentários
Responder ao comentário