AutoTrendLineAssistant

  • Indicatori
  • Semih Erten
    Semih Erten
    TRMentorFx — Otomatikleştirilmiş Forex Çözümleri
    2021 yılından bu yana forex piyasalarında aktif olarak çalışmaktayım. Bu süreçte edindiğim bilgi ve deneyimi, tamamen kendi geliştirdiğim strateji modellerine dönüştürdüm.
  • Versione: 2.0
  • Attivazioni: 5
# AUTO TREND LINE ASSISTANT v2.0
### MQL5 Market — Ürün Açıklaması / Çalışma Mantığı / Kullanım Talimatları

---

## 🔷 ÜRÜN AÇIKLAMASI (MQL5 Market Listing)

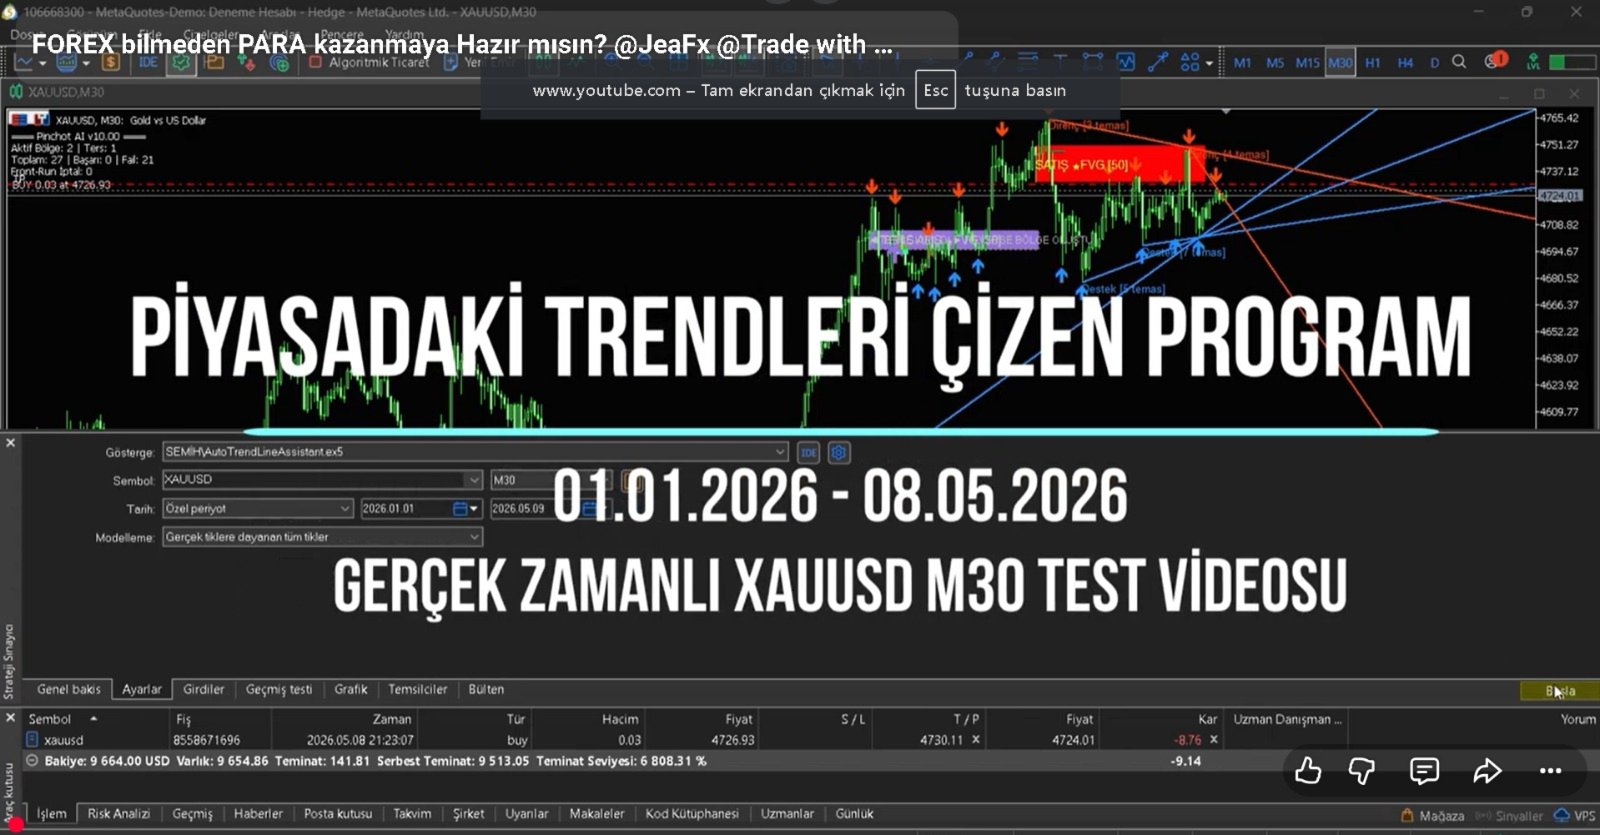
**Auto Trend Line Assistant v2.0**, piyasanın anlık yönünü otomatik olarak analiz eden ve kurallara dayalı şekilde yalnızca doğru trend çizgisini çizen akıllı bir MetaTrader 5 göstergesidir.

> **Tek cümleyle:** Yükselen piyasada sadece eğik destek, düşen piyasada sadece eğik direnç — fazlası yok, eksiği yok.

Klasik trend çizgisi araçlarının aksine bu gösterge, **gereksiz çizgilerle ekranı doldurmaz**. Piyasanın yapısını okur, yönüne karar verir ve o yöne uygun tek tip çizgiyi algoritmik doğrulukla yerleştirir.

---

### ✅ NE İŞE YARAR?

| Sorun | Çözüm |
|---|---|
| Manuel trend çizgisi çizmek zaman alır | Tamamen otomatik, her bar güncellemesinde yeniden hesaplar |
| Yanlış tip çizgi çizilir (düşen trendde destek aramak gibi) | Piyasa yönünü tespit edip sadece kurala uygun çizgi çizer |
| Pivot noktalarını gözle bulmak hatalı olur | Matematiksel pivot algoritması, sol/sağ bar karşılaştırmasıyla doğrular |
| Zayıf trend çizgileri güçlülerle karışır | Güç skoru (temas sayısı + uzunluk + güncellik) ile sıralama yapar |
| Temas ve kırılımları takip etmek zordur | Anlık Alert, Push Bildirim ve E-posta uyarısı sistemi |

---

### 🎯 TEMEL ÖZELLİKLER

- **Akıllı Piyasa Yönü Tespiti** — Higher High/Higher Low ve Lower High/Lower Low yapısıyla trend yönü belirlenir
- **Kural Bazlı Çizgi Seçimi** — Yükselen trendde SADECE eğik destek, düşen trendde SADECE eğik direnç
- **ATR Tabanlı Tolerans** — Temas ve kırılım eşikleri piyasanın volatilitesine göre otomatik ayarlanır
- **Güç Skoru Algoritması** — Her çizgiye temas sayısı, uzunluk ve güncellik skoruna göre puan verilir, en güçlüler öne çıkar
- **Çoklu Çizgi Desteği** — Aynı anda en fazla N adet trend çizgisi gösterilir (parametreyle ayarlanır)
- **Gerçek Zamanlı Uyarılar** — Fiyat çizgiye temas ettiğinde ve çizgiyi kırdığında anında bildirim
- **Görsel Pivot İşaretleri** — Tepe ve dip pivotları grafik üzerinde işaretlenir
- **Bilgi Paneli** — Piyasa yönü, aktif çizgi sayısı, pivot sayısı ve ATR değeri canlı gösterilir
- **Tüm Sembol ve Zaman Dilimlerine Uyumlu** — Forex, Kripto, Hisse, Emtia, Endeks

---

### 📊 UYUMLU PLATFORMLAR

- MetaTrader 5 (Build 2000+)
- Tüm broker ve semboller
- Tüm zaman dilimleri (M1'den MN'e kadar)

---

---

## ⚙️ ÇALIŞMA MANTIĞI

### ADIM 1 — Pivot Noktalarının Tespiti

Gösterge, her hesaplama döngüsünde klasik **Williams Fractal** mantığına benzer bir pivot algoritması çalıştırır.

**Tepe Pivot (Pivot High):**
Bir bar, solundaki `InpLeftBars` kadar barın en yüksek değerinden ve sağındaki `InpRightBars` kadar barın en yüksek değerinden büyükse bu bar bir **pivot tepe** olarak işaretlenir.

**Dip Pivot (Pivot Low):**
Aynı mantıkla, bir bar solundaki ve sağındaki tüm barların en düşük değerinden küçükse bu bar bir **pivot dip** olarak işaretlenir.

> Örnek: `InpLeftBars = 5`, `InpRightBars = 3` → Bir tepe pivotu oluşabilmesi için o barın solundaki 5 bar ve sağındaki 3 barın hepsinden yüksek olması gerekir.

---

### ADIM 2 — Piyasa Yönünün Belirlenmesi

Son bulunan pivot noktaları karşılaştırılarak piyasa yapısı okunur:

```
Higher High + Higher Low → YÜKSELEN TREND (TREND_UP)
Lower High  + Lower Low  → DÜŞEN TREND   (TREND_DOWN)
Karışık yapı             → YATAY         (TREND_SIDEWAYS)
```

Pivot bazlı analizin yanı sıra, `InpTrendLookback` periyodundaki kapanış fiyatı değişimi ve ortalama bar aralığı da yardımcı kriter olarak kullanılır.

---

### ADIM 3 — Kurala Göre Trend Çizgilerinin Seçimi

Bu, göstergenin kalbidir. Şu kural **asla değişmez:**

| Piyasa Yönü | Çizilen Çizgi Tipi | Kullanılan Pivotlar |
|---|---|---|
| YÜKSELEN | Sadece Eğik Destek | Dip Pivotları (Low) |
| DÜŞEN | Sadece Eğik Direnç | Tepe Pivotları (High) |
| YATAY | Her iki tip | Her iki pivot grubu |

**Yükselen Piyasada Eğik Destek Algoritması:**
1. Tüm dip pivot çiftleri kombinasyonları incelenir
2. Eğim pozitif olmak zorundadır (Higher Lows yapısı)
3. İki pivot arasında minimum bar mesafesi kontrolü yapılır
4. Çizgi boyunca tüm barlar taranır — fiyat çizginin tolerans dışı altına inmemeli
5. Minimum temas sayısı (`InpMinTouches`) sağlanmalı
6. Güç skoru hesaplanır ve sıralanır

**Düşen Piyasada Eğik Direnç Algoritması:**
1. Tüm tepe pivot çiftleri kombinasyonları incelenir
2. Eğim negatif olmak zorundadır (Lower Highs yapısı)
3. Çizgi boyunca fiyat tolerans dışı üstüne çıkmamalı
4. Minimum temas ve güç skoru kriterleri uygulanır

---

### ADIM 4 — Güç Skoru Hesaplama

Her aday trend çizgisine 0–100 arasında bir **güç puanı** verilir:

```
Güç = Temas Skoru (40%) + Uzunluk Skoru (30%) + Güncellik Skoru (30%)

Temas Skoru   = min(temas_sayısı / 5, 1.0) × 40
Uzunluk Skoru = min(çizgi_uzunluğu / 100 bar, 1.0) × 30
Güncellik     = max(0, (50 - son_pivottan_uzaklık) / 50) × 30
```

En yüksek puanlı çizgiler grafiğe çizilir. `InpMaxTrendLines` parametresiyle kaç çizgi gösterileceği belirlenir.

---

### ADIM 5 — ATR Tabanlı Tolerans Sistemi

Sabit pip değeri yerine **ATR (Average True Range)** kullanılması, göstergenin farklı enstrümanlarda ve farklı volatilite ortamlarında tutarlı çalışmasını sağlar.

```
Temas Toleransı = ATR(14) × InpTouchTolerance
Kırılım Toleransı = ATR(14) × InpBreakTolerance
```

- Düşük volatilite dönemlerinde tolerans daralır → daha hassas
- Yüksek volatilite dönemlerinde tolerans genişler → sahte kırılımları filtreler

---

### ADIM 6 — Uyarı Sistemi

**Temas Uyarısı:**
Mevcut barda fiyat (High veya Low), trend çizgisine temas toleransı içine girdiğinde tetiklenir.

**Kırılım Uyarısı:**
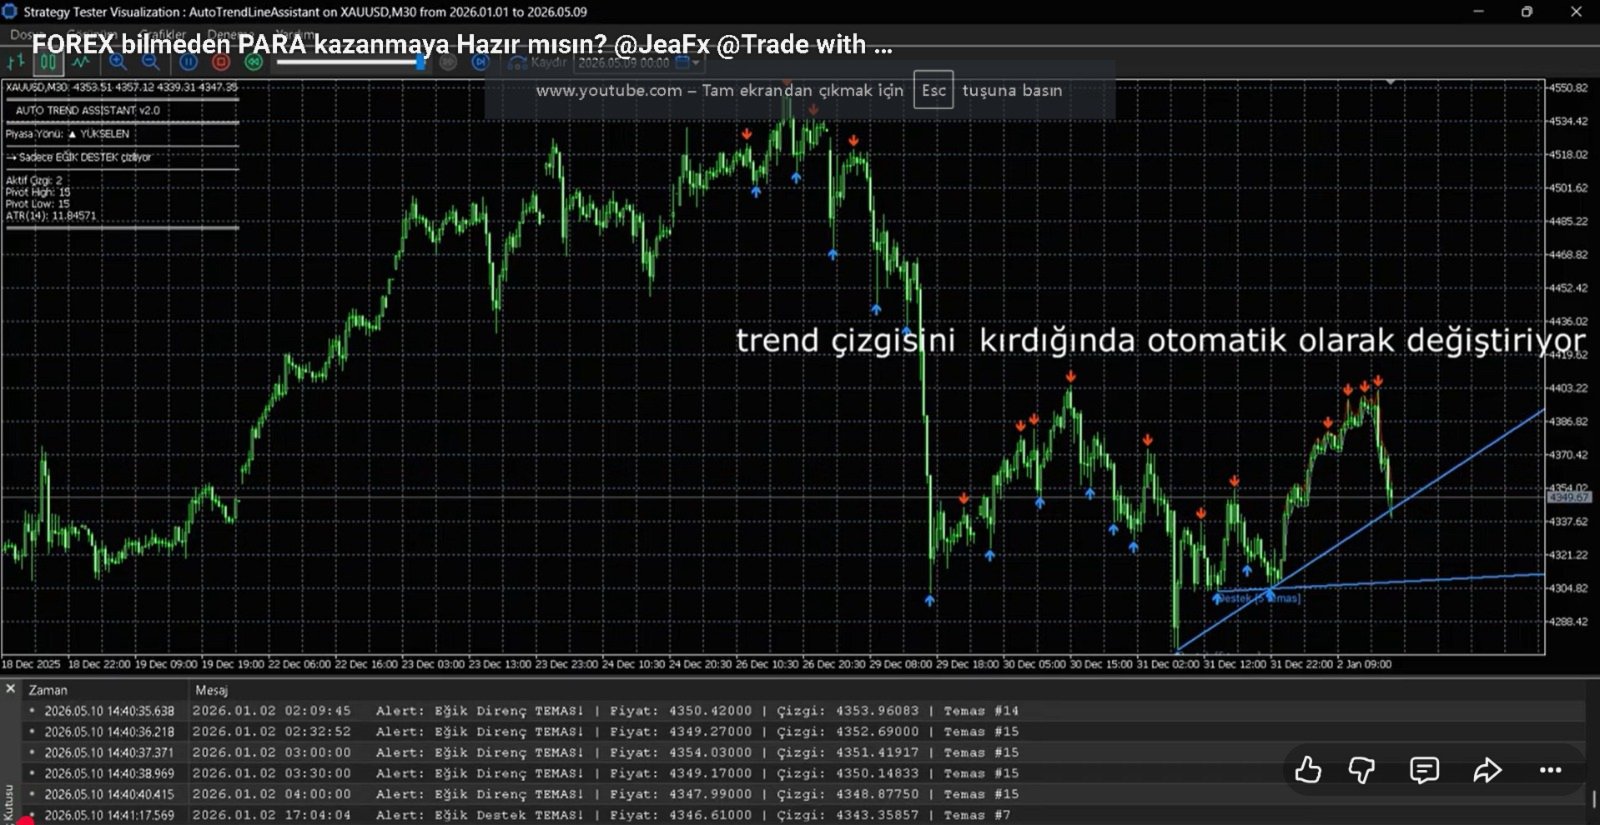
Önceki bar çizginin doğru tarafında kapanırken mevcut bar çizginin yanlış tarafında kırılım toleransını aşarak kapanırsa tetiklenir. Kırılan çizgi otomatik olarak deaktive edilir.

Uyarı kanalları: `Alert()` penceresi · Push Bildirim · E-posta

---

---

## 📋 KULLANIM TALİMATLARI

### Kurulum

1. `.ex5` dosyasını indirin
2. MetaTrader 5'i açın
3. **Dosya → Veri Klasörü Aç** → `MQL5/Indicators/` klasörüne dosyayı kopyalayın
4. MetaTrader 5'i yeniden başlatın veya **Navigator** panelinde sağ tık → **Yenile** yapın
5. İstediğiniz grafik üzerine sürükleyip bırakın

---

### Parametre Ayarları

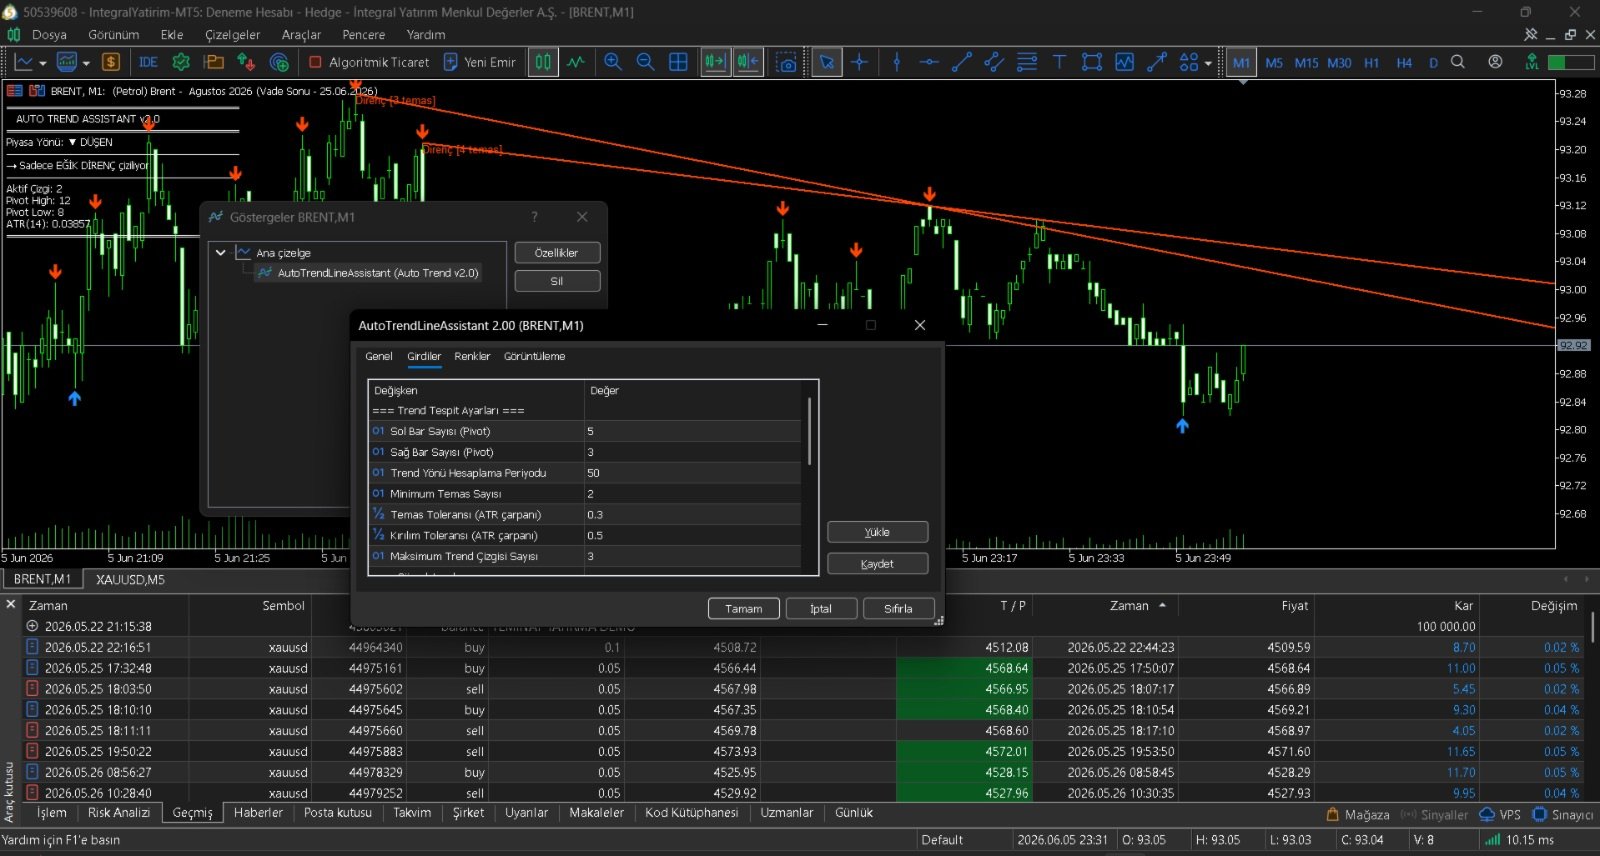
#### 🔧 Trend Tespit Ayarları

| Parametre | Varsayılan | Açıklama |
|---|---|---|
| `InpLeftBars` | 5 | Pivot tespiti için solda kaç bar bakılacak. Düşürürseniz daha fazla pivot bulur, artırırsanız daha az ama daha güçlü pivotlar |
| `InpRightBars` | 3 | Pivot tespiti için sağda kaç bar bakılacak. Düşük değer daha hızlı sinyal verir |
| `InpTrendLookback` | 50 | Piyasa yönü hesabında kullanılan bar sayısı |
| `InpMinTouches` | 2 | Bir trend çizgisinin geçerli sayılması için minimum temas sayısı. 3'e yükseltirseniz sadece çok güçlü çizgiler gösterilir |
| `InpTouchTolerance` | 0.3 | Temas için kabul edilen mesafe (ATR çarpanı). Büyütürseniz daha "geniş" temaslar kabul edilir |
| `InpBreakTolerance` | 0.5 | Kırılım için gereken mesafe (ATR çarpanı). Büyütürseniz daha az kırılım uyarısı alırsınız |
| `InpMaxTrendLines` | 3 | Aynı anda gösterilecek maksimum trend çizgisi sayısı |

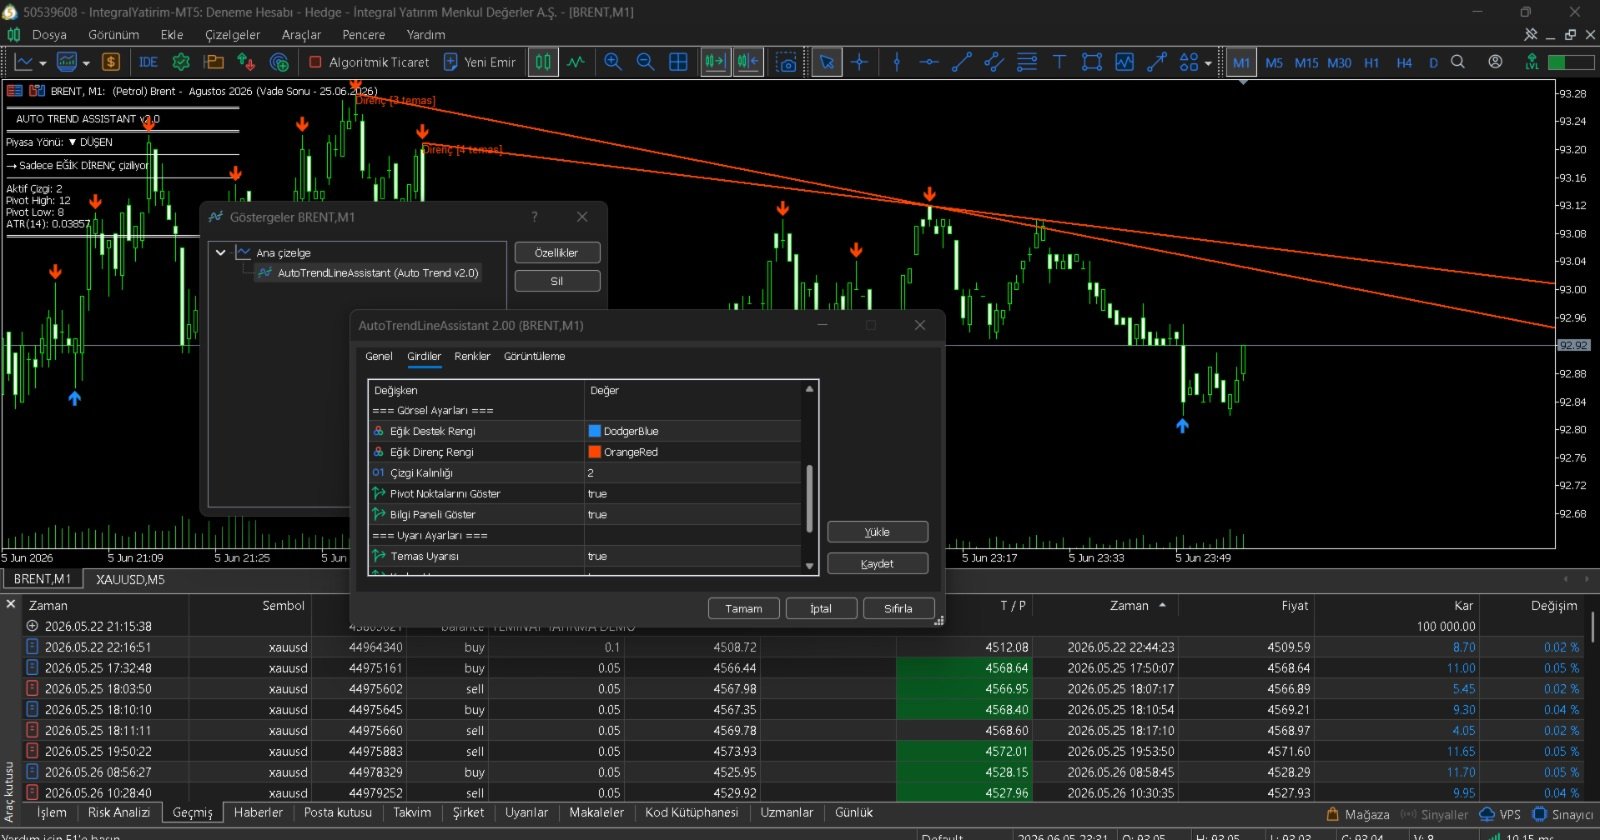
#### 🎨 Görsel Ayarlar

| Parametre | Varsayılan | Açıklama |
|---|---|---|
| `InpSupportColor` | DodgerBlue | Eğik destek çizgisi rengi |
| `InpResistanceColor` | OrangeRed | Eğik direnç çizgisi rengi |
| `InpLineWidth` | 2 | Çizgi kalınlığı (1–5) |
| `InpShowPivots` | true | Pivot noktalarını grafik üzerinde göster/gizle |
| `InpShowInfo` | true | Sol üst köşedeki bilgi panelini göster/gizle |

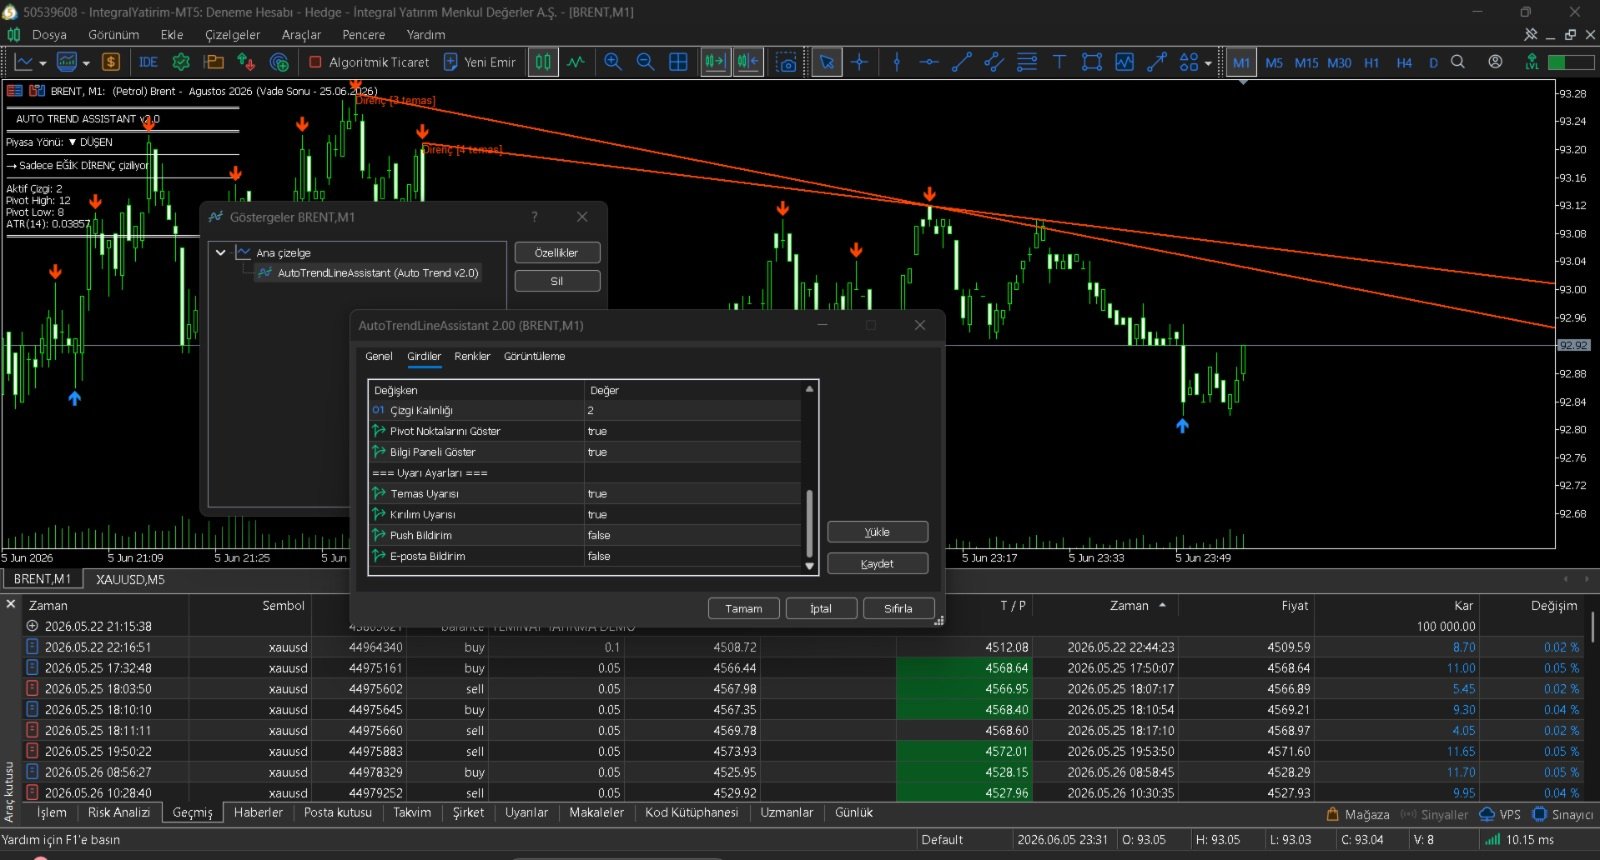
#### 🔔 Uyarı Ayarları

| Parametre | Varsayılan | Açıklama |
|---|---|---|
| `InpAlertTouch` | true | Fiyat trend çizgisine temas ettiğinde uyarı |
| `InpAlertBreak` | true | Trend çizgisi kırıldığında uyarı |
| `InpPushNotify` | false | MetaTrader mobil uygulamasına push bildirim gönder |
| `InpEmailNotify` | false | MT5 ayarlarındaki e-posta adresine bildirim gönder |

---

### Önerilen Ayarlar (Kullanım Senaryosuna Göre)

#### 📈 Scalping (M1–M5)
```
InpLeftBars     = 3
InpRightBars    = 2
InpTrendLookback = 30
InpMinTouches   = 2
InpTouchTolerance = 0.4
InpMaxTrendLines  = 2
```

#### 📊 Swing Trading (H1–H4)
```
InpLeftBars     = 5
InpRightBars    = 3
InpTrendLookback = 50
InpMinTouches   = 2
InpTouchTolerance = 0.3
InpMaxTrendLines  = 3
```

#### 📉 Pozisyon Trading (D1–W1)
```
InpLeftBars     = 8
InpRightBars    = 5
InpTrendLookback = 100
InpMinTouches   = 3
InpTouchTolerance = 0.25
InpMaxTrendLines  = 2
```

---

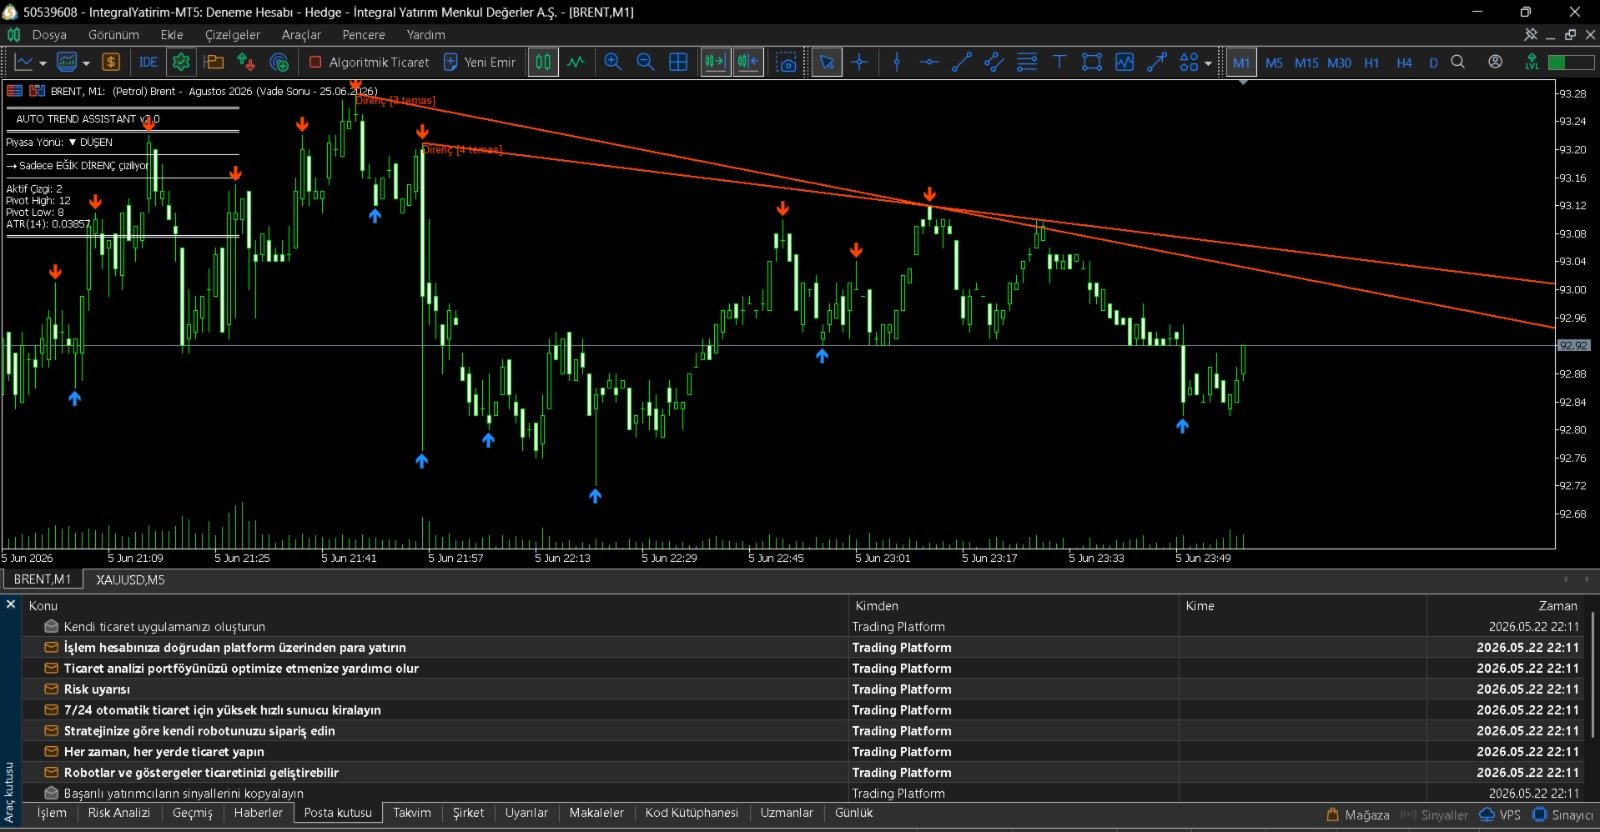
### Grafik Üzerinde Göstergeler

| Görsel Öğe | Anlamı |
|---|---|
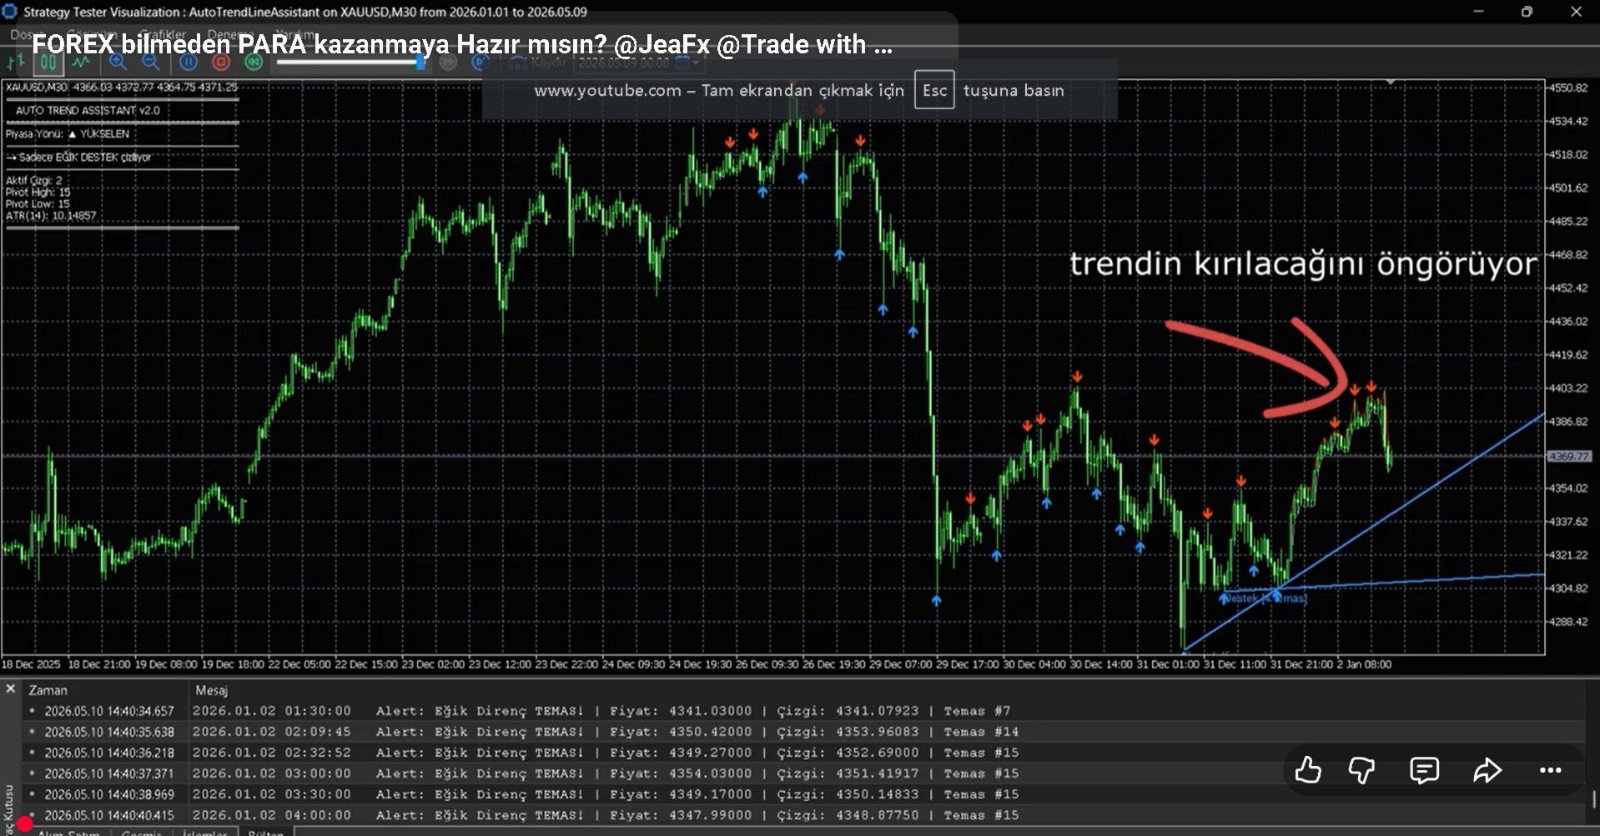
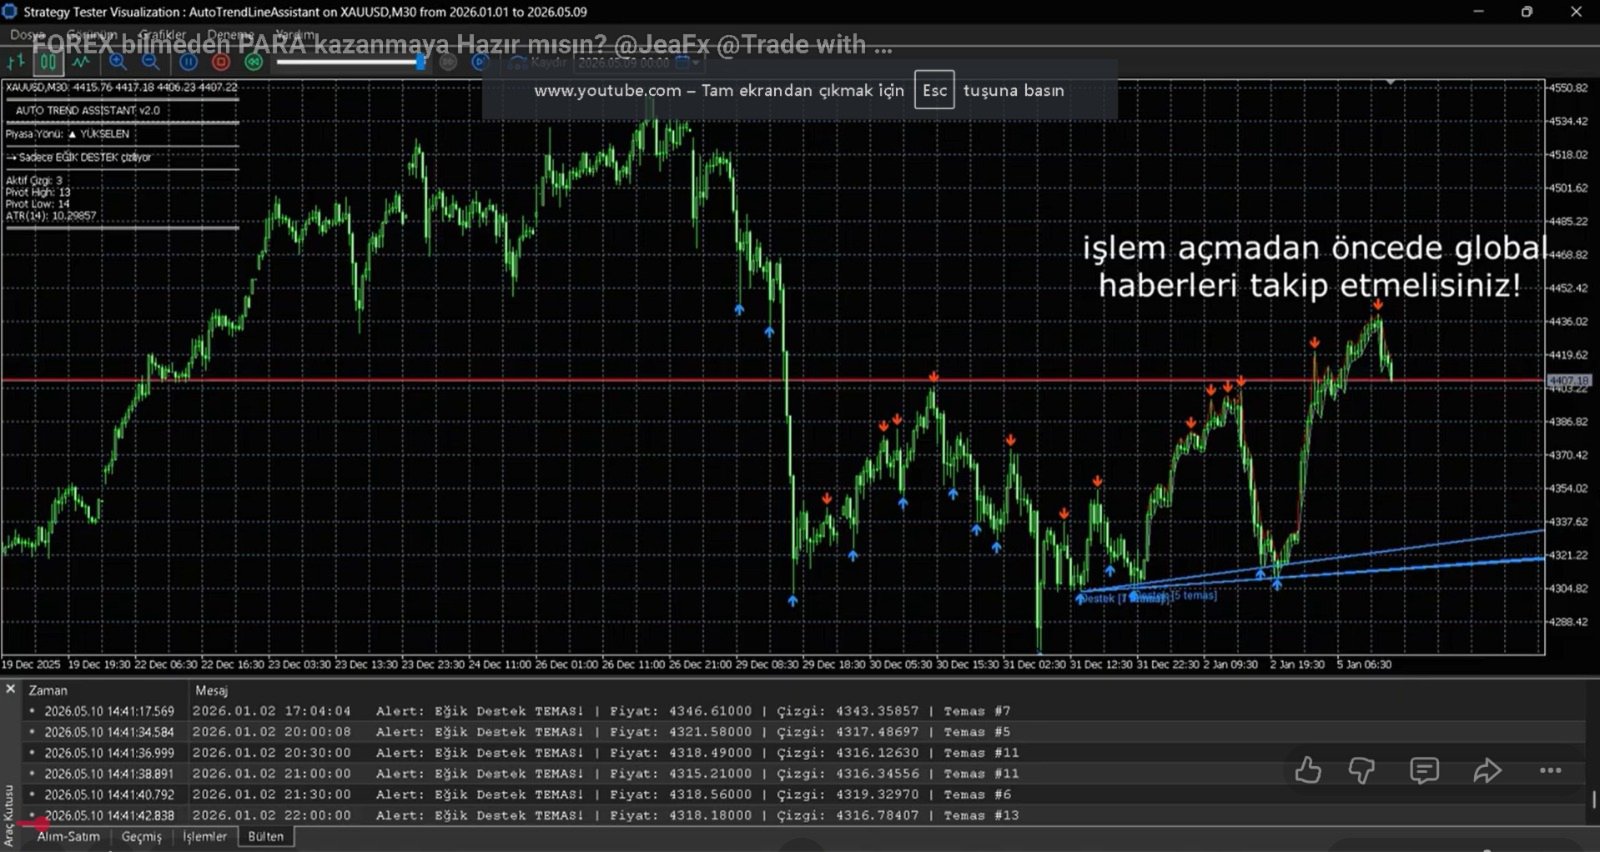
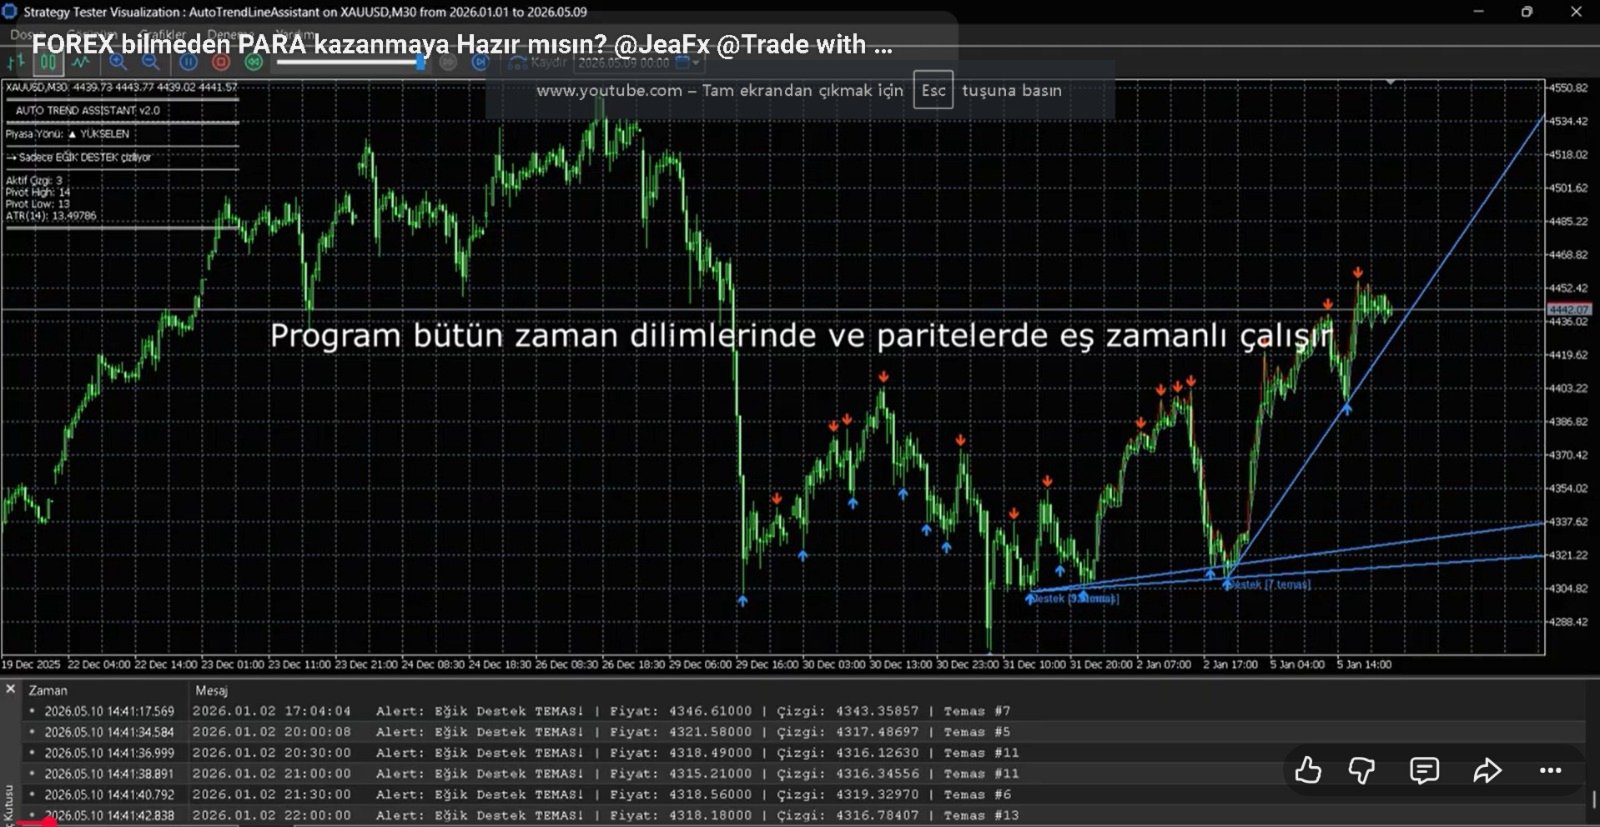
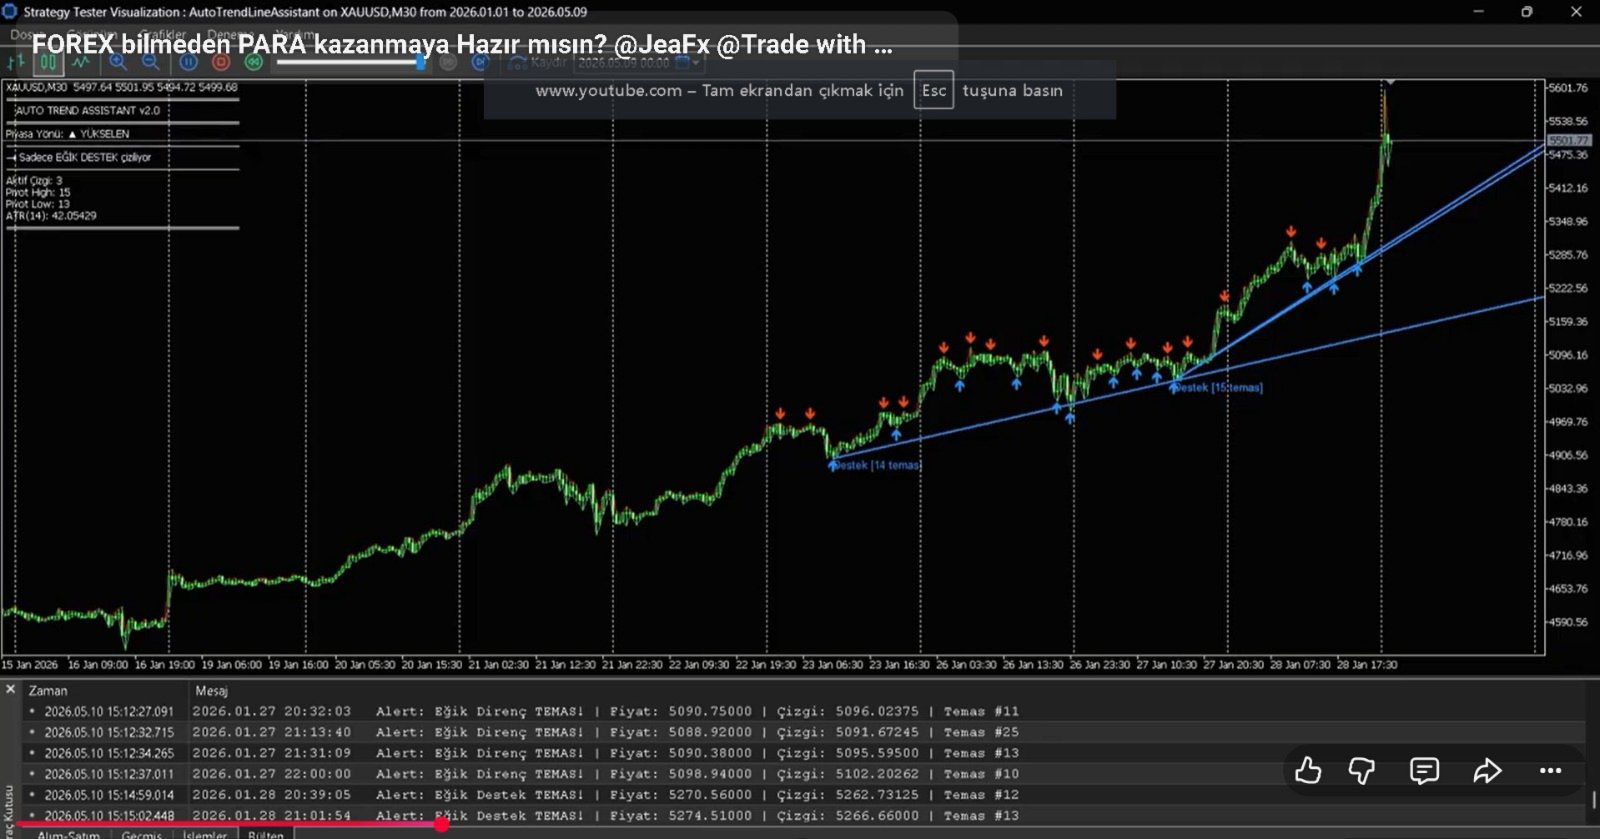
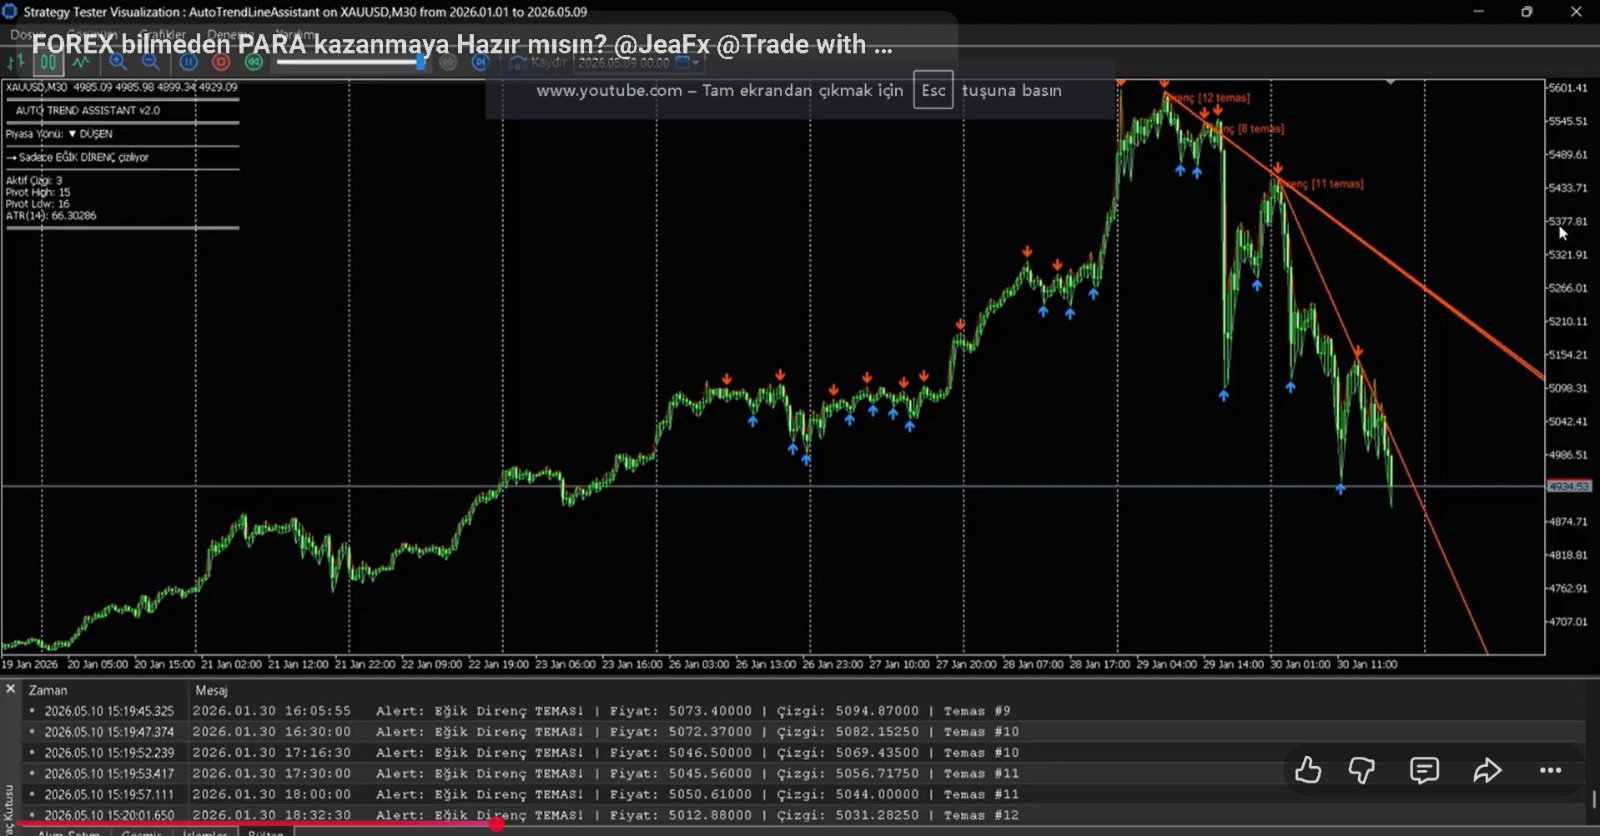
| 🔵 Mavi yukarı ok | Dip pivot noktası tespit edildi |
| 🔴 Kırmızı aşağı ok | Tepe pivot noktası tespit edildi |
| Mavi eğik çizgi | Aktif eğik destek (yükselen trendde) |
| Kırmızı eğik çizgi | Aktif eğik direnç (düşen trendde) |
| Çizgi etiketi | Çizgi tipi + temas sayısı gösterir |
| Sağ üst panel | Piyasa yönü, aktif çizgi sayısı, ATR |

---

### Uyarılar Nasıl Çalışır?

**Temas Uyarısı örneği:**
```
Eğik Destek TEMAS! | Fiyat: 1.08542 | Çizgi: 1.08510 | Temas #3
```
Bu uyarı, fiyatın destek çizgisine yaklaştığını gösterir.
→ Yükselen trendde bu, **alım fırsatı** sinyali olabilir.

**Kırılım Uyarısı örneği:**
```
Eğik Destek KIRILDI! | Fiyat: 1.08201 | Çizgi: 1.08490
```
Bu uyarı, destek çizgisinin aşağı kırıldığını gösterir.
→ **Trend dönüşü** veya **short fırsatı** sinyali olabilir.

---

### Sık Yapılan Hatalar ve Çözümleri

| Hata | Neden | Çözüm |
|---|---|---|
| Çizgi görünmüyor | Pivot bulunamadı | `InpLeftBars` ve `InpRightBars` değerlerini düşürün |
| Çok fazla çizgi var | `InpMinTouches` düşük | 3'e yükseltin |
| Yanlış trend yönü gösteriyor | `InpTrendLookback` çok kısa | Değeri artırın |
| Çok fazla uyarı geliyor | Toleranslar düşük | `InpTouchTolerance` değerini artırın |
| Kırılım uyarısı çok erken tetikleniyor | `InpBreakTolerance` düşük | 0.7–1.0 arasına yükseltin |

---

### ⚠️ Önemli Notlar

- Bu gösterge **analiz aracıdır**, tek başına alım/satım kararı vermez. Fiyat aksiyonu, hacim ve diğer analizlerle birlikte kullanın.
- Uyarılar **gecikmeli** tetiklenebilir; bar kapanışında değerlendirme yapılır.
- Push bildirimi için MetaTrader 5 hesabınızda MetaQuotes ID tanımlanmış olmalıdır.
- E-posta bildirimi için **Araçlar → Seçenekler → E-posta** menüsünden SMTP ayarları yapılmış olmalıdır.
- Gösterge, geçmiş bar verilerini kullanarak test edilebilir; ancak gerçek zamanlı performans için canlı piyasada gözlemleyin.

---

*Auto Trend Line Assistant v2.0 — Algoritmik Trend Analizi, Basit Kural, Güçlü Sonuç.*
Prodotti consigliati
Was: $249  Now: $99   Market Profile defines a number of day types that can help the trader to determine market behaviour. A key feature is the Value Area, representing the range of price action where 70% of trading took place. Understanding the Value Area can give traders valuable insight into market direction and establish the higher odds trade. It is an excellent addition to any system you may be using. Inspired by Jim Dalton’s book “Mind Over Markets”, this indicator is designed to suit the
VELOS Trading Indicator Precision. Speed. Confidence. The VELOS Trading Indicator is a professional, non-repainting MT5 trading system developed by DC Trading to help traders identify high-probability trading opportunities with confidence. Designed for both beginner and experienced traders, VELOS combines trend analysis, momentum confirmation, and volatility filtering into one intelligent indicator, delivering precise entry and exit signals while reducing false setups. Built for fast-moving m
ONNYX INDICATOR versione 1.14 Indicatore di domanda e offerta per MetaTrader 5 con segnali confermati senza repaint. Rileva swing confermati, adatta l'ampiezza delle zone tramite ATR, mostra la qualità in percentuale e disegna frecce BUY/SELL su candele chiuse. FUNZIONI PRINCIPALI - Zone di domanda e offerta con punteggio percentuale all'interno della zona. - Frecce BUY/SELL ingrandite dopo la chiusura della candela. - Filtro trend EMA e conferma opzionale del rifiuto. - Pannello con trend, live
What if you could finally SEE where the market really wants to go? Most traders watch price. Pros watch VOLUME — where the money was actually traded. Volume Profile Fibo Confluence puts that reading right in front of you, in plain language, no jargon. WHAT YOU SEE ON YOUR CHART • The POC, the most-traded price: the market's natural magnet • The value area (VAH / VAL): the "house" where price spends its time • Automatic Fibonacci retracement + the golden pocket • Low-volume nodes
Pro Gold System Indicator
PEDRO JOAQUIM GONCALVES GOMES
ADVANCED FUNCTIONALITIES: Trend Score (0-100) with visual bar Intelligent signals with adjustable strength (1-10) Risk management with automatic TP/SL Audible and visual alerts Price zones with smooth filling Multi-indicator analysis (RSI, ATR, BB, EMAs) DESIGN FEATURES Modern Visual: Smooth and well-spaced lines (EMA with 2-3px width) Vibrant and professional colors (Sky Blue, Orange, Gold) Modern arrows (code 233/234) for buy/sell signals Configurable dark/light theme Adjustable transparency f
Market Structure, Liquidity and Price Action Analysis for MetaTrader 5 A chart can contain plenty of information and still leave a trader without a clear decision. A BOS label may appear, liquidity may be nearby, and an order block may remain active, yet the real challenge is understanding how those elements relate to one another. ICT Yoshi Pro organizes that process into a cleaner, more disciplined MetaTrader 5 workflow. What ICT Yoshi Pro Does ICT Yoshi Pro is a manual decision-support indicat
La Master Edition è uno strumento analitico di livello professionale progettato per visualizzare la struttura del mercato attraverso l'obiettivo del volume e del flusso di denaro. A differenza degli indicatori di volume standard, questo strumento visualizza un Profilo di Volume Giornaliero direttamente sul tuo grafico, permettendoti di vedere esattamente dove si è verificata la scoperta dei prezzi e dove è posizionato il "denaro intelligente". Questa Master Edition è progettata per chiarezza e v
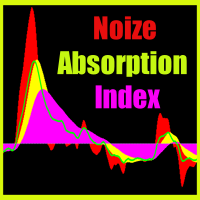
Noize Absorption Index - is the manual trading system that measures the difference of pressure between bears forces and bulls forces. Green line - is a noize free index that showing curent situation. Zero value of index shows totally choppy/flat market.Values above zero level shows how powerfull bullish wave is and values below zero measures bearish forces.Up arrow appears on bearish market when it's ready to reverse, dn arrow appears on weak bullish market, as a result of reverse expectation.
SMC Smart Flow Pro
Thitipong Nookhunthod
Short Description: SMC Smart Flow Pro is an advanced Smart Money Concept indicator that automatically detects Break of Structure (BOS), Change of Character (CHoCH), and projects precise TP/SL target levels on all timeframes — built for serious traders who trade with institutional flow. Full Description: SMC Smart Flow Pro is a premium Smart Money Concept (SMC) indicator for MetaTrader 5, engineered for traders who want to trade alongside institutional order flow. By automatically mapping m
Here   our more valuable tools SMC Trend Trading   ,  Easy SMC Trading  ,  Institutional SMC Architect Volume Analysis Tools  ,  Volume flow Profile  ,  Market volume profile  , FVG with Volume  , Liquidity Heatmap Profile  ,  Volume Spread Analysis The    Liquidity Heatmap   is a sophisticated institutional trading tool designed to reveal where over-leveraged traders are trapped. By calculating estimated liquidation levels based on volume spikes and leverage, this indicator draws a dynamic "h
Passband Filter Pro Passband Filter Pro is a trend and cycle oscillator for MetaTrader 5. It is built on the Ehlers Super Passband Filter, a band pass filter that removes long term trend drift and short term noise so that only the dominant market cycle remains. The result is a clean oscillator with a color cloud that shows overbought and oversold conditions, cycle turns, and momentum on forex, gold, indices, stocks and crypto. Most traders enter too early or too late. Simple moving averages la
Il livello Premium è un indicatore unico con una precisione superiore all'80% delle previsioni corrette! Questo indicatore è stato testato dai migliori Specialisti di Trading per più di due mesi! L'indicatore dell'autore che non troverai da nessun'altra parte! Dagli screenshot puoi vedere di persona la precisione di questo strumento! 1 è ottimo per il trading di opzioni binarie con un tempo di scadenza di 1 candela. 2 funziona su tutte le coppie di valute, azioni, materie prime, criptovalu
Volume Profile Multiple — Profili di Volume Multipli con Buffer per il Trading Algoritmico Stanco di ridisegnare il Volume Profile blocco per blocco, ricalcolando tutto ogni volta che cambi timeframe? Volume Profile Multiple traccia automaticamente più profili di volume consecutivi sul grafico, rivelando dove si è realmente concentrato l'interesse istituzionale in ogni tratto del mercato — non solo nell'ultimo intervallo visibile. Cosa fa l'indicatore per te L'indicatore suddivide lo storico dei
L'indicatore DYJ BoS identifica e contrassegna automaticamente gli elementi essenziali dei cambiamenti nella struttura del mercato, tra cui: Breakout of Structure (BoS): rilevato quando il prezzo effettua una mossa significativa, rompendo un precedente punto di struttura. Segna possibili linee di tendenza al rialzo e al ribasso (UP e DN, ovvero nuovi massimi e nuovi minimi continui) e una volta che il prezzo sfonda queste linee, segna frecce rosse (ORSO) e verdi (TORO) Il BoS si verifica sol
Structure King AI Signal Structure King AI Signal is a professional MetaTrader 5 trading indicator designed to help traders analyze market structure, trend direction, multi-timeframe confirmation and trade management from one clean dashboard. Key Features • Market Structure & Trend Analysis • BUY / SELL Signals • Multi-Timeframe (HTF) Confirmation • Entry Price Levels • Dynamic Stop Loss (SL) • TP1 / TP2 / TP3 Levels • ATR Volatility Analysis • ADX Trend Strength Filter • Adaptive Market Filter
Your Trend Friend
Luigi Nunes Labigalini
5 (1)
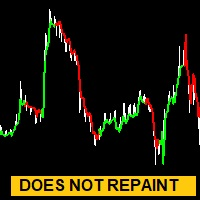
The trend is your friend! Look at the color of the indicator and trade on that direction. It does not  repaint. After each candle is closed, that's the color of the trend. You can focus on shorter faster trends or major trends, just test what's most suitable for the symbol and timeframe you trade. Simply change the "Length" parameter and the indicator will automatically adapt. You can also change the color, thickness and style of the lines. Download and give it a try! There are big movements w
DAILY OH/OL SDEV QUANT MODEL - STATISTICAL TRADING WITH PRECISION RISK MANAGEMENT TRADE WITH MATHEMATICAL CERTAINTY - KNOW YOUR EXACT STOP-LOSS AND TAKE-PROFIT BEFORE YOU ENTER This indicator analyzes 5,000+ days of price history to give you: Exact entry levels (sigma bands locked at daily open) Exact stop-loss distance (from M
WBS SMC Without Repaint – Ultimate XAUUSD Scalping Engine (M5 Timeframe) Take your Gold trading to the institutional level with "WBS SMC Without Repaint", a highly advanced premium indicator engineered specifically for XAUUSD (Gold) on the M5 (5-Minute) timeframe.  Built upon the core pillars of Smart Money Concepts (SMC) combined with precise algorithmic candle pattern recognition, this tool identifies high-probability institutional footprints in real-time. Best of all: 100% ABSOLUTELY
C88 Projected Candle See the Bigger Picture Before the Candle Closes C88 Projected Candle is a professional market visualization indicator that projects the current higher timeframe candle directly onto your active chart. It helps traders understand the evolving market structure without constantly switching between timeframes. Whether you trade Price Action, ICT, Smart Money Concepts (SMC), or Volume Profile, this indicator provides a cleaner and more intuitive way to read market context. Key Fe
Cumulative Volume Delta (CVD) MA-X: Strumento Intelligente di Sentiment per l'Order Flow Sblocca i meccanismi nascosti del mercato con il Cumulative Volume Delta (CVD) MA-X . Mentre gli indicatori di volume standard ti dicono solo quanto è stato scambiato, il CVD MA-X ti dice CHI sta vincendo la battaglia tra compratori e venditori e QUANDO . Aggregando l'azione del prezzo a livello di tick e la distribuzione del volume, questo indicatore fornisce una mappa cristallina della convinzione e dell'
Il nostro indicatore   Basic Support and Resistance   è la soluzione necessaria per aumentare l'analisi tecnica.Questo indicatore consente di proiettare i livelli di supporto e resistenza sul grafico/ MT4 gratuita Funzionalità Integrazione dei livelli di Fibonacci: Con la possibilità di visualizzare i livelli di Fibonacci insieme a livelli di supporto e resistenza, il nostro indicatore ti dà una visione ancora più profonda del comportamento del mercato e delle possibili aree di inversione. Ot
Visual CrossPulse Dynamics Indicator
AL MOOSAWI ABDULLAH JAFFER BAQER
Visual CrossPulse Dynamics: Trade with the Market's True Rhythm Unlock a new level of market insight with Visual CrossPulse Dynamics, a sophisticated trading indicator designed to adapt to ever-changing volatility and reveal the true direction of the trend. Are you tired of indicators that lag in fast-moving markets or give false signals during consolidation? The Visual CrossPulse Dynamics indicator solves this problem by using an advanced, adaptive algorithm that intelligently adjusts to the m
Multi Timeframe Smc Bias Finder Trading in alignment with higher timeframe structure is one of the most consistently profitable habits a trader can build. The difficulty has always been execution: switching between timeframes, manually reading structure, and keeping track of whether the Daily, 4-Hour and 1-Hour are all pointing in the same direction before committing to a position. Multi Timeframe Smc Bias Finder resolves that entirely. Three tools in one indicator: A live multi-timeframe bias d
SMC Indicator BOS & CHoCH analyze market structure using Smart Money Concepts The indicator combines BOS (Break of Structure), CHoCH (Change of Character), Fair Value Gaps (FVG), Liquidity Sweep logic and ATR filtering to provide a structured view of market movements and potential trading opportunities. The indicator automatically identifies swing highs and swing lows and monitors structural breaks in the market. BOS (Break of Structure) identifies potential continuation of the current market st
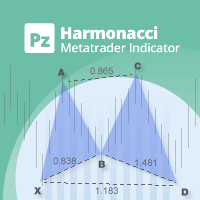
Trade smarter, not harder: Empower your trading with Harmonacci Patterns This is arguably the most complete harmonic price formation auto-recognition indicator you can find for the MetaTrader Platform. It detects 19 different patterns, takes fibonacci projections as seriously as you do, displays the Potential Reversal Zone (PRZ) and finds suitable stop-loss and take-profit levels. [ Installation Guide | Update Guide | Troubleshooting | FAQ | All Products  ] It detects 19 different harmonic pric
PatternDetector
Thien Thanh Tran
PatternScope — Multi-Pattern Recognition for MT5 PatternScope is a multi-pattern recognition indicator for MetaTrader 5. It scans price action for classic chart patterns, confirms breakouts, and draws clear   Entry, Stop Loss and Take Profit   levels. A compact dashboard shows the latest pattern, bias and Risk:Reward. Patterns:   Double Top/Bottom, Triple Top/Bottom, Head and Shoulders (and inverted), Bullish & Bearish Flag, Pennant, Rising & Falling Wedge, Triangle, Rectangle, Cup and Handle —
Pattern Recognition EA
Claudiu-georgian Zavera
Pattern Recognition EA - From Learn to Earn. The market repeats itself. This EA finds every past repeat of the current candle sequence - and lets history vote the direction. ONE SHAPE. EVERY REPEAT IN HISTORY VOTES. The last N candles on your signal timeframe form a shape. The EA scans the history you choose - a fixed number of bars or everything your broker provides - for the SAME shape, and checks what happened next, every single time. Only when enough repeats exist AND a clear majority of t
This indicator is the mql5 version of the   SSLHybrid   indicator. MT4 Version Find out more here:  https://www.mql5.com/en/users/rashedsamir/seller Description of TradingView version: This script is designed for the NNFX Method, so it is recommended for Daily charts only. Tried to implement a few VP NNFX Rules This script has a SSL / Baseline (you can choose between the SSL or MA), a secondary SSL for continiuation trades and a third SSL for exit trades. Alerts added for Baseline entries, SSL
Max Min Delta Indicator - Market Volume Imbalance Analysis Gain Deeper Insights into Market Volume Imbalance with Delta Analysis What is the Max Min Delta Indicator? The Max Min Delta Indicator is a powerful market volume analysis tool that visually represents maximum and minimum delta values using a histogram. It helps traders identify market strength, weakness, absorption, and aggressive buying/selling activity with precision. Key Features Histogram Visualization: Displays Max Delta (Green) an
Gli utenti di questo prodotto hanno anche acquistato
Trend Sniper X
Sarvarbek Abduvoxobov
4.86 (42)
Trend Sniper X è un indicatore trend-following multi-timeframe per MetaTrader 5 che aiuta i trader a identificare la direzione del trend e i potenziali punti di inversione con chiarezza e precisione. per MT4: https://www.mql5.com/en/market/product/193245 Informazioni sul prezzo: Il prezzo attuale è promozionale ed è soggetto a modifiche con il rilascio di futuri aggiornamenti e nuove funzionalità. Offerta Bonus: Per ricevere GRATIS l'Auto-Trade Assistant EA per questo indicatore, invia un messa
Smart Trend Trading System — MetaTrader 5 Dopo l'acquisto, inviami un messaggio su MQL5 per ricevere GRATUITAMENTE Smart Universal Expert Advisor, insieme al corso online, al manuale PDF e all'accesso al gruppo privato. STTS riunisce la direzione del trend, i segnali di entrata e uscita, le zone di inversione e i livelli di prezzo importanti direttamente sul grafico. Segui il sistema manualmente oppure collega un EA compatibile separato per eseguire le operazioni automaticamente con le impostazi
Zoryk Gold
Reda El Koutbane
4.78 (18)
ZORYK — Sistema avanzato di segnali XAUUSD per MetaTrader 5 Conosci sicuramente questa sensazione. Passi molto tempo ad analizzare l’oro. Aspetti il punto d’ingresso corretto. Finalmente apri l’operazione e il prezzo inizia immediatamente a muoversi contro di te. Chiudi troppo presto, sposti lo Stop Loss o esiti per alcuni secondi. Successivamente il mercato raggiunge esattamente l’obiettivo che avevi previsto inizialmente, ma senza di te nella posizione. Il problema non era sempre la direzione.
Un nuovo Re in città - Indicatore + Gestione ordini (TP1 + TP2 + TP3) + Invio opzionale di segnali Telegram INCLUSO (GRATIS) (SISTEMA COMPLETO DI TRADING e SEGNALI) Il nostro miglior EA per l’Oro: Gold Slayer Questo indicatore include una strategia avanzata, un sistema di trading con gestione ordini personalizzabile e un sistema mean reversion che combina estensioni di envelope, supportato da molteplici filtri intelligenti di conferma come RSI per individuare ingressi di inversione ad alta proba
M5 Sniper
MeanFX
5 (3)
Porta il tuo vantaggio nel trading sotto i riflettori! M5 Sniper è un nuovo indicatore di MeanFX. Combina segnali di trading precisi con livelli TP/SL adattivi , creando così le migliori operazioni statistiche possibili! Il prezzo aumenta ogni 5 acquisti, il prossimo prezzo è di 69$ Scrivimi dopo l'acquisto per ricevere consigli/guida e un EA bonus Cosa lo rende diverso? Performance statistica comprovata su Gold XAUUSD ( funziona su quasi ogni asset , concentrandosi sulla padronanza di un singol
SMC Intraday Formula
VividMind Digital Solutions
5 (26)
Cominciamo con la verità. Nessun indicatore da solo ti renderà profittevole. Se qualcuno ti dice il contrario, ti sta vendendo un sogno. Qualsiasi indicatore che mostra frecce perfette di acquisto/vendita può essere reso impeccabile — basta ingrandire la giusta sezione della storia e catturare solo i trade vincenti. Noi non lo facciamo.  SMC Intraday Formula è uno strumento. Legge la struttura del mercato per te, identifica le zone a più alta probabilità e ti mostra esattamente come appare la t
SuperScalp Pro
Van Minh Nguyen
4.54 (37)
SuperScalp Pro - Professional Multi-Layer Confluence Scalping System SuperScalp Pro è un indicatore di scalping avanzato che potenzia il Supertrend classico con diversi filtri intelligenti di conferma. Aiuta a individuare opportunità di trading Buy/Sell con una maggiore probabilità di successo, riducendo significativamente i falsi segnali. Le frecce Buy e Sell vengono visualizzate chiaramente direttamente sul grafico, insieme ai livelli di Stop Loss e Take Profit basati sull’ATR, calcolati autom
Auto Optimized SpeedAngle è un sistema di vettorizzazione del momento di livello istituzionale che elimina l'overfitting ( curve-fitting ) attraverso l'ottimizzazione continua Walk-Forward (WFO). Invece di affidarsi a input statici che si degradano quando i regimi di mercato cambiano, l'indicatore recalibra dinamicamente i suoi parametri utilizzando la validazione Out-of-Sample (OOS), assicurando che i segnali visualizzati rappresentino reali vantaggi statistici anziché anomalie storiche. Quadro
Boba Analysis Suite
Trade Ready Solutions LLC
5 (1)
Boba Analysis Suite Boba Analysis Suite è un indicatore di analisi per MetaTrader 5. Riunisce la struttura del mercato, le zone di prezzo rilevanti e il contesto generale del mercato in un’unica visualizzazione del grafico. Sviluppato sulla base dell’esperienza pratica come trader e formatore di trading, supporta un processo di analisi strutturato: valutare la direzione del mercato, individuare livelli importanti e analizzare congiuntamente più intervalli temporali. Analisi nel contesto del merc
GoldenX Entry MT5
VividMind Digital Solutions
5 (17)
GoldenX Entry è un indicatore per MT5 con un algoritmo adattivo Smart Entry Trend, un sistema di scoring dei segnali, un rilevatore del regime di mercato e un filtro di volatilità. Ogni segnale include un livello di ingresso calcolato, tre livelli di Take-Profit (TP1, TP2, TP3) e un livello di Stop-Loss. È costruito su più livelli analitici progettati per adattarsi a diverse condizioni di mercato, combinando un sistema analitico multilivello con un ottimizzatore integrato e un sistema di traccia
La leggenda ritorna: Entry Points Pro 10. Il rilancio del leggendario indicatore che per 3 anni è rimasto nella Top-3 del MQL5 Market. Centinaia di recensioni entusiaste (589 su due versioni), migliaia di trader lo usano ogni giorno per operare, 31.000+ download della demo   MT4+MT5 . Ho letto ogni vostra recensione degli ultimi cinque anni — e invece di promesse ho inserito nella versione 10 le risposte. Dall'autore che opera sui mercati dal 1999 e tiene all'onestà, alla propria reputazione e a
Adaptive Price Action Engine Acquista un indicatore, ricevi l'EA gratis Analisi Auto-Ottimizzata del Trend e dei Pattern Candlestick Multi-Timeframe I mercati cambiano continuamente e non tutti i pattern di Price Action hanno lo stesso valore in ogni condizione di mercato. Adaptive Price Action Engine è progettato per adattarsi alle condizioni di mercato in continua evoluzione, combinando struttura del trend, analisi Multi-Timeframe, pattern Candlestick e ottimizzazione statistica in un unico fr
ARIPoint
Temirlan Kdyrkhan
1 (4)
ARIPoint is a powerful trading companion designed to generate high-probability entry signals with dynamic TP/SL/DP levels based on volatility. Built-in performance tracking shows win/loss stats, PP1/PP2 hits, and success rates all updated live. Key Features: Buy/Sell signals with adaptive volatility bands Real-time TP/SL/DP levels based on ATR Built-in MA Filter with optional ATR/StdDev volatility Performance stats panel (Success, Profit/Loss, PP1/PP2) Alerts via popup, sound, push, or email Cu
Gann Made Easy è un sistema di trading Forex professionale e facile da usare che si basa sui migliori principi del trading utilizzando la teoria di mr. WD Gann. L'indicatore fornisce segnali ACQUISTA e VENDI accurati, inclusi i livelli di Stop Loss e Take Profit. Puoi fare trading anche in movimento utilizzando le notifiche PUSH. CONTATTAMI DOPO L'ACQUISTO PER RICEVERE GRATUITAMENTE LE ISTRUZIONI DI TRADING E OTTIMI INDICATORI EXTRA! Probabilmente hai già sentito parlare molte volte dei metodi d
M1 Sniper MT5
Oleg Rodin
5 (7)
M1 SNIPER   è un sistema di indicatori di trading facile da usare. Si tratta di un indicatore a freccia progettato per l'intervallo temporale M1. L'indicatore può essere utilizzato come sistema autonomo per lo scalping sull'intervallo temporale M1 e come parte del tuo sistema di trading esistente. Sebbene questo sistema di trading sia stato progettato specificamente per il trading sull'intervallo temporale M1, può comunque essere utilizzato anche con altri intervalli temporali. Inizialmente ho p
FiboSniper Pro
Van Minh Nguyen
5 (4)
FiboSniper Pro – Multi-Filter Fibonacci System with Auto SL/TP and Control Panel FiboSniper Pro è un indicatore tecnico che combina Fibonacci Envelopes dinamici con diversi filtri di conferma per generare segnali Buy e Sell selezionati. I livelli di Fibonacci vengono calcolati sulla base di Moving Average e ATR e successivamente filtrati tramite ADX, EMA, RSI, ATR, Volume, Time e struttura delle candele. L’indicatore visualizza direttamente sul grafico i livelli automatici di Stop Loss e Take Pr
Get Ready for Major New Features in Our Next Update — Version 2.52 Coming Soon! [NEW]  We’re taking market analysis to the next level with 4   new features designed to meet your trading needs. Introducing: TRADE OVERVIEW DASHBOARD  CONFLUENCE AT ZONE  OTE   Strong & Weak High/Low  1. TRADE OVERVIEW DASHBOARD A dashboard that helps you see the overall market picture more easily, with key information from multiple timeframes and trading guidance to support your trading decisions, helping you an
Break and Retest Hunter
Mohamed Hassan
3.67 (3)
Break and Retest Hunter is a powerful MetaTrader 5 indicator designed to automatically identify support and resistance levels, breakout structures, and potential retest opportunities in real time. Bonus Indicator: After purchasing Break and Retest Hunter , contact me to receive Trade Indicator Assistant EA completely free as a bonus utility. $65 for the next 10 copies . Next price is $120.  Combining adaptive market analysis, clear BUY/SELL signals, Fibonacci-based profit targets, and a premiu
Apex Patterns PRO Acquista l'indicatore - Ottieni GRATUITAMENTE l'Expert Advisor basato su di esso. Intelligenza auto-ottimizzante per pattern grafici e breakout Gli scanner di pattern tradizionali si basano su input fissi, registrando spesso prestazioni inferiori quando la volatilità e le strutture del mercato cambiano. Apex Patterns PRO è progettato per adattarsi alle mutevoli condizioni di mercato combinando il riconoscimento dei pattern grafici strutturali, il filtraggio del momentum e l'au
Gold Trend Coach MT5
Cristhian Alexander Gaibor Cuasquer
5 (2)
Gold Trend Coach è un indicatore di trend per l'oro (XAUUSD) su MetaTrader 5 con segnali di acquisto e vendita, stop loss e tre obiettivi di take profit, confermati alla chiusura della candela, una dashboard coach multi-timeframe e avvisi sul tuo telefono e su Telegram. Costruito per lo scalping su M5 e l'intraday su M15 durante le sessioni di Londra e New York. Gold Trend Coach: segnali di trend sull'oro XAUUSD con ingresso, stop e tre obiettivi. Prezzo di lancio $39 per le prime 20 copie, poi
Neuro Poseidon MT5
Daria Rezueva
4.75 (52)
Neuro Poseidon is a new indicator by Daria Rezueva. It combines precise trading signals with adaptive TP/SL levels - creating best possible trades as a result! Message me and get  Neuro Poseidon Assistant  as a gift to automize your trading process! What makes it stand out? 1. Proven profitability on all assets and timeframes 2. Only confirmed BUY and SELL signals present on the chart 3. Adaptive TP & SL levels generated by the software for each trade 4. Easy to understand - suitable for al
Trend Catcher ind mt5
Ramil Minniakhmetov
5 (18)
INDICATORE TREND CATCHER L'indicatore Trend Catcher analizza i movimenti dei prezzi di mercato, utilizzando una combinazione di indicatori di analisi del trend proprietari dell'autore e personalizzati. Identifica la vera direzione del mercato filtrando il rumore a breve termine e concentrandosi sulla forza del momentum sottostante, sull'espansione della volatilità e sul comportamento della struttura dei prezzi. Utilizza inoltre una combinazione di indicatori personalizzati di smoothing e filtr
Unix Scalper
Issam Kassas
4 (4)
Unix Scalper — MetaTrader 5 Dopo l'acquisto, inviami un messaggio su MQL5 per ricevere GRATUITAMENTE Smart Universal Expert Advisor, insieme al corso online, al manuale PDF e all'accesso al gruppo privato. Individua il setup. Esamina il piano. Scegli come operare. UNIX Scalper riunisce analisi di mercato, indicazioni BUY/SELL/WAIT e livelli Entry, Stop Loss, TP1 e TP2 in un unico pannello organizzato. VISUALIZZA IL SEGNALE E IL PIANO • Indicazioni chiare: BUY, SELL o WAIT. • Livelli definiti: E
Advanced Supply Demand MT5
Bernhard Schweigert
4.53 (15)
La migliore soluzione per qualsiasi principiante o trader esperto! Questo indicatore è uno strumento di trading unico, di alta qualità e conveniente perché abbiamo incorporato una serie di funzionalità proprietarie e una nuova formula. Con questo aggiornamento, sarai in grado di mostrare fusi orari doppi. Non solo potrai mostrare una TF più alta, ma anche entrambe, la TF del grafico, PIÙ la TF più alta: SHOWING NESTED ZONES. Tutti i trader di domanda di offerta lo adoreranno. :) Informazioni imp
FX Trend MT5 NG
Daniel Stein
5 (6)
FX Trend NG: La Nuova Generazione di Intelligenza di Trend Multi-Mercato Panoramica FX Trend NG è uno strumento professionale di analisi del trend multi-timeframe e monitoraggio dei mercati. Ti consente di comprendere la struttura completa del mercato in pochi secondi. Invece di passare tra numerosi grafici, puoi identificare immediatamente quali strumenti sono in trend, dove il momentum sta diminuendo e dove esiste un forte allineamento tra i timeframe. Offerta di Lancio – Ottieni FX Trend NG
Presentazione       Quantum Breakout PRO   , l'innovativo indicatore MQL5 che sta trasformando il modo in cui scambi le zone di breakout! Sviluppato da un team di trader esperti con un'esperienza di trading di oltre 13 anni,       Quantum Breakout PRO       è progettato per spingere il tuo viaggio di trading a nuovi livelli con la sua strategia innovativa e dinamica della zona di breakout. Quantum Breakout Indicator ti fornirà frecce di segnalazione sulle zone di breakout con 5 zone target di
Scalper Vault è un sistema di trading potente e completo, progettato per i trader che desiderano ottenere risultati costanti nel trading intraday. Questo indicatore ad alta precisione funge da sistema di trading autonomo, offrendo analisi di livello istituzionale sia per il mercato Forex che per le Opzioni Binarie. CONTATTAMI DOPO L'ACQUISTO PER RICEVERE I MIEI CONSIGLI DI TRADING E UN FANTASTICO BONUS! Eliminando le congetture e le complesse analisi manuali, Scalper Vault ti permette di concen
Volatility Master for MetaTrader is a real-time dashboard tool that scans up to  50 symbols  to identify high-volatility , trending markets instantly. With bullish/bearish signals, customizable alerts, and a user-friendly interface, it helps you avoid range-bound conditions and focus on high-probability trades. Clarity leads to confidence. Trade confidently and protect your capital effectively with this powerful dashboard. We don't offer free or bonus indicators in exchange of reviews from you.
Smart Price Action Concepts — MetaTrader 5 Dopo l'acquisto, inviami un messaggio su MQL5 per ricevere GRATUITAMENTE Smart Universal Expert Advisor, insieme al corso online, al manuale PDF e all'accesso al gruppo privato. Osserva la struttura. Identifica le zone. Costruisci il tuo piano di trading. Riunisci Smart Money Concepts (SMC), analisi in stile ICT e azione del prezzo in un grafico organizzato. Identifica la struttura del mercato, gli order block, i livelli di riferimento della liquidità e
SR Liquidity   è un indicatore di trading progettato per individuare le zone nascoste in cui si concentra la liquidità di mercato e dove il prezzo reagisce con maggiore intensità. Queste aree di liquidità agiscono come potenti livelli di supporto e resistenza, offrendo una mappa chiara dei punti in cui è più probabile che il mercato inverta la propria direzione. Invece di tracciare le classiche linee di supporto e resistenza, SR Liquidity analizza l'effettivo comportamento dei prezzi per individ
Altri dall’autore
️ **This document and indicator do not constitute investment advice. Past performance is no guarantee of future results.** 1. Product Introduction **ATR Fibonacci Trend Envelopes** combines three proven concepts into a single tool: * **Volatility-sensitive trend engine** — Dynamic bands that expand and contract with the ATR around a selectable moving average baseline (SMA/EMA/WMA/HMA/RMA). If the price breaks above the upper band on a candle close, a **BULL** regime begins; if it breaks bel

Filtro:
Nessuna recensione
Rispondi alla recensione