Volume Truth Accumulation Distribution
- Indicadores
- Versão: 1.1
- Atualizado: 2 junho 2026

Price tells a story, but volume tells the truth.
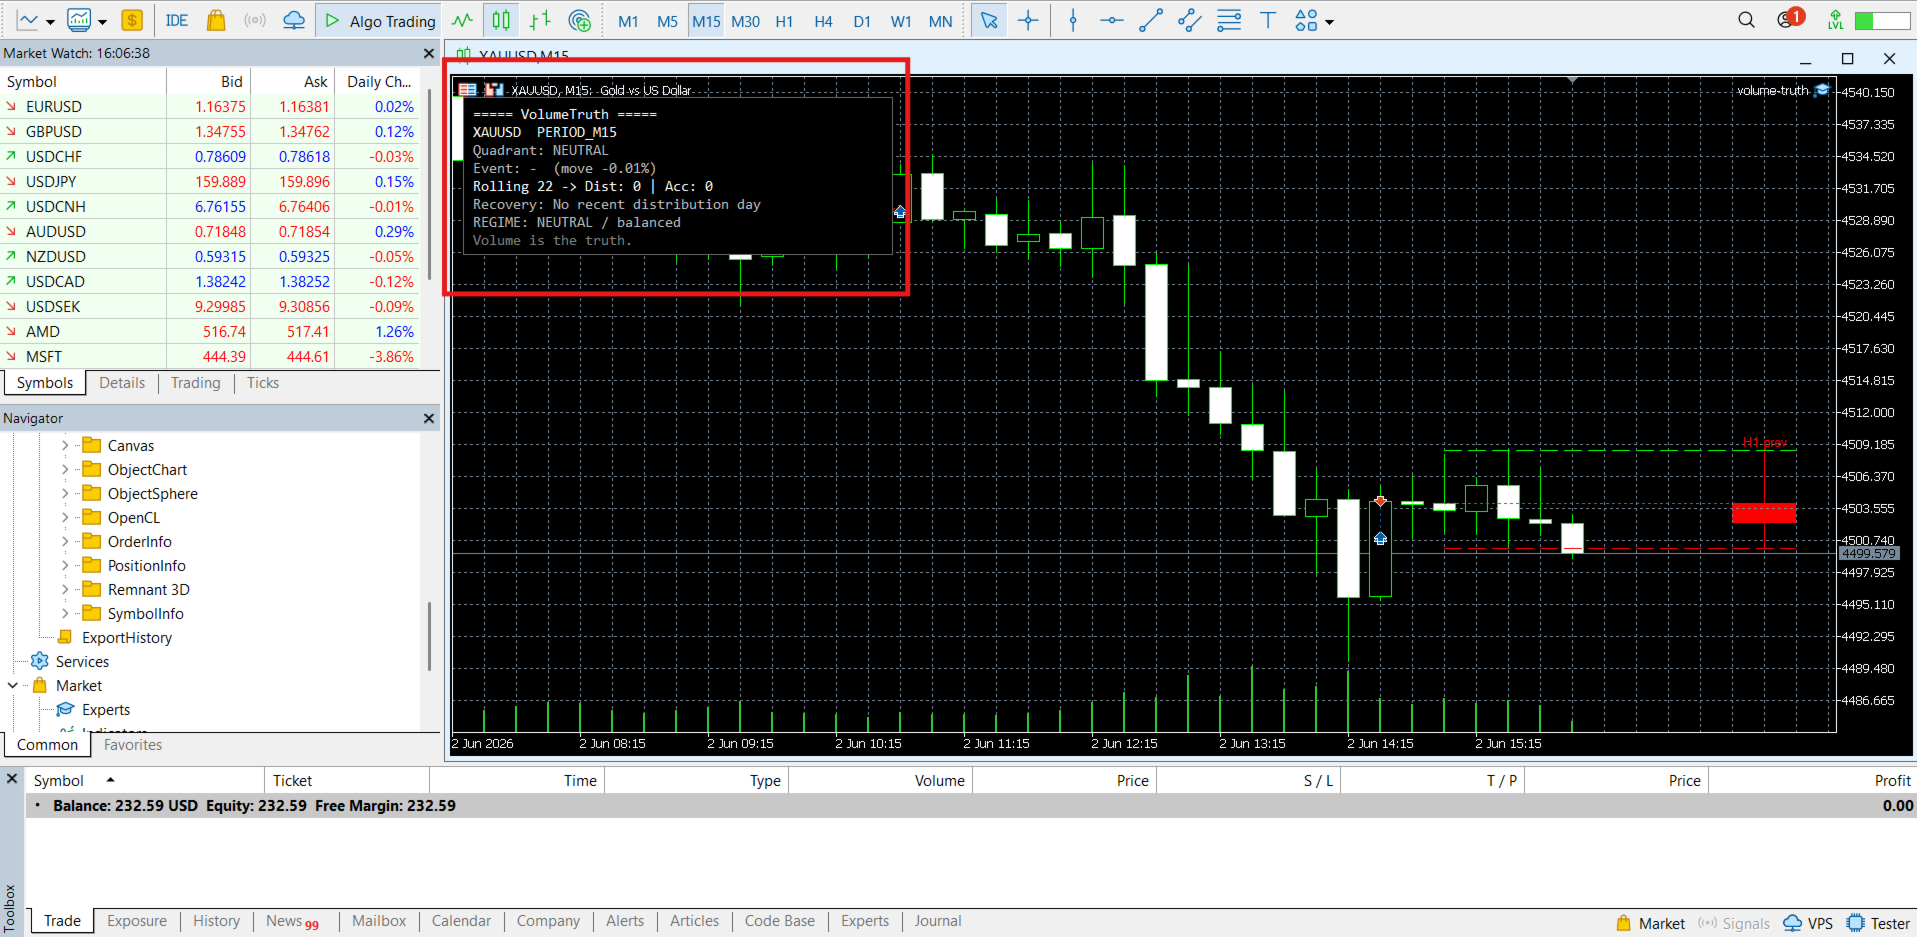
Volume Truth is a visual analysis tool that reads the relationship between price and volume to reveal what institutions are doing behind the move — accumulating, distributing, or stepping aside. It does not just plot volume bars; it interprets them.
[b]The four price/volume states[/b]
- Price up + volume up = institutional accumulation (bullish conviction)
- Price up + volume down = weak rally, no conviction, prone to reverse
- Price down + volume up = institutional distribution (bearish pressure)
- Price down + volume down = sellers exhausted, a bottoming condition
[b]Distribution & accumulation day tracking[/b] The indicator flags distribution days (a notable drop on above-average volume) and accumulation days (the mirror image), then keeps a rolling monthly tally of each. One or two distribution days is normal. Four or five is institutional selling. When distribution days consistently outnumber accumulation days, the regime turns DEFENSIVE; when accumulation leads, it turns AGGRESSIVE — shown clearly on the dashboard.
[b]Recovery watch[/b] After a distribution day, the tool watches the follow-through: a quick recovery means the selling was minor, while a market that keeps struggling warns that more distribution is likely coming.
[b]Higher-timeframe candle projection[/b] The previous higher-timeframe candle is drawn to the right of your chart (15m shows the 1H candle, 1H shows the 4H, and so on automatically), with high/low lines boxing current price and a connector back to the candle's open. See the bigger picture without switching charts.
[b]On-chart dashboard[/b] A clean panel summarizes the current quadrant, the latest day event, the rolling distribution-vs-accumulation count, the recovery status, and the overall regime — color-coded at a glance. Optional alerts fire on regime changes and qualifying days.
[b]Features[/b]
- Works on any symbol and any timeframe
- Auto or manual higher-timeframe selection
- Fully adjustable thresholds (move %, volume multiplier, lookback)
- Non-intrusive: pure visual tool, places no trades
- Lightweight and clean
[b]Notes[/b] On Forex and metals, MetaTrader provides tick volume, which the indicator uses as a proxy for activity; on instruments that report real volume you can switch to it in the inputs. This is an analysis tool, not a signal-to-buy; always combine it with your own risk management.
Free to use. Feedback and reviews are appreciated and help guide future updates.