SCM Super Color Macd

SCM Color Indicator Pro

ENGLISH SALES COPY

Stop Guessing. Stop Drawing Supply & Demand Zones That May Never Work.

How many times have you marked a Demand Zone, waited for price to react, and watched it fail?

How many hours have you spent analyzing Support, Resistance, Supply, Demand, Trendlines, and still missed the move?

What if trading could be much simpler?

SCM Color Indicator Pro eliminates much of the uncertainty by combining:

✅ Dynamic Overbought & Oversold Levels
✅ CCI + EMA Signal Confirmation
✅ Hidden Divergence Detection
✅ Zero-Cross Momentum Signals
✅ Multi-Timeframe Analysis
✅ Visual Buy & Sell Confirmation

The Dynamic Overbought/Oversold Advantage

Most MACD indicators use fixed levels.

Markets are not fixed.

Volatility changes every day.

That's why fixed overbought and oversold levels often fail.

SCM uses Dynamic Levels

The indicator automatically adapts to current market conditions.

The result:

✔ Fewer false signals
✔ Better timing
✔ More reliable entries
✔ Easier decision-making

The Simple Trading Method

No complicated market structure.

No guessing.

No endless chart analysis.

Step 1

Place SCM Color Indicator on multiple timeframes.

Step 2

Wait for the oscillator to reach Dynamic Overbought or Dynamic Oversold zones.

Step 3

Wait for Buy or Sell confirmation.

Step 4

Take the trade.

That's it.

Simple.

Clear.

Repeatable.

Designed For Real Traders

Whether you trade:

  • Gold (XAUUSD)
  • EURUSD
  • GBPUSD
  • BTCUSD
  • NASDAQ
  • Indices

SCM helps identify high-probability reversal and continuation opportunities.

Key Features

🔥 Dynamic Overbought / Oversold System

🔥 CCI + EMA Signal Line

🔥 Hidden Divergence Detection

🔥 Signal Line Divergence

🔥 Strong Confluence Alerts

🔥 Zero Cross Entry Signals

🔥 Multi-Timeframe Support

🔥 EA Integration via Global Variables

🔥 MT5 Compatible

Why Traders Love SCM

Instead of asking:

❌ Is this demand zone valid?

❌ Will supply hold?

❌ Is resistance strong enough?

❌ Is support broken?

You simply wait for:

✔ Dynamic Extreme Zone

✔ Confirmation Signal

✔ Trade

Trading becomes faster, cleaner, and more objective.

ภาษาไทย

เลิกนั่งลุ้นว่า Supply & Demand จะใช้ได้หรือไม่ได้

คุณเคยไหม?

ตี Demand Zone แล้วราคาทะลุ

ตี Supply Zone แล้วราคาไม่กลับตัว

วาด Support Resistance เต็มจอ

แต่สุดท้ายก็ยังไม่รู้ว่าควร Buy หรือ Sell

ถึงเวลาเทรดแบบง่ายกว่าเดิม

SCM Color Indicator Pro

ถูกออกแบบมาเพื่อช่วยให้การตัดสินใจง่ายขึ้น

ไม่ต้องวิเคราะห์ซับซ้อน

ไม่ต้องเดา

ไม่ต้องลุ้น

Dynamic Overbought / Oversold

หาไม่ได้ง่ายๆ ในอินดิเคเตอร์ทั่วไป

โดยเฉพาะ MACD ส่วนใหญ่ในตลาด

ใช้ระดับ Overbought Oversold แบบคงที่

แต่ตลาดจริงไม่เคยคงที่

ความผันผวนเปลี่ยนตลอดเวลา

SCM จึงใช้ระบบ

Dynamic Overbought & Oversold

ที่ปรับตัวตามสภาพตลาดอัตโนมัติ

ทำให้

✅ สัญญาณแม่นยำขึ้น

✅ ลดสัญญาณหลอก

✅ เข้าออเดอร์ได้ง่ายขึ้น

✅ ใช้งานได้จริงในตลาดจริง

วิธีใช้งานง่ายมาก

1. เปิด SCM Color Indicator

วางไว้บน Timeframe ที่ต้องการ

เช่น

M5

M15

H1

H4

D1

2. รอให้ Oscillator เข้าเขต

Dynamic Overbought

หรือ

Dynamic Oversold

3. รอสัญญาณ Buy หรือ Sell

จากระบบ

4. เข้าออเดอร์

จบ

ไม่ต้องตี Supply

ไม่ต้องตี Demand

ไม่ต้องลากเส้นเต็มจอ

ไม่ต้องเดาว่าโซนนี้ยังใช้ได้หรือไม่

จุดเด่นของ SCM Color Indicator Pro

🔥 Dynamic Overbought / Oversold

🔥 CCI + EMA Signal Line

🔥 Hidden Divergence Detection

🔥 Signal Divergence

🔥 Strong Confluence Signal

🔥 Zero Cross Entry Signal

🔥 Multi Timeframe

🔥 รองรับ EA ผ่าน Global Variables

🔥 ใช้งานบน MT5

เหมาะสำหรับ

✅ Gold (XAUUSD)

✅ EURUSD

✅ GBPUSD

✅ BTCUSD

✅ NASDAQ

✅ US30

✅ Indices ทุกประเภท

แนวคิดหลัก

แทนที่จะถามตัวเองว่า

❌ Supply นี้ยังใช้ได้ไหม

❌ Demand นี้ยังแข็งแรงไหม

❌ Support จะรับอยู่ไหม

❌ Resistance จะเอาอยู่ไหม

ให้รอเพียง

✅ Dynamic Overbought / Oversold

✅ Confirmation Signal

✅ Buy หรือ Sell

เพียงเท่านี้ก็สามารถเทรดได้อย่างเป็นระบบ ชัดเจน และลดอารมณ์ในการตัดสินใจได้อย่างมาก

SCM Color Indicator Pro

"Stop Guessing. Start Trading With Confirmation."

SCM Color Indicator Pro

"เลิกเดา รอสัญญาณ แล้วค่อยเทรด" 🚀📈


Produtos recomendados
This indicator, named Edyx_Candle_Size, is designed to be used with the MetaTrader 5 trading platform. It displays the size of the candlestick body for the current timeframe as a histogram. The indicator does not provide any specific trading signals or recommendations Measures the size of of the candlestick. That is the difference between the open and close as the case may be for either a bullish or a bearish candle. This can be use to filter out entry position as to maximise profit and minimis
Fractal Pattern Reader
Ragil Atwindra Syamsudin
Fractal Pattern Reader is an advanced multi-timeframe indicator that detects fractal alignments, divergences, and confluence zones across 5 timeframes simultaneously. It automatically calculates Entry, SL, and TP levels to spot high-probability setups. Key Features Multi-Timeframe Tracking: Simultaneously analyzes 5 distinct timeframes: Higher Timeframe 1 (Main Bias), Higher Timeframe 2 (Trend Confirmation), MTF (Supply/Demand Zone), and two Lower Timeframes (Trigger and Execution) . Smart Patt
RSI Divergence Risk Target Signals RSI Divergence Risk Target Signals is a MetaTrader 5 indicator that detects confirmed bullish and bearish RSI divergence and combines the signals with optional trend filters, ATR-based Stop Loss levels, three Take Profit targets, alerts and an internal trade statistics dashboard. The indicator compares confirmed RSI pivot structure with corresponding price highs and lows. It is designed to help traders identify momentum divergence while providing a structure
N/B:  All our product purchase comes with our free ‘’DAILY  SCALPER EA’’ Whatsapp Developer for yours after successful purchase TREND TARGET PREMIUM: Institutional Signal Engine - Now Available to Retail Traders For 20 years, hedge funds paid $25,000/month for this technology. Today, you can own it for $297. THE PROBLEM EVERY TRADER FACES: You stare at charts. Indicators conflict. News contradicts. You enter, get stopped out. You wait, miss the move. You chase, get trapped. The market alway
The   Supply and Demand Zones indicator   is one of the best tools we have ever made. This great tool automatically draws supply and demand zones, the best places for opening and closing positions. It has many advanced features such as multi timeframe zones support, displaying the width of zones, alert notifications for retouched zones, and much more. Because of market fractality, this indicator can be used for any kind of trading. Whether you are a positional, swing, or intraday trader does no
Delta Msnr Flex
Dely Ange Alex Dely
DELTA MSNR FLEX Intelligent MSNR Structure Analysis & Key Level Detection — MetaTrader 5 DELTA MSNR FLEX is a professional indicator designed to analyze price structure and identify important MSNR levels directly on the MetaTrader 5 chart. Its objective is simple: transform significant market reactions into clearly identifiable levels, helping traders improve their market analysis and decision-making process. AUTOMATIC & MANUAL DETECTION DELTA MSNR FLEX provides a flexible approach to market
Dashboard delle tendenze MTF — Heiken Ashi + ADX, 4 intervalli temporali in sintesi Visualizza la direzione e la forza del trend su 4 intervalli temporali contemporaneamente, senza dover cambiare grafico. MTF Trend Dashboard legge il trend Heiken Ashi (confermato da candele OHLC reali) e la forza ADX per ogni intervallo temporale selezionato e li visualizza in un pannello a colori chiaro e sincronizzato con le barre, aggiornato in tempo reale, non solo in corrispondenza delle nuove candele. Car
Introduction to X3 Chart Pattern Scanner X3 Cherart Pattern Scanner is the non-repainting and non-lagging indicator detecting X3 chart patterns including Harmonic pattern, Elliott Wave pattern, X3 patterns, and Japanese Candlestick patterns. Historical patterns match with signal patterns. Hence, you can readily develop the solid trading strategy in your chart. More importantly, this superb pattern scanner can detect the optimal pattern of its kind. In addition, you can switch on and off individu
All Harmonics 26
Alexey Isavnin
3.5 (4)
Harmonic patterns are characteristic series of price movements with respect to Fibonacci levels, which statistically precede price reversals. This indicator searches for harmonic patterns. It is capable of recognising 26 classical and non-classical harmonic patterns : Classical Gartley Butterfly Alternate Butterfly Bat Alternate Bat Crab Deep Crab Three Drives Non-classical Shark Alternate Shark Cypher 5-0 Anti Gartley Anti Butterfly Anti Alternate Butterfly Anti Bat Anti Alternate Bat Anti Crab
E2C Lines
Eduardo Cristian De Carvalho
Descubra o poder do nosso indicador de alta precisão, projetado para identificar as regiões de alvo e exaustão de qualquer ativo. Testado e validado por mais de 3 anos nos mercados de mini dólar e mini índice, ele oferece confiabilidade e eficácia incomparáveis. Transforme sua estratégia de trading e alcance novos patamares de sucesso com nossa ferramenta inovadora.
Supply and Demand Monster
Tsog Erdene Borjigon Enkhkhudulmur
Supply and demand zones are at the heart of   supply and demand trading . These zones are areas that show  liquidity at a specific price.  The supply zone is also called the distribution zone, while the demand zone is called the accumulation zone.   Our indicator automatically draw supply and demand zones in Metatrader 5. It give opportunity to understand trading zone and avoiding risk.
" Blow It Up!" - The Trading Indicator That Questions Your Life Choices Tired of boring indicators? Meet your new market companion that delivers: "YOLO BUY!" arrows when you should probably panic Explosive rectangle confetti (because why not?) 200+ soul-crushing quotes like "Your stop loss is imaginary" and "This is n't trading, it's donating to whales" Random alerts that roast your strategy This Indicator is lik e Therapy - Because daytrading shouldn't fe el like watching paint dry! Highlights
Smart ATR Grid Pro
Syamsurizal Dimjati
SMART ATR GRID PRO++ – Adaptive Grid Intelligence Suite is a next-generation, institutional-grade grid trading indicator engineered for traders who demand precision, adaptability, and comprehensive market structure analysis. By seamlessly integrating   Adaptive Volatility Grid System ,   KAMA Candle Trend Filtering ,   Multi-Factor Trend Detection (ADX + EMA20/50) ,   Dynamic Heatmap Zone Engine , and   Real-Time Market Regime Classification , this indicator delivers a complete decision-making
Have you ever struggled with the standard MACD on MT5? One major challenge is that the default indicator often fails to clearly indicate when the momentum is fading or picking up strength. After analyzing the visual workflow used by professional-grade charting platforms, I have developed the "Quantitative Structure Indicator" to bring that missing clarity to your MetaTrader 5 terminal. This tool is specifically engineered to visualize momentum shifts with precision. By providing a clear view of
Mean Reversion Supply Demand Indicator Mean Reversion Supply Demand is the indicator to detect the important supply demand zone in your chart. The concept of supply demand trading relies on the quantity mismatching between buying and selling volumes in the financial market. Typically, supply demand zone serves to predict the turning point. The wave pattern, for any supply demand zone to work as an successful trade, looks like the price must touch the base zone, move away and then return to zone
O Indicador de Tempo das Sessões de Negociação: O "Indicador de Tempo das Sessões de Negociação" é uma poderosa ferramenta de análise técnica projetada para aprimorar sua compreensão das diferentes sessões de negociação no mercado Forex. Este indicador integrado de forma transparente fornece informações cruciais sobre os horários de abertura e fechamento das principais sessões, incluindo Tóquio, Londres e Nova York. Com o ajuste automático do fuso horário, ele atende aos traders globalmente, a
FREE
Win43 Scalper
Eadvisors Software Inc.
O novo s43 Scalper para Mini-Índice (WIN-IND) faz operações de curto prazo no timeframe 1min buscando pequenas variações do mercado, utiliza nova tecnologia de trade, os resultados no intraday são íncríveis, confira:      Após a instalação adicione no gráfico dos instrumentos win para visualizar os resultados no backteste. Recomendamos o timeframe de 1min.
Renko Plus
Eadvisors Software Inc.
Com o Renko Plus você consegue utilizar os recursos na funcionalidade Indicador, basta adicioná-lo ao gráfico do Metatrader5.             O gráfico Renko é um tipo de gráfico, desenvolvido pelos japoneses, que é construído usando o movimento de preços em vez de preços e intervalos de tempo padronizados, como a maioria dos gráficos. Acredita-se que tenha o nome da palavra japonesa para tijolos, "renga", já que o gráfico se parece com uma série de tijolos.             Um novo tijolo
Obtenha este indicador e outros gratuitamente aqui:   Transforme um indicador em robô de negociação (sem programar)   Oferta especial :   ALL TOOLS , por apenas   $35   cada por tempo limitado ! Novas ferramentas   será   US$ 30   para o   primeira semana   ou o   3 primeiras compras !  Canal de ferramentas de negociação em MQL5 : Junte-se ao meu canal MQL5 para atualizar as últimas notícias minhas Guia de vários prazos&e vários símbolos: Guia do usuário do Multi-Timeframe &&Scanner - Disponíve
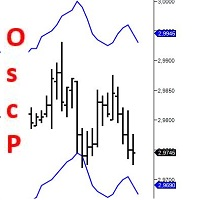
Very special indicator of Joe Dinapoli which is a derivative  of a Detrended Oscillator. Through a set of parametric equations, a predicting oscillator is created that forecasts, one period ahead of time, overbought and oversold conditions. The resulting predictor values are expressed as bands on the bar chart, both above and below the market. It may be mistaken as a Bollinger Band but has no resemblance to it whatsoever. The Predictor bands may be used in a variety of ways to aid in entering an
Este é sem dúvida o indicador de reconhecimento automático de formação de preço harmônico mais completo que você pode encontrar para a MetaTrader Platform. Ele detecta 19 padrões diferentes, leva as projeções de Fibonacci tão a sério quanto você, exibe a Zona de Reversão Potencial (PRZ) e encontra níveis adequados de stop loss e take-profit. [ Guia de instalação | Guia de atualização | Solução de problemas | FAQ | Todos os produtos ] Detecta 19 formações harmônicas de preços diferentes Traça
Trend Lines Supports and Resistances is an indicator that analyses the market structure, identifies Pivot Points, displays active Support/Resistance zones and trend levels. Main Features: Defining and displaying Pivot Points. Analyse Pivot Points to build and display trend lines. Setting up visual display of trend lines. Setting up trend lines broken notifications. Analyse Pivot Points to define and display support and resistance levels. Setting up visual display of support and resistance leve
Cansado de traçar linhas de suporte e resistência? A Resistência de suporte é um indicador de período múltiplo que detecta e plota automaticamente linhas de suporte e resistência no gráfico com um toque muito interessante: conforme os níveis de preços são testados ao longo do tempo e sua importância aumenta, as linhas se tornam mais espessas e mais escuras. [ Guia de instalação | Guia de atualização | Solução de problemas | FAQ | Todos os produtos ] Melhore sua análise técnica da noite para o d
SMC Unmitigated Finding is a indicator for find unmitigated supply and demand in previous legs of price Settings Zigzag Settings ZZDepth - by Default is 12. ZZDeviation - by Default is 5. ZZBackStep - by Default is 3. Horizontal Line Settings SupportColor-  color for Support line.  ResistanceColor  -  color for Resistance line. Settings Num of Show -  Number of Support & Resistance Show.
Double HMA MTF for MT5
Pavel Zamoshnikov
4 (4)
This is an advanced multi-timeframe version of the popular Hull Moving Average (HMA) Features Two lines of the Hull indicator of different timeframes on the same chart. The HMA line of the higher timeframe defines the trend, and the HMA line of the current timeframe defines the short-term price movements. A graphical panel with HMA indicator data from all timeframes at the same time . If the HMA switched its direction on any timeframe, the panel displays a question or exclamation mark with a tex
VibeFox Wolfe Waves — o padrão de reversão de 5 pontos com linha alvo e pontos de entrada O VibeFox Wolfe Waves é um indicador de padrões em tempo real para o MetaTrader 5. Ele varre a estrutura de preços em busca da clássica formação Wolfe Waves — cinco pontos de oscilação alternados que constroem uma cunha convergente — desenha as linhas do padrão e a linha alvo EPA diretamente no gráfico de preços, marca o ponto de entrada no ponto 5 e reúne todos os controles em um painel interativo moderno.
Indicador Crypto_Forex "Padrão Martelo e Estrela Cadente" para MT5, sem repintura, sem atraso. - O indicador "Padrão Martelo e Estrela Cadente" é um indicador muito poderoso para negociação de Price Action. - O indicador detecta padrões Martelo de alta e Estrela Cadente de baixa no gráfico: - Martelo de alta - Sinal de seta azul no gráfico (veja as imagens). - Estrela Cadente de baixa - Sinal de seta vermelha no gráfico (veja as imagens). - PC, Mobile alerts. - O indicador "Padrão Martelo e Est
Multichart V and H Line Sync Overview Multichart V and H Line Sync is the essential tool for multi-timeframe traders. It instantly synchronizes your Horizontal Support/Resistance Lines and Vertical Time Lines across all open charts of the same symbol. Stop drawing the same levels on M5, H1, and D1 charts manually. With this tool, draw a line once, and it automatically replicates on every other timeframe. Perfect for keeping your technical analysis consistent and your workspace clean. Key Feature
FREE
Fractals
Mikhail Nazarenko
The Fractals indicator displays on the chart only fractals with the specified parameters in the indicator settings. This allows you to more accurately record a trend reversal, excluding false reversals. According to the classical definition of a fractal, it is a candlestick - an extremum on the chart, which was not crossed by the price of 2 candles before and 2 candles after the appearance of a fractal candle. This indicator provides the ability to adjust the number of candles before and after t
This is Multiple Timeframe of Malaysia SNR Levels and Storyline. The single timeframe version here Features: + Display level on multiple timeframe (higher or lower) + Turn on/off level on timeframe + Alert when price touch level 1. if high > resistance level but close of candle < resistance level , this level become unfresh - Name of level will have "(m)" meaning mitigated if close of candle > resistance level , this level become invalid and can be removed in chart (there is setting for keep/rem
Os compradores deste produto também adquirem
Trend Sniper X
Sarvarbek Abduvoxobov
4.86 (42)
Trend Sniper X é um indicador de acompanhamento de tendência para múltiplos tempos gráficos no MetaTrader 5 que ajuda os traders a identificar a direção da tendência e potenciais pontos de reversão com clareza e precisão. para MT4: https://www.mql5.com/en/market/product/193245 Informações sobre o preço: O preço atual é promocional e está sujeito a alterações à medida que novas atualizações e funcionalidades forem lançadas. Oferta Bônus: Para obter o Auto-Trade Assistant EA GRATUITO para este in
Smart Trend Trading System — MetaTrader 5 Após a compra, envie-me uma mensagem no MQL5 para receber Smart Universal Expert Advisor GRÁTIS, além do curso online, do manual em PDF e do acesso ao grupo privado. O STTS reúne a direção da tendência, sinais de entrada e saída, zonas de reversão e níveis de preço importantes diretamente no seu gráfico. Siga o sistema manualmente ou conecte um EA compatível separado para executar operações automaticamente com as configurações que você escolher. UM SISTE
SuperScalp Pro
Van Minh Nguyen
4.54 (37)
SuperScalp Pro - Professional Multi-Layer Confluence Scalping System SuperScalp Pro é um indicador avançado de scalping que aprimora o Supertrend clássico com vários filtros inteligentes de confirmação. Ele ajuda a identificar oportunidades de Buy/Sell com maior probabilidade, reduzindo significativamente os sinais falsos. Setas claras de Buy e Sell aparecem diretamente no gráfico, enquanto os níveis de Stop Loss e Take Profit baseados em ATR são calculados automaticamente em tempo real. Após a
Auto Optimized SpeedAngle é um sistema de vetorização de momentum de nível institucional que elimina o sobreajuste ( curve-fitting ) por meio da otimização contínua de avanço ( Walk-Forward Optimization , WFO). Em vez de depender de entradas estáticas que se degradam quando os regimes de mercado mudam, o indicador recalibra dinamicamente seus parâmetros utilizando validação fora de amostra ( Out-of-Sample , OOS), garantindo que os sinais exibidos representem vantagens estatísticas genuínas e não
Boba Analysis Suite
Trade Ready Solutions LLC
5 (1)
Boba Analysis Suite O Boba Analysis Suite é um indicador de análise para o MetaTrader 5. Reúne a estrutura do mercado, as zonas de preço relevantes e o contexto geral do mercado numa única visualização do gráfico. Desenvolvido a partir da experiência prática como trader e formador de traders, apoia um processo de análise estruturado: avaliar a direção do mercado, identificar níveis importantes e analisar vários períodos gráficos em conjunto. Análise em contexto O significado de cada sinal depend
A lenda está de volta: Entry Points Pro 10. O relançamento do lendário indicador que se manteve por 3 anos no Top-3 do MQL5 Market. Centenas de avaliações entusiasmadas (589 nas duas versões), milhares de traders operam com ele todos os dias, 31.000+ downloads da versão demo   MT4+MT5 . Li cada avaliação de vocês ao longo de cinco anos — e, em vez de promessas, coloquei as respostas dentro da versão 10. Do autor que está no mercado desde 1999 e valoriza a honestidade, a própria reputação e os se
Adaptive Price Action Engine Compre um indicador, ganhe o EA de graça Análise Auto-Otimizada de Tendências e Padrões de Candlestick em Múltiplos Timeframes Os mercados estão em constante mudança, e nem todos os padrões de Price Action têm o mesmo valor em todas as condições de mercado. O Adaptive Price Action Engine foi desenvolvido para se adaptar às mudanças nas condições do mercado, combinando estrutura de tendência, análise Multi-Timeframe, padrões de candlestick e otimização estatística em
ARIPoint
Temirlan Kdyrkhan
1 (4)
ARIPoint is a powerful trading companion designed to generate high-probability entry signals with dynamic TP/SL/DP levels based on volatility. Built-in performance tracking shows win/loss stats, PP1/PP2 hits, and success rates all updated live. Key Features: Buy/Sell signals with adaptive volatility bands Real-time TP/SL/DP levels based on ATR Built-in MA Filter with optional ATR/StdDev volatility Performance stats panel (Success, Profit/Loss, PP1/PP2) Alerts via popup, sound, push, or email Cu
Gann Made Easy   é um sistema de negociação Forex profissional e fácil de usar, baseado nos melhores princípios de negociação usando a teoria do sr. W. D. Gann. O indicador fornece sinais precisos de COMPRA e VENDA, incluindo níveis de Stop Loss e Take Profit. Você pode negociar mesmo em movimento usando notificações PUSH. Entre em contato comigo após a compra para receber instruções de negociação e ótimos indicadores extras gratuitamente! Provavelmente você já ouviu muitas vezes sobre os método
M1 Sniper MT5
Oleg Rodin
5 (7)
O   M1 SNIPER   é um sistema indicador de negociação fácil de usar. É um indicador de seta projetado para o período M1. O indicador pode ser usado como um sistema independente para scalping no período M1 e pode ser usado como parte do seu sistema de negociação existente. Embora este sistema de negociação tenha sido projetado especificamente para negociação no M1, ele também pode ser usado em outros períodos. Originalmente, desenvolvi este método para negociar XAUUSD e BTCUSD. Mas considero-o úti
FiboSniper Pro
Van Minh Nguyen
5 (4)
FiboSniper Pro – Multi-Filter Fibonacci System with Auto SL/TP and Control Panel FiboSniper Pro é um indicador técnico que combina Fibonacci Envelopes dinâmicos com vários filtros de confirmação para gerar sinais seletivos de Buy e Sell. Os níveis de Fibonacci são calculados com base em Moving Average e ATR e, em seguida, filtrados por ADX, EMA, RSI, ATR, Volume, Time e estrutura das velas. O indicador exibe diretamente no gráfico os níveis automáticos de Stop Loss e Take Profit baseados em ATR,
Get Ready for 2 Major New Features in Our Next Update — Coming Soon! [ NEW  ] We’re taking market analysis to the next level with 2 new features designed to meet your trading needs. Introducing: TRADE OVERVIEW DASHBOARD CONFLUENCE AT ZONE 1. TRADE OVERVIEW DASHBOARD A dashboard that helps you see the overall market picture more easily, with key information from multiple timeframes and trading guidance to support your trading decisions, helping you analyze the market and plan your trades system
Apex Patterns PRO Compre o indicador - Obtenha um Expert Advisor baseado nele GRATUITAMENTE. Inteligência Auto-otimizada de Padrões e Rompimentos Os rastreadores de padrões tradicionais dependem de entradas fixas, frequentemente apresentando baixo desempenho quando a volatilidade e as estruturas do mercado mudam. O Apex Patterns PRO foi projetado para se adaptar às mudanças nas condições do mercado, combinando o reconhecimento estrutural de padrões de gráfico, filtragem de momentum e auto-otimi
Neuro Poseidon MT5
Daria Rezueva
4.75 (52)
Neuro Poseidon is a new indicator by Daria Rezueva. It combines precise trading signals with adaptive TP/SL levels - creating best possible trades as a result! Message me and get  Neuro Poseidon Assistant  as a gift to automize your trading process! What makes it stand out? 1. Proven profitability on all assets and timeframes 2. Only confirmed BUY and SELL signals present on the chart 3. Adaptive TP & SL levels generated by the software for each trade 4. Easy to understand - suitable for al
Trend Catcher ind mt5
Ramil Minniakhmetov
5 (18)
INDICADOR TREND CATCHER O Indicador Trend Catcher analisa os movimentos de preços do mercado, utilizando uma combinação de indicadores de análise de tendências adaptativos, proprietários e personalizados pelo autor. Identifica a verdadeira direção do mercado, filtrando o ruído de curto prazo e focando a força do momentum subjacente, a expansão da volatilidade e o comportamento da estrutura de preços. Utiliza também uma combinação de indicadores personalizados de suavização e filtragem de tendê
Unix Scalper
Issam Kassas
4 (4)
Unix Scalper — MetaTrader 5 Após a compra, envie-me uma mensagem no MQL5 para receber Smart Universal Expert Advisor GRÁTIS, além do curso online, do manual em PDF e do acesso ao grupo privado. Identifique a oportunidade. Veja o plano. Escolha como operar. O UNIX Scalper reúne análise de mercado, decisões BUY/SELL/WAIT e níveis de Entry, Stop Loss, TP1 e TP2 em um painel organizado. VEJA O SINAL E O PLANO • Decisões claras: BUY, SELL ou WAIT. • Níveis definidos: Entry, Stop Loss, TP1 e TP2. •
Advanced Supply Demand MT5
Bernhard Schweigert
4.53 (15)
Atualmente com 33% de desconto! A melhor solução para qualquer Trader Novato ou especialista! Este indicador é uma ferramenta de negociação exclusiva, de alta qualidade e acessível porque incorporamos uma série de recursos proprietários e uma nova fórmula. Com esta atualização, você poderá mostrar fusos horários duplos. Você não só será capaz de mostrar um TF mais alto, mas também mostrar ambos, o TF do gráfico, MAIS o TF mais alto: MOSTRANDO ZONAS ANINHADAS. Todos os traders de Oferta e Demanda
FX Trend MT5 NG
Daniel Stein
5 (6)
FX Trend NG: A Nova Geração de Inteligência de Tendência Multi-Mercado Visão Geral FX Trend NG é uma ferramenta profissional de análise de tendências e monitoramento de mercado em múltiplos períodos de tempo. Permite compreender a estrutura completa do mercado em segundos. Em vez de alternar entre vários gráficos, você visualiza instantaneamente quais ativos estão em tendência, onde o momentum está enfraquecendo e onde existe alinhamento forte entre diferentes timeframes. Oferta de Lançamento
Apresentando       Quantum Breakout PRO   , o inovador Indicador MQL5 que está transformando a maneira como você negocia Breakout Zones! Desenvolvido por uma equipe de traders experientes com experiência comercial de mais de 13 anos,       Quantum Breakout PRO       foi projetado para impulsionar sua jornada comercial a novos patamares com sua estratégia de zona de fuga inovadora e dinâmica. O Quantum Breakout Indicator lhe dará setas de sinal em zonas de breakout com 5 zonas-alvo de lucro e su
O Scalper Vault é um sistema de negociação poderoso e completo, projetado para traders que buscam consistência em operações intraday. Este indicador de alta precisão funciona como um sistema de negociação autônomo, oferecendo análises de nível institucional tanto para o mercado Forex quanto para Opções Binárias. ENTRE EM CONTATO COMIGO APÓS A COMPRA PARA RECEBER DICAS DE NEGOCIAÇÃO E UM BÔNUS EXCLUSIVO! Ao eliminar suposições e análises manuais complexas, o Scalper Vault permite que você foque
Volatility Master for MetaTrader is a real-time dashboard tool that scans up to  50 symbols  to identify high-volatility , trending markets instantly. With bullish/bearish signals, customizable alerts, and a user-friendly interface, it helps you avoid range-bound conditions and focus on high-probability trades. Clarity leads to confidence. Trade confidently and protect your capital effectively with this powerful dashboard. We don't offer free or bonus indicators in exchange of reviews from you.
O   SR Liquidity   é um indicador de trading projetado para revelar as zonas ocultas onde a liquidez do mercado se concentra e o preço reage com maior intensidade. Essas áreas específicas de liquidez funcionam como níveis poderosos de suporte e resistência, oferecendo um mapa claro de onde é mais provável que o mercado reverta. Em vez de traçar linhas comuns de Suporte e Resistência, o SR Liquidity analisa o comportamento real dos preços para detectar as zonas onde se acumulam pressões de compra
Power Candles MT5
Daniel Stein
4.58 (12)
Power Candles V3 - Indicador de força com auto-otimização O Power Candles V3 transforma a força da moeda e do instrumento num plano de negociação prático em todos os gráficos aos quais está associado. Em vez de se limitar a colorir as velas, executa uma otimização automática em tempo real em segundo plano e apresenta-lhe os melhores valores de Stop Loss, Take Profit e limiar de sinal para o símbolo em questão. Basta um clique para o adotar na negociação em tempo real — as linhas de entrada, Stop
Btmm state engine pro
Garry James Goodchild
5 (4)
BTMM State Engine Pro by G-Labs — Beat The Market Maker indicator for MetaTrader 5. Asian session range, London and New York kill zones, level progression (L1/L2/L3), peak formation detection (PFH/PFL), entry signals, and a multi-pair scanner from one chart. Stop scanning charts one pair at a time. The State Engine tracks the BTMM daily cycle automatically — Asian box, room boundaries, level blocks, peak formations, and filtered entries — while the scanner dashboard shows level, peak status, d
Matreshka
Dimitr Trifonov
5 (2)
Matreshka self-testing and self-optimizing indicator: 1. Is an interpretation of the Elliott Wave Analysis Theory. 2. Based on the principle of the indicator type ZigZag, and the waves are based on the principle of interpretation of the theory of DeMark. 3. Filters waves in length and height. 4. Draws up to six levels of ZigZag at the same time, tracking waves of different orders. 5. Marks Pulsed and Recoil Waves. 6. Draws arrows to open positions 7. Draws three channels. 8. Notes support and re
Divergence Bomber
Ihor Otkydach
4.89 (94)
Cada comprador deste indicador recebe adicionalmente, e de forma gratuita: A ferramenta exclusiva "Bomber Utility", que acompanha automaticamente cada operação, define os níveis de Stop Loss e Take Profit e fecha operações de acordo com as regras da estratégia; Arquivos de configuração (set files) para ajustar o indicador em diferentes ativos; Set files para configurar o Bomber Utility nos modos: "Risco Mínimo", "Risco Balanceado" e "Estratégia de Espera"; Um vídeo tutorial passo a passo que a
Atomic Analyst MT5
Issam Kassas
4.48 (62)
Atomic Analyst — MetaTrader 5 Após a compra, envie-me uma mensagem no MQL5 para receber Smart Universal Expert Advisor GRÁTIS, além do curso online, do manual em PDF e do acesso ao grupo privado. O Atomic Analyst reúne a ação do preço, a direção da tendência, sinais de entrada e saída, Stop Loss e vários níveis de Take Profit diretamente no seu gráfico. VEJA O SINAL. ENTENDA O CENÁRIO. O Atomic Analyst organiza sua análise em informações visuais claras: • Setas de compra e venda para identificar
DayTrader PRO
Davit Beridze
5 (4)
DayTrader PRO O DayTrader PRO é um indicador de trading avançado que combina o Filtro de Laguerre de John Ehlers com um potente motor de otimização automática. Em vez de utilizar parâmetros fixos, o indicador procura automaticamente as melhores definições com base nas condições recentes do mercado, ajudando-o a adaptar-se à volatilidade variável sem necessidade de ajustes manuais constantes. O indicador gera sinais claros de COMPRA (BUY) e VENDA (SELL), juntamente com níveis adaptativos de Stop
ICT PO3 (Power of 3) AMD Protocol Framework Indicator True Time & Structure Integration   |  Non-Repainting | Real-Time  | Multi-Asset  | MT4 Version Available Full Setup Guide & Strategy Playbook: https://www.mql5.com/en/blogs/post/768683 The ICT Power of Three (PO3): The Complete Guide to Accumulation, Manipulation, and Distribution https://www.mql5.com/en/blogs/post/771729 MT4 Version: https://www.mql5.com/en/market/product/171742 Indicator Overview The ICT PO3 AMD Protocol Framework i
Crystal Heikin Ashi Signals
Muhammad Jawad Shabir
5 (5)
Crystal Heikin Ashi Signals—Professional Trend & Signal Detection Indicator Advanced Heikin Ashi Visualization with Intelligent Signal System for Manual & Automated Trading Final Price: $149 ---------> Price goes up $10 after every 10 sales . Limited slots available — act fast . Overview User Guide PDF Crystal Heikin Ashi Signals is a professional-grade MetaTrader 5 indicator that combines pure Heikin Ashi candle visualization with an advanced momentum-shift detection system. Designed for both m
Mais do autor
From REAL KNOWLEDGE to TRADE LIKE A PRO! CHoCH Power Indicator – Instant BOS & Demand/Supply Zone Detection Transform your gold trading with crystal-clear insights: Trade Gold Effortlessly on M1 & M5 Spot Demand/Supply Zones on M15 & H1 Automatic 61.8% Fibonacci Retracement on M5, M15 & H1 Works Best with SMA 420 Price above SMA420 → Only consider LONG Price below SMA420 → Only consider SHORT SCM Multi-Frame Fibo Suite Multi-Timeframe Swing Detection • Auto-identify swing highs & lows • Rea
https://youtu.be/WFQaaQ4EJWQ    ENG VERS. Volume Profile Ultimate v1.17 – คุณสมบัติล่าสุด (Latest Features) ภาษาไทย (Thai) หมวดหมู่ คุณสมบัติ ป้องกันกราฟค้าง ตรวจจับกราฟนิ่ง (Tick ไม่เคลื่อนที่) และการคำนวณค้างอัตโนมัติ กู้คืนอัตโนมัติ เมื่อตรวจพบการค้าง ระบบจะล้างออบเจ็กต์ รีเซ็ตการคำนวณ และสร้างใหม่เอง ️ จำกัดความถี่การอัปเดต การตรวจจับโซนจะทำทุก 10–30 วินาที (ไม่ใช่ทุกครั้งที่แท่งเคลื่อน) ลดภาระ CPU จัดการออบเจ็กต์อย่างมีประสิทธิภาพ สร้างและลบ Fibo / Circle / Zone เฉพาะที่จำเป็น,
eng description ฺBelow คุณสมบัติ EA OneClickTradingPro v5.46 (ไทย / ENG) ภาษาไทย EA OneClickTradingPro v5.46 เป็น Expert Advisor สำหรับ MetaTrader 5 ที่ออกแบบมาเพื่อการเทรดแบบคลิกเดียว รองรับการทำงานบนหลาย Timeframe พร้อมกัน และมีฟีเจอร์ครบครันดังนี้: 1. การเปิดออร์เดอร์ด้วยปุ่มลัด (Hotkeys) B – เปิดออร์เดอร์ Buy (Market Order) S – เปิดออร์เดอร์ Sell (Market Order) P – เปิด Pending Buy Limit (ต่ำกว่าราคาปัจจุบัน) L – เปิด Pending Sell Limit (สูงกว่าราคาปัจจุบัน) I – เพิ่ม Lot Size เป็น
English Version Unlock the Power of Volume with Next-Generation Volume Profile This advanced Volume Profile indicator transforms your MetaTrader 5 chart into a powerful volume analysis tool. Unlike standard volume indicators that only show volume over time, this tool displays volume distribution across   price levels , allowing you to pinpoint exactly where the "big money" is trading. Why choose this indicator? Dynamic Price Bins:   Set your own precision (number of rows) to view volume clust
Filtro:
Sem comentários
Responder ao comentário