SSL Indicator

🔹 SSL Trend Indicator for MT5

Identify the real market trend with clarity and confidence.

Many traders struggle with noisy indicators and false signals that make it difficult to understand the true direction of the market. The SSL Trend Indicator simplifies trend detection by using a dual moving average system that clearly defines bullish and bearish conditions.

With two dynamic lines representing market structure, the indicator allows traders to quickly identify when momentum shifts from bearish to bullish and vice versa.

Whether you trade Forex, Crypto, or other markets, SSL helps you visualize the trend in a clean and intuitive way.


🔹 Key Features

  • Clear visualization of bullish and bearish trends

  • Dual moving average logic for better trend confirmation

  • Works on all symbols and timeframes

  • Customizable parameters for different trading styles

  • Simple and easy-to-read signals

  • Lightweight and fast indicator


🔹 How It Works

The SSL Trend Indicator uses two smoothed moving averages based on market highs and lows.

When the trend direction changes, the indicator lines switch position and color, making the shift immediately visible on the chart.

This allows traders to quickly identify trend reversals and follow the dominant market direction.


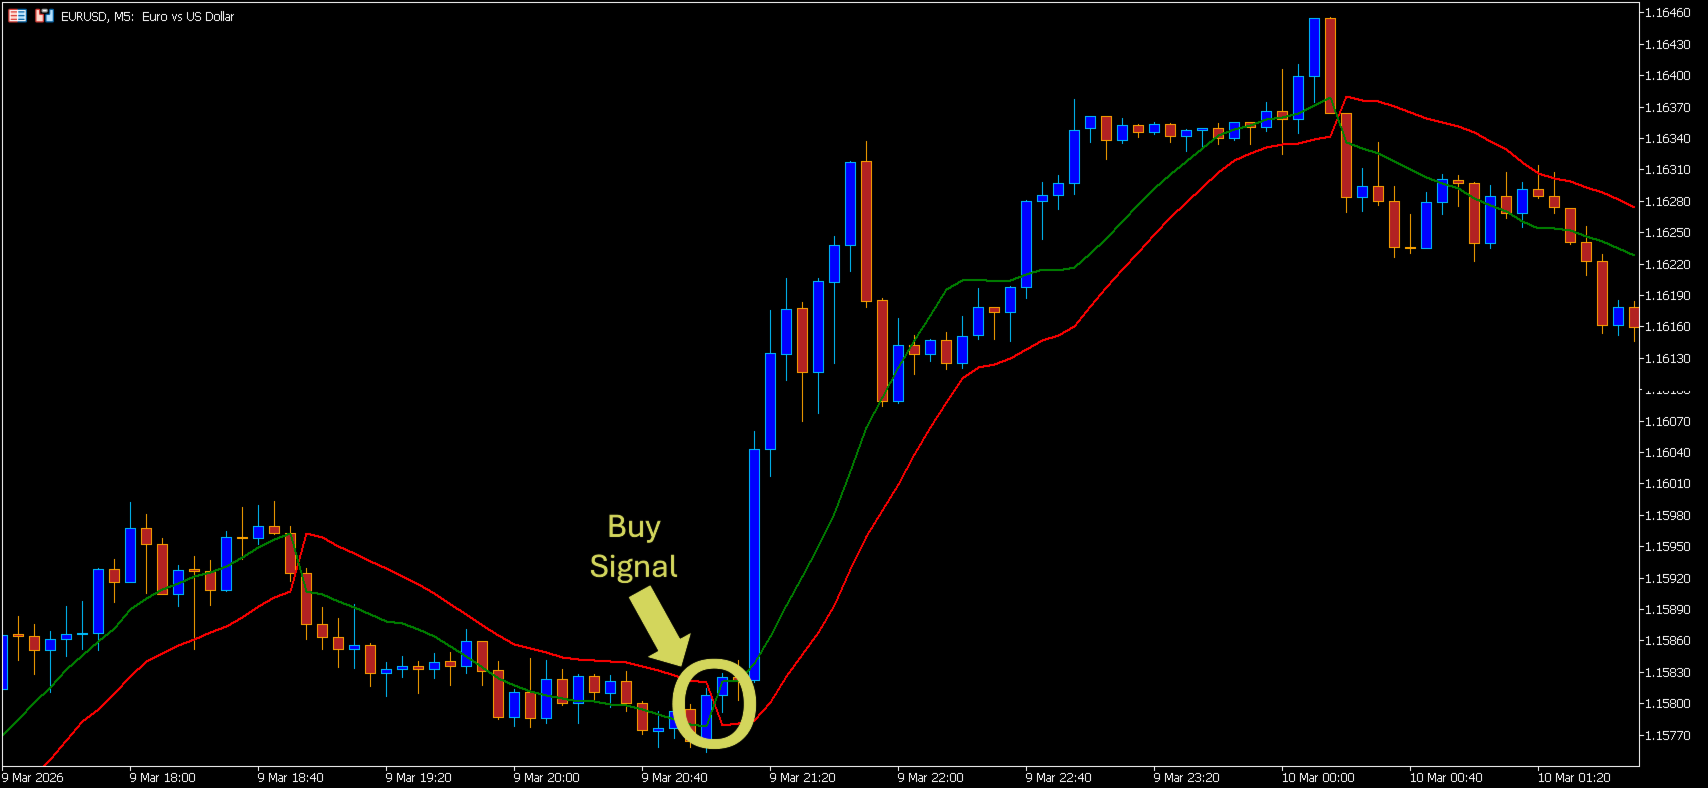
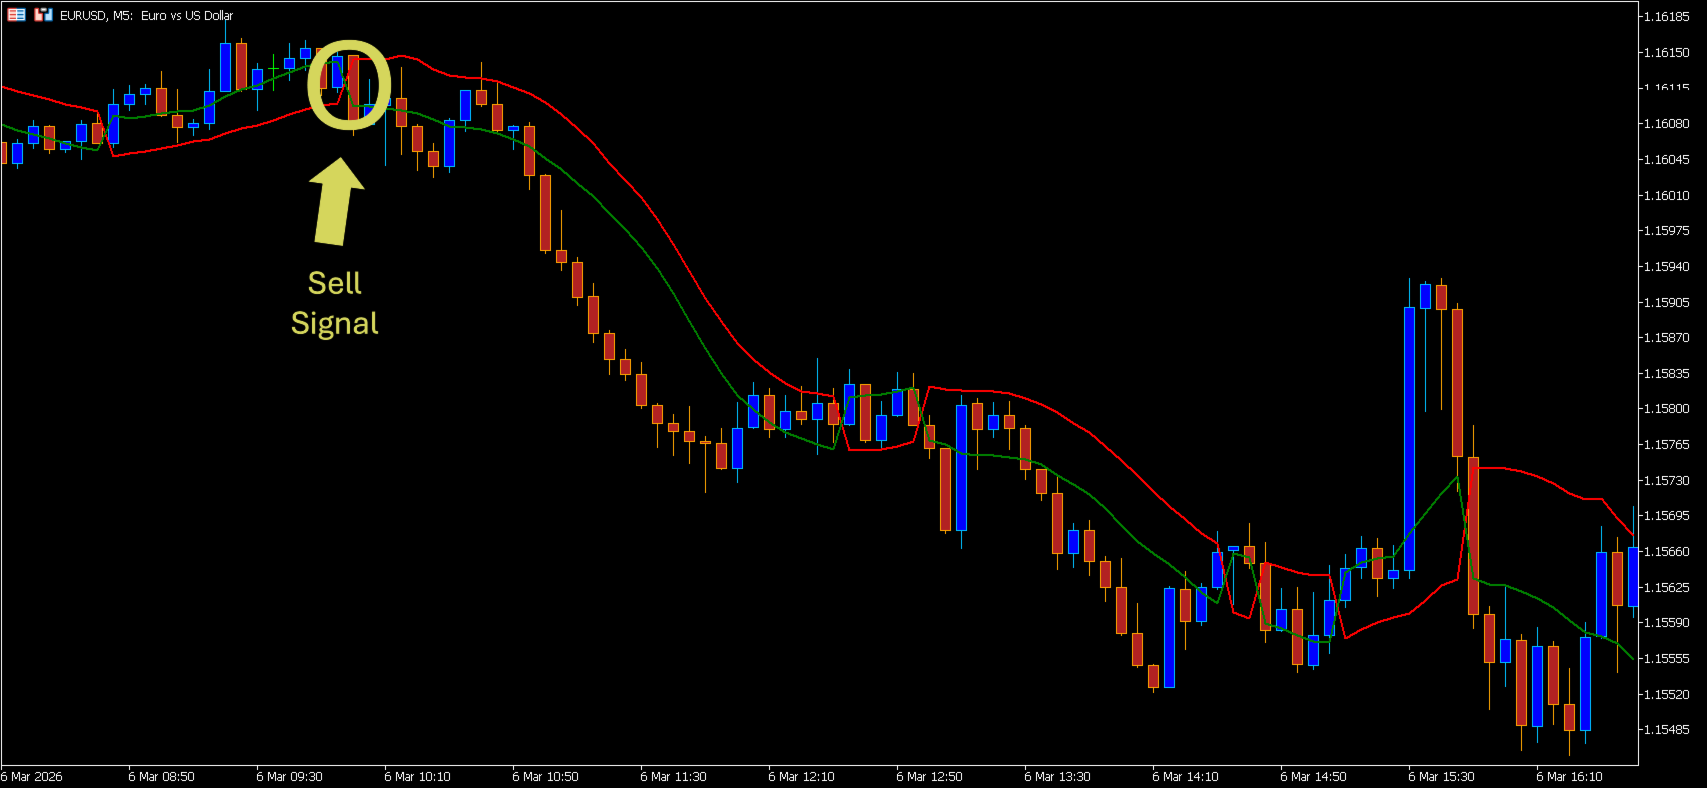
🔹 Basic Trading Idea

A common approach when using SSL:

BUY signal

  • The green SSL line crosses above the red line

  • Market structure shifts to bullish

SELL signal

  • The red SSL line crosses above the green line

  • Market structure shifts to bearish

Many traders use SSL together with support and resistance, price action strategies or Moving Average Long Range Filter.
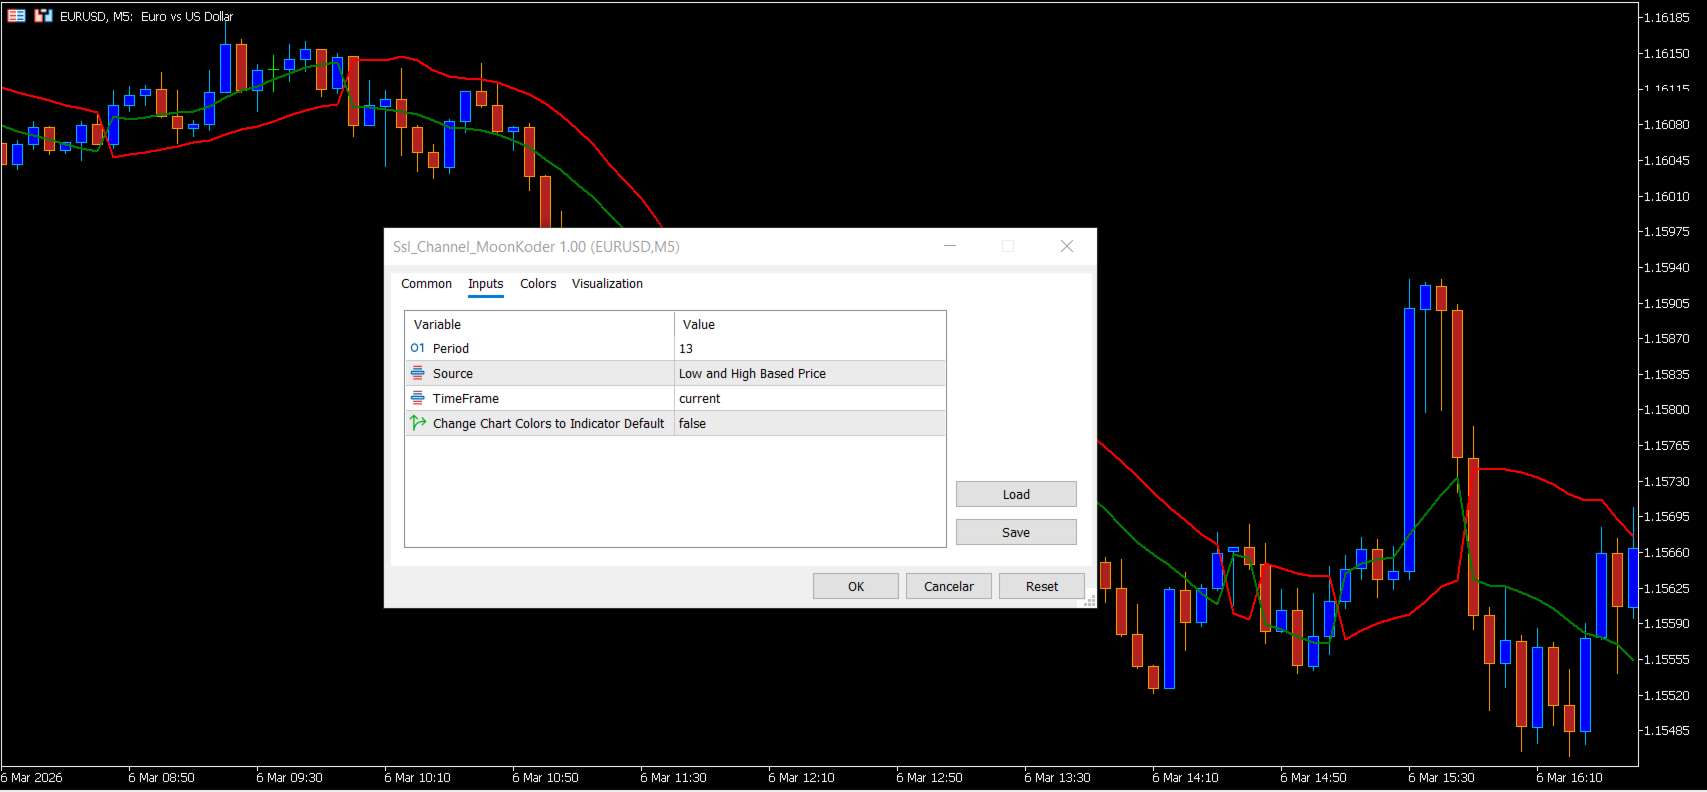

🔹 Indicator Inputs

The SSL indicator includes customizable parameters that allow traders to adapt it to different markets and strategies.

Typical parameters include:

  • Moving average period

  • Applied price

  • Calculation method

These options help traders fine-tune the indicator for short-term or long-term trading.


🔹 Where It Works Best

SSL Trend Indicator can be used on:

  • Forex pairs

  • Cryptocurrencies

  • Indices

  • Commodities

It works on scalping, intraday, swing trading, and long-term strategies.


🔹 Final Notes

The SSL Trend Indicator is designed to keep charts clean while providing a clear view of market direction. Its simplicity makes it suitable for both beginner and experienced traders looking for a reliable trend visualization tool.


SSL Indicator for MetaTrader 5 - Powerful Trend-Following Tool

The SSL Indicator is a highly efficient and reliable trend-following tool designed to help traders identify market trends with ease and precision. Based on moving averages, the SSL (Step Stop Line) Indicator changes color and provides clear visual cues when there is a potential trend reversal. This tool is excellent for traders looking to capitalize on strong market trends while avoiding false signals commonly found in ranging markets.

Key Features:

  • Accurate Trend Detection: The SSL Indicator utilizes two moving averages to calculate buy and sell signals. When the price crosses these levels, the indicator switches color, alerting traders to potential entries or exits.
  • Simple Visual Cues: The indicator plots a line on the chart, changing color from green (bullish) to red (bearish) as market conditions change. This intuitive design simplifies the decision-making process, making it perfect for both novice and experienced traders.
  • Customizable Settings: Tailor the moving average periods to suit your trading strategy. Whether you prefer short-term or long-term trends, the SSL Indicator can be adjusted to meet your needs.
  • Works on All Timeframes and Assets: Suitable for forex, stocks, commodities, and cryptocurrencies, the SSL Indicator can be applied to any chart and timeframe.
  • Low Latency Signals: The indicator provides timely signals with minimal lag, allowing you to react swiftly to market changes.
  • Integration with Trading Systems: Use it as part of a larger trading system or strategy to confirm trend direction and reduce risk.

How to Use:

  1. Buy Signal: When the price crosses above the SSL line and the line turns green, this is a potential buy signal, indicating that a bullish trend might be starting.
  2. Sell Signal: When the price crosses below the SSL line and the line turns red, it indicates a bearish trend, signaling a possible sell opportunity.

With its simplicity and effectiveness, the SSL Indicator is an essential addition to any trader's toolbox, allowing you to stay on the right side of the market and maximize your profitability.

Produtos recomendados
VPO Profile MT5
Kyra Nickaline Watson-gordon
5 (2)
Definition : VPO is a Volume Price Opportunity. Instead of using bars or candles with an Open, High, Low, and Close price, each "bar" in a Market Profile is represented by horizontal bars against the price It is called Market Profile terminology. In other words volume-price-opportunity (VPO) profiles are histograms of how many volumes were traded at each price within the span of the profile. By using a VPO chart, you are able to analyze the amount of trading activity, based on volume, for each
Was: $249  Now: $99   Market Profile defines a number of day types that can help the trader to determine market behaviour. A key feature is the Value Area, representing the range of price action where 70% of trading took place. Understanding the Value Area can give traders valuable insight into market direction and establish the higher odds trade. It is an excellent addition to any system you may be using. Inspired by Jim Dalton’s book “Mind Over Markets”, this indicator is designed to suit the
This Volume Delta Profile is an advanced MetaTrader 5 indicator that visualizes   volume delta (order flow imbalance)   using a volume profile-style histogram. It shows the difference between buying and selling pressure at specific price levels, helping traders identify supply and demand zones. This indicator provides a unique perspective on market dynamics by visualizing the imbalance between buying and selling pressure, offering insights beyond traditional volume analysis. Core Concept Positiv
Portuguese Este indicador funciona como um assistente avançado de análise de gráficos para traders que adoram operar com Padrões Gráficos. Ele foi projetado para reduzir a carga de análise visual e aumentar a precisão na obtenção de lucros. Principais características deste indicador do ponto de vista do uso prático: 1. Detecção Automática de Padrões (Automated Pattern Detection) Economiza tempo e reduz viés: Você não precisa desenhar linhas de tendência manualmente. O indicador buscará oscilaçõe
The "MR Volume Profile 5" indicator is a charting tool that displays trading volume at different price levels rather than time intervals. A key concept in volume profile is the point of control (POC)—the price level with the highest volume traded during the session or time range. While tools like VWAP or OBV provide volume trends, the "MR Volume Profile 5" indicator offers granular detail about where the most market activity occurs at specific price levels. This makes it a more precise tool for
O indicador cria cotações atuais, que podem ser comparadas com as históricas e, com base nisso, fazer uma previsão do movimento dos preços. O indicador possui um campo de texto para navegação rápida até a data desejada. Opções: Símbolo - seleção do símbolo que o indicador exibirá; SymbolPeriod - seleção do período do qual o indicador coletará dados; IndicatorColor - cor do indicador; HorisontalShift - deslocamento das cotações desenhadas pelo indicador pelo número especificado de barras; I
TRI Visualizer
Yoshimi Mon 三 Ura
TRI Visualizer MT5 – Thermodynamic Market Analysis Overview The TRI (Thermal Range Indicator) Visualizer Enhanced is a rare market analysis indicator that goes beyond conventional technical analysis, applying principles of thermodynamics from physics. It interprets market price fluctuations as “thermodynamic energy,” enabling the highly accurate detection of subtle market changes that are often overlooked. Innovative Mechanisms 1. Dual Calculation Engines Classic TRI Mode Formula: |Close
Pro Gold System Indicator
PEDRO JOAQUIM GONCALVES GOMES
ADVANCED FUNCTIONALITIES: Trend Score (0-100) with visual bar Intelligent signals with adjustable strength (1-10) Risk management with automatic TP/SL Audible and visual alerts Price zones with smooth filling Multi-indicator analysis (RSI, ATR, BB, EMAs) DESIGN FEATURES Modern Visual: Smooth and well-spaced lines (EMA with 2-3px width) Vibrant and professional colors (Sky Blue, Orange, Gold) Modern arrows (code 233/234) for buy/sell signals Configurable dark/light theme Adjustable transparency f
TimeVolumeProfile — MQL5 Marketplace Description MetaTrader 5 · Custom Indicator Time Volume Profile Market profile analytics — POC, Value Area High and Value Area Low — computed from pure price action. No tick volume required. MetaTrader 5 Version 2.00 No Volume Feed Needed Overview TimeVolumeProfile brings institutional-grade market profile analysis to any instrument and timeframe — without depending on a broker's tick-volume feed. It identifies the price levels where the market has spent the
Versão MT4: https://www.mql5.com/en/market/product/166784 Versão MT5: https://www.mql5.com/en/market/product/166785 PERFIL DE LIQUIDEZ O PERFIL DE LIQUIDEZ é uma ferramenta visual de estrutura de mercado que mapeia as zonas de liquidez potenciais no gráfico utilizando um perfil dinâmico em formato de mapa de calor. Este indicador analisa a ação histórica do preço e o volume de ticks, destacando as áreas de preço onde a liquidez está provavelmente concentrada. Ele desenha: Linhas de liquidez
MarketPredict Pro – Análise avançada de mercado em múltiplas camadas   Como funciona O MarketPredict Pro combina seis camadas analíticas independentes para gerar previsões altamente precisas da próxima vela.   Análise em 6 camadas Buyers/Sellers Pressure   – mede a força de compradores e vendedores Trend Strength   – cálculo de tendência usando SMA de 20 períodos Volatility   – modelo de volatilidade semelhante ao ATR (14 períodos) Market Pressure   – pressão acumulada das últimas 5 v
A Gann Box (ou Gann Square) é um método de análise de mercado baseado no artigo "Fórmula matemática para previsões de mercado" de WD Gann. Este indicador pode representar três modelos de Quadrados: 90, 52(104), 144. Existem seis variantes de grades e duas variantes de arcos. Você pode plotar vários quadrados em um gráfico simultaneamente Parâmetros Square — seleção de um modelo quadrado de Gann: 90 — quadrado de 90 (ou quadrado de nove); 52 (104) — quadrado de 52 (ou 104); 144 — quadrado univ
Cumulative Volume Delta MA-X MTF (com Momento de Gradiente) Este indicador realiza uma análise multi-timeframe do Delta de Volume Acumulado (CVD) para o MetaTrader 5. Ele calcula a diferença líquida entre a pressão de compra e venda analisando dados de volume real ou de ticks , fornecendo uma representação visual do sentimento do fluxo de ordens. Lógica e Recursos do Indicador O indicador utiliza uma abordagem matemática para a análise de volume: Origem dos Dados: Suporta tanto Volume Real (par
Volume Profile Canvas - Professional Volume Profile Indicator for MetaTrader 5 DESCRIPTION Volume Profile Canvas is a professional volume profile indicator for MetaTrader 5 that renders directly on the chart using a high-performance Canvas engine. It calculates and displays the volume distribution across price levels, identifying the Point of Control (POC), Value Area High (VAH) and Value Area Low (VAL) in real time. This is a pure analysis tool. It does not trade. It gives you an instant vi
PivotWave
Jeffrey Quiatchon
Introducing PivotWave – your ultimate trading companion that redefines precision and market analysis. Designed with traders in mind, PivotWave is more than just an indicator; it’s a powerful tool that captures the pulse of the market, identifying key turning points and trends with pinpoint accuracy. PivotWave leverages advanced algorithms to provide clear visual signals for optimal entry and exit points, making it easier for traders to navigate volatile market conditions. Whether you are a begin
BoxChart MT5
Evgeny Shevtsov
5 (7)
The market is unfair if only because 10% of participants manage 90% of funds. An ordinary trader has slim changes to stand against these "vultures". This problem can be solved. You just need to be among these 10%, learn to predict their intentions and move with them. Volume is the only preemptive factor that faultlessly works on any timeframe and symbol. First, the volume appears and is accumulated, and only then the price moves. The price moves from one volume to another. Areas of volume accumu
O nível Premium é um indicador único com mais de 80% de precisão nas previsões corretas! Este indicador foi testado pelos melhores Especialistas em Negociação por mais de dois meses! O indicador do autor você não encontrará em nenhum outro lugar! A partir das imagens você pode ver por si mesmo a precisão desta ferramenta! 1 é ótimo para negociar opções binárias com um tempo de expiração de 1 vela. 2 funciona em todos os pares de moedas, ações, commodities, criptomoedas Instruções: Assim
Daily Bias
Barend Paul Stander
Daily Bias Indicator with Statistics and Dashboard Unlock the power of market bias analysis with the Multi-Timeframe Bias Indicator, a versatile tool designed for traders seeking a clear edge in the markets. This indicator provides actionable insights by displaying Daily Bias, Weekly Bias, and Custom Period Bias, enabling you to align your trades with the prevailing market direction across multiple timeframes and symbols. Key Features: Daily Bias Analysis: Identify the bullish, bearish, or neutr
Cumulative Volume Delta (CVD) MA-X: Ferramenta Inteligente de Sentimento de Fluxo de Ordens Desvende a mecânica oculta do mercado com o Cumulative Volume Delta (CVD) MA-X . Enquanto os indicadores de volume padrão apenas dizem quanto foi negociado, o CVD MA-X diz QUEM está vencendo a batalha entre compradores e vendedores e QUANDO . Ao agregar a ação do preço em nível de tick e a distribuição de volume, este indicador fornece um mapa cristalino da convicção e exaustão do mercado. A Vantagem do
Market profile was developed by Peter Steidlmayer in the second half of last century. This is a very effective tool if you understand the nature and usage. It's not like common tools like EMA, RSI, MACD or Bollinger Bands. It operates independently of price, not based on price but its core is volume. The volume is normal, as the instrument is sung everywhere. But the special thing here is that the Market Profile represents the volume at each price level. 1. Price Histogram The Price Histogram i
Volume Profile For MT5
Abdelkhabir Yassine Alaoui
Perfil de Volume VPVR para MT5 O Perfil de Volume VPVR é um indicador poderoso e de alto desempenho para MetaTrader 5, projetado para replicar o Perfil de Volume (Faixa Visível) avançado diretamente no seu gráfico. Ele fornece uma visão profunda da estrutura do mercado, visualizando onde a atividade de negociação está concentrada, ajudando os traders a identificar níveis de preço importantes com precisão. Este indicador analisa dinamicamente a distribuição do volume entre os níveis de preço e
Visual CrossPulse Dynamics Indicator
AL MOOSAWI ABDULLAH JAFFER BAQER
Visual CrossPulse Dynamics: Trade with the Market's True Rhythm Unlock a new level of market insight with Visual CrossPulse Dynamics, a sophisticated trading indicator designed to adapt to ever-changing volatility and reveal the true direction of the trend. Are you tired of indicators that lag in fast-moving markets or give false signals during consolidation? The Visual CrossPulse Dynamics indicator solves this problem by using an advanced, adaptive algorithm that intelligently adjusts to the m
No Demand No Supply MT5
Trade The Volume Waves Single Member P.C.
No Demand No Supply   This indicator identifies   No Demand –No Supply candles to your chart and plots volume bars colored according to the signal. It can be applied to all timeframes or to a specific one only. It can also be used as regular volume indicator  with exceptional future of WEIGHTED VOLUME. Furthermore is has an alert notification, sound and email when a signals occurs. The indicator does not repaint but the alert will come on two candles back due to the definition of No Demand No Su
POC level MT5
Mikhail Nazarenko
The indicator automatically calculates       and displays the level of the maximum       real   volume Point Of Control (POC) of the Market Profile for the   array of candles   highlighted by a rectangular area. This will significantly increase the accuracy of your position entries when trading POC bounces and reversals. Attention when testing the demo version!   In the MT5 strategy tester , there is no possibility of dragging a rectangle and this is a problem of limitations of the MT5 strategy
Volume Profile V6
Andrey Kolesnik
4.8 (5)
Market Volume Profile indicator + Smart Oscillator. Funciona em praticamente todos os instrumentos — pares de moedas, ações, futuros, criptomoedas — utilizando tanto volume real quanto volume de ticks. Você pode definir o intervalo do perfil automaticamente (por exemplo, uma semana, um mês, etc.) ou manualmente movendo os limites (duas linhas verticais: vermelha e azul). É exibido na forma de histograma. A largura do histograma em um determinado nível representa, de forma условная, a quantidade
MultiTimeframe Support and Resistance Zones
Mohamed Gamal Abdelnasser Yous Hashesh
A powerful indicator that highlights key market zones and helps traders identify potential opportunities across multiple timeframes. Designed for clarity and efficiency, it provides real-time alerts to keep you informed of important price levels. Key Features: Works on multiple timeframes: M1, M5, M15, M30, H1, H4, D1, W1, MN1. Customizable zone colors for each timeframe. Real-time alerts and notifications when price reaches significant zones. Automatically manages chart objects to keep your wor
What Is Trend Master Pro? Trend Master Pro   is a professional-grade trend trading indicator built for MetaTrader 5. It was designed with one goal in mind — to keep you on the right side of the market at all times by combining three powerful technical tools into a single, clean, easy-to-read display directly on your price chart. Instead of cluttering your screen with multiple separate indicators, Trend Master Pro fuses an   EMA Ribbon trend filter , a   ZigZag swing point engine , and a   breako
Price Volume Trend (PVT) Oscillator Description:  The PVT Oscillator is a volume indicator that serves as an alternative to the standard On-Balance Volume (OBV). While ordinary volume indicators can be noisy and hard to read, this tool converts volume flow into a clear Histogram Oscillator, similar to a MACD, but for Volume. It is designed to detect first  Trend Reversals and Divergences by analyzing the difference between a Fast and Slow PVT moving average. Why is this better than standard OBV?
FREE
RSI Currency Strength Meter is a powerful and elegant multi-currency indicator that measures the real-time relative strength of the 8 major currencies using RSI logic. By calculating the smoothed performance of each currency across its major pairs and applying the RSI formula, it delivers clean and responsive strength lines that make it easy to spot which currencies are truly strong or weak at any moment. This indicator is particularly useful for visualizing currency correlations and divergence
Você utiliza o volume na sua leitura do mercado? Certamente muitos traders usam, e não se imaginam operando sem ele. O indicador Color Histogram Volume Set permite que o usuário escolha o valor que ele considera interessante para monitorar. Ao ultrapassar este você terá a confirmação visual e se quiser terá também o alerta sonoro que é dado pelo indicador. Claro que existem outras maneiras de tentar encontrar um volume elevado, como avaliar se o v olume está acima da média, se é o maior volum
Os compradores deste produto também adquirem
SuperScalp Pro
Van Minh Nguyen
4.63 (24)
SuperScalp Pro – Sistema avançado de scalping com múltiplos filtros SuperScalp Pro é um indicador avançado de scalping que combina o clássico Supertrend com múltiplos filtros inteligentes de confirmação para ajudar a identificar oportunidades de trading. Funciona de forma eficiente em vários timeframes de M1 até H4, com desempenho otimizado para XAUUSD, BTCUSD e principais pares Forex. O indicador fornece sinais claros de Buy e Sell, juntamente com níveis calculados automaticamente de entrada, S
Divergence Bomber
Ihor Otkydach
4.9 (89)
Cada comprador deste indicador recebe adicionalmente, e de forma gratuita: A ferramenta exclusiva "Bomber Utility", que acompanha automaticamente cada operação, define os níveis de Stop Loss e Take Profit e fecha operações de acordo com as regras da estratégia; Arquivos de configuração (set files) para ajustar o indicador em diferentes ativos; Set files para configurar o Bomber Utility nos modos: "Risco Mínimo", "Risco Balanceado" e "Estratégia de Espera"; Um vídeo tutorial passo a passo que aju
SignalTech MT5 is an unique fully rule based trading system for EURUSD, USDCHF, USDJPY, AUDUSD, NZDUSD, EURJPY, AUDJPY, NZDJPY, CADJPY.  All the winning trades with chart setups are published on the comments page. 2026-05 3493 Pips (Until 05-21 NY Closed) 2026-04 2243 Pips 2026-03 2165 Pips 2026-02 2937 Pips 2026-01 2624 Pips 2025-12 1174 Pips It can generate signals with Buy/Sell Arrows and Pop-Up/Sound Alerts. Each signal has clear Entry and Stop Loss levels, which should be automatically flag
Entry In The Zone and SMC Multi Timeframe is a real-time 2-in-1 market analysis tool that combines market structure analysis and a No Repaint BUY / SELL signal system into a single indicator, built on Smart Money Concepts (SMC) — a widely adopted framework used by professional traders to understand market structure. This indicator helps you see the market more clearly, make decisions based on structure rather than guesswork, and focus on high-probability zones where price is more likely to react
Vamos ser honestos primeiro. Nenhum indicador sozinho vai te tornar lucrativo. Se alguém te disser o contrário, está te vendendo um sonho. Qualquer indicador que mostre setas perfeitas de compra/venda pode ser feito para parecer impecável — basta dar zoom na parte certa da história e tirar um print das operações vencedoras. Nós não fazemos isso.  SMC Intraday Formula é uma ferramenta. Ela lê a estrutura do mercado para você, identifica as zonas de maior probabilidade de preço e mostra exatament
Azimuth Pro
Ottaviano De Cicco
5 (7)
Azimuth Pro V2: Estrutura Fractal Sintética e Entradas Confirmadas para MT5 Visão geral Azimuth Pro é um indicador de estrutura swing multinível da Merkava Labs . Quatro camadas de swing aninhadas, VWAP ancorado em swings, detecção de padrões ABC, filtragem estrutural de três timeframes e entradas confirmadas em barra fechada — um gráfico, um fluxo de trabalho dos micro-swings aos macro-ciclos. Este não é um produto de sinais cegos. É um fluxo de trabalho baseado em estrutura para traders que v
Power Candles MT5
Daniel Stein
5 (8)
Power Candles V3 - Indicador de força com auto-otimização O Power Candles V3 transforma a força da moeda e do instrumento num plano de negociação prático em todos os gráficos aos quais está associado. Em vez de se limitar a colorir as velas, executa uma otimização automática em tempo real em segundo plano e apresenta-lhe os melhores valores de Stop Loss, Take Profit e limiar de sinal para o símbolo em questão. Basta um clique para o adotar na negociação em tempo real — as linhas de entrada, Stop
INDICADOR TREND CATCHER O Indicador Trend Catcher analisa os movimentos de preços do mercado, utilizando uma combinação de indicadores de análise de tendências adaptativos, proprietários e personalizados pelo autor. Identifica a verdadeira direção do mercado, filtrando o ruído de curto prazo e focando a força do momentum subjacente, a expansão da volatilidade e o comportamento da estrutura de preços. Utiliza também uma combinação de indicadores personalizados de suavização e filtragem de tendê
Se você comprar este indicador, receberá meu Gerenciador de Operações Profissional + EA  GRATUITAMENTE. Primeiramente, vale ressaltar que este Sistema de Trading é um Indicador Não Repintado, Não Redesenho e Não Atrasado, o que o torna ideal tanto para o trading manual quanto para o automatizado. Curso online, manual e download de predefinições. O "Sistema de Trading Inteligente MT5" é uma solução completa de trading projetada para traders novos e experientes. Ele combina mais de 10 indicadores
Gann Made Easy   é um sistema de negociação Forex profissional e fácil de usar, baseado nos melhores princípios de negociação usando a teoria do sr. W. D. Gann. O indicador fornece sinais precisos de COMPRA e VENDA, incluindo níveis de Stop Loss e Take Profit. Você pode negociar mesmo em movimento usando notificações PUSH. Entre em contato comigo após a compra para receber instruções de negociação e ótimos indicadores extras gratuitamente! Provavelmente você já ouviu muitas vezes sobre os método
ARIPoint
Temirlan Kdyrkhan
1 (1)
ARIPoint is a powerful trading companion designed to generate high-probability entry signals with dynamic TP/SL/DP levels based on volatility. Built-in performance tracking shows win/loss stats, PP1/PP2 hits, and success rates all updated live. Key Features: Buy/Sell signals with adaptive volatility bands Real-time TP/SL/DP levels based on ATR Built-in MA Filter with optional ATR/StdDev volatility Performance stats panel (Success, Profit/Loss, PP1/PP2) Alerts via popup, sound, push, or email Cu
FX Trend MT5 NG
Daniel Stein
5 (6)
FX Trend NG: A Nova Geração de Inteligência de Tendência Multi-Mercado Visão Geral FX Trend NG é uma ferramenta profissional de análise de tendências e monitoramento de mercado em múltiplos períodos de tempo. Permite compreender a estrutura completa do mercado em segundos. Em vez de alternar entre vários gráficos, você visualiza instantaneamente quais ativos estão em tendência, onde o momentum está enfraquecendo e onde existe alinhamento forte entre diferentes timeframes. Oferta de Lançamento
Antes de tudo, vale ressaltar que esta Ferramenta de Negociação é um Indicador Não Repintante, Não Redesenhante e Não Atrasado, o que a torna ideal para negociação profissional. Curso online, manual do utilizador e demonstração. O Indicador de Conceitos de Ação de Preço Inteligente é uma ferramenta muito poderosa tanto para traders novos quanto experientes. Ele combina mais de 20 indicadores úteis em um único, combinando ideias avançadas de negociação como Análise do Trader do Círculo Interno
Trend Screener Pro MT5
STE S.S.COMPANY
4.85 (104)
Desbloqueie o poder da negociação de tendências com o indicador Trend Screener: sua solução definitiva de negociação de tendências, alimentada por lógica difusa e sistema de múltiplas moedas! Eleve sua negociação de tendências com o Trend Screener, o revolucionário indicador de tendências alimentado por lógica difusa. É um poderoso indicador de acompanhamento de tendências que combina mais de 13 ferramentas e recursos premium e 3 estratégias de negociação, tornando-o uma escolha versátil para to
KT Alpha Hunter Arrows MT5
KEENBASE SOFTWARE SOLUTIONS
A maioria dos indicadores de setas mostra um sinal e deixa você descobrir todo o resto sozinho. O KT Alpha Hunter Arrows entrega um plano de trade completo. Cada seta de sinal aparece com um plano completo já desenhado: linha de entrada, stop loss, quatro níveis de take profit e um veredito de edge em tempo real, indicando se aquele ativo e timeframe valem a pena ser operados naquele momento. O Trade Manager EA incluído cuida da execução depois que você entra na operação, ajudando a manter a dis
Apresentando       Quantum Breakout PRO   , o inovador Indicador MQL5 que está transformando a maneira como você negocia Breakout Zones! Desenvolvido por uma equipe de traders experientes com experiência comercial de mais de 13 anos,       Quantum Breakout PRO       foi projetado para impulsionar sua jornada comercial a novos patamares com sua estratégia de zona de fuga inovadora e dinâmica. O Quantum Breakout Indicator lhe dará setas de sinal em zonas de breakout com 5 zonas-alvo de lucro e su
Gem SIGNAL
Shengzu Zhong
5 (1)
GEM Signal Pro GEM Signal Pro é um indicador seguidor de tendência para MetaTrader 5, desenvolvido para traders que desejam sinais mais claros, setups mais estruturados e uma gestão de risco mais prática diretamente no gráfico. Em vez de mostrar apenas uma seta simples, o GEM Signal Pro ajuda a apresentar a ideia completa da operação de forma mais clara e fácil de entender. Quando as condições são confirmadas, o indicador pode mostrar o preço de entrada, o stop loss e os alvos de take profit no
FX Levels MT5
Daniel Stein
5 (14)
FX Levels: Suporte e Resistência com Precisão Excepcional para Todos os Mercados Visão Geral Rápida Procurando um meio confiável de identificar níveis de suporte e resistência em qualquer mercado—incluindo pares de moedas, índices, ações ou commodities? FX Levels combina o método “Lighthouse” tradicional com uma abordagem dinâmica de vanguarda, fornecendo uma precisão quase universal. Baseado em nossa experiência real com corretores e em atualizações automáticas diárias mais as de tempo real,
Market Structure Order Block Dashboard MT5 é um indicador MT5 projetado para traders que querem ler a estrutura de mercado e as principais zonas de reação do preço diretamente no gráfico. Combina BOS, ChoCH, Order Blocks, Fair Value Gaps (FVG), Liquidez, Kill Zones, Volume Profile e um painel compacto para análise rápida. Este indicador é voltado para traders que usam estrutura de mercado, conceitos ICT e Smart Money como quadro de decisão. Pode ajudar a identificar continuações de tendência, po
FX Power MT5 NG
Daniel Stein
5 (32)
FX Power: Analise a Força das Moedas para Decisões de Negociação Mais Inteligentes Visão Geral FX Power é a sua ferramenta essencial para compreender a força real das principais moedas e do ouro em quaisquer condições de mercado. Identificando moedas fortes para comprar e fracas para vender, FX Power simplifica as decisões de negociação e revela oportunidades de alta probabilidade. Quer você prefira seguir tendências ou antecipar reversões usando valores extremos de Delta, esta ferramenta adap
Btmm state engine pro
Garry James Goodchild
5 (4)
BTMM State Engine Pro is a MetaTrader 5 indicator for traders who use the Beat The Market Maker approach: Asian session context, kill zone timing, level progression, peak formation detection, and a multi-pair scanner from a single chart. It combines cycle state logic with a built-in scanner dashboard so you do not need the same tool on many charts at once. What it does Draws the Asian session range; session times can follow broker server offset or be set in inputs. Tracks level progression (L
Reversal Master for MT5 Reversal Master for MT5 is a non‑repainting reversal indicator for MetaTrader 5. It helps you detect potential market reversal points and shows the maximum favourable price movement after each historical signal, so you can better understand how price behaved after similar situations in the past. The MT5 version keeps the familiar reversal‑signal logic of the original Reversal Master for MT4, but adds improved visualisation, historical statistics and a points summary panel
OrderFlux | Orderflow de Footprint para MetaTrader 5 Versão 2.0 – Visualização Bid/Ask em tempo real para Traders Ativos O OrderFlux é um indicador de footprint e orderflow para MT5. Ele não mostra apenas para onde o preço se moveu, mas o que acontece dentro do movimento: volume de Bid/Ask por nível de preço, delta, imbalance e distribuição de volume. Muitos gráficos mostram apenas o resultado final de uma vela. O OrderFlux mostra o caminho para chegar lá. É exatamente isso que ajuda quando você
Quantum TrendPulse
Bogdan Ion Puscasu
5 (25)
Apresentando   Quantum TrendPulse   , a ferramenta de negociação definitiva que combina o poder do   SuperTrend   ,   RSI   e   Stochastic   em um indicador abrangente para maximizar seu potencial de negociação. Projetado para traders que buscam precisão e eficiência, este indicador ajuda você a identificar tendências de mercado, mudanças de momentum e pontos de entrada e saída ideais com confiança. Principais características: Integração SuperTrend:   siga facilmente a tendência predominante do
Atomic Analyst MT5
Issam Kassas
3.94 (31)
Primeiramente, vale ressaltar que este Indicador de Negociação não repinta, não redesenha e não apresenta atrasos, tornando-o ideal tanto para negociação manual quanto automatizada. Manual do utilizador: configurações, entradas e estratégia. O Analista Atômico é um Indicador de Ação de Preço PA que utiliza a força e o momentum do preço para encontrar uma vantagem melhor no mercado. Equipado com filtros avançados que ajudam a remover ruídos e sinais falsos, e aumentam o potencial de negociação.
RelicusRoad Pro MT5
Relicus LLC
4.96 (24)
RelicusRoad Pro: Sistema Operacional Quantitativo de Mercado 70% DE DESCONTO ACESSO VITALÍCIO (TEMPO LIMITADO) - JUNTE-SE A 2.000+ TRADERS Por que a maioria dos traders falha mesmo com indicadores "perfeitos"? Porque eles operam Conceitos Únicos no vácuo. Um sinal sem contexto é uma aposta. Você precisa de CONFLUÊNCIA . RelicusRoad Pro não é um simples indicador de seta. É um Ecossistema Quantitativo de Mercado completo. Ele mapeia a "Estrada do Valor Justo", distinguindo ruído de rupturas estru
Trend Forecaster
Alexey Minkov
5 (7)
Trend Forecaster – Since 2023. The Trend Forecaster indicator utilizes a unique proprietary algorithm to determine entry points for a breakout trading strategy. The indicator identifies price clusters, analyzes price movement near levels, and provides a signal when the price breaks through a level. The Trend Forecaster indicator is suitable for all financial assets, including currencies (Forex), metals, stocks, indices, and cryptocurrencies. You can also adjust the indicator to work on any time
Meridian Pro
Ottaviano De Cicco
5 (2)
Meridian Pro 2.00: Matriz profissional de tendência multi-timeframe para MT5 Meridian Pro 2.00 é uma matriz de tendência adaptativa profissional para MetaTrader 5. Combina o motor original de tendência Meridian, um ribbon limpo no gráfico, setas de sinal em barra fechada, um dashboard de 8 timeframes, Fuel momentum, consenso ponderado, processamento HTF sintético e linhas de contexto de timeframe superior diretamente no gráfico. O objetivo é simples: ler tendência atual, estrutura multi-timefram
Este painel mostra os últimos   padrões harmónicos   disponíveis para os símbolos seleccionados, pelo que poupará tempo e será mais eficiente /   versão MT4 . Indicador gratuito:   Basic Harmonic Pattern Colunas do indicador Symbol :   aparecem os símbolos seleccionados Trend :   de alta ou de baixa Pattern :   tipo de padrão (gartley, borboleta, morcego, caranguejo, tubarão, cifra ou ABCD) Entry :   preço de entrada SL:   preço de paragem de perda TP1:   preço do 1º take profit TP2:   preço
Smart Structure Concepts MT5
Cristhian Alexander Gaibor Cuasquer
Smart Structure Concepts MT5 é o toolkit SMC institucional mais completo para MetaTrader 5 — com tooltips educativos em 4 idiomas e alertas push em tempo real no instante em que o preço entra numa zona. A maioria dos indicadores SMC desenha caixas e deixa você adivinhando. Este explica cada sinal diretamente no gráfico. Passe o cursor sobre qualquer BOS, CHoCH, Order Block, FVG ou nível de liquidez e veja o que significa e o que fazer a seguir — em inglês, espanhol, português ou francês. O QUE
Mais do autor
MACD with Histogram Color Change
Tiago Azevedo Amorim Martins
This Indicator works as a momentum oscillator however it is most used to surf the trends. Despite of being an oscillator, MACD (Moving Average Convergence/Divergence) doesn't work with over limit conditions (such as OverBought or OverSold). Graphically it's shown as two lines and an histogram with the diference of them. Standard metatrader has this indicator, however with only the two lines and without the histogram. This way it is much easier to read and uderstand it.
FREE
Exponential Moving Average
Tiago Azevedo Amorim Martins
Exponential Moving Average (EMA) Indicator The Exponential Moving Average (EMA) is one of the most widely used indicators in technical analysis. It smooths out price fluctuations to help traders identify market trends more clearly — without being too slow to react to price changes. Unlike the Simple Moving Average (SMA), the EMA gives greater weight to recent prices , making it more responsive to new market information. This makes it ideal for traders who want to detect trend reversals earlier o
FREE
Heikin Ashi Standard
Tiago Azevedo Amorim Martins
5 (1)
This Indicator represents the standard Heikin Ashi Candle converter from normal candles. They are applied on a different chart, so you can identify easily both prices. You can also change candles to your favourite colours. If you want to, you can use this indicator into an iCostum, so you can apply other indicators over this on, because there are excellent indicators combined with this type of candles
FREE
Simple Moving Avg
Tiago Azevedo Amorim Martins
Simple Moving Average (SMA) Indicator The Simple Moving Average (SMA) is one of the most fundamental and widely used tools in technical analysis. It provides a clear visual representation of the market trend by smoothing out price fluctuations over a specified period. Unlike the Exponential Moving Average (EMA) , which reacts more quickly to recent price changes, the SMA gives equal weight to all price points in the calculation, making it ideal for identifying long-term trend direction and re
FREE
Costumized Moving Average
Tiago Azevedo Amorim Martins
This is not a conventional Moving Average Indicator. With this indicator, you can fully costumize your moving average. You can select the "Source" Price (not only the standard prices that come with Metatrader), "Period" of it, and the "Smooth" Calculation that you want to apply. There are many of them, such as SMA (Simple Moving Average), SMMA (Smoothed Moving Average), EMA (Exponential Moving Average), DEMA (Double Exponential Moving Average), TEMA (Triple Exponential Moving Average) and LWMA (
Hull Moving Avg
Tiago Azevedo Amorim Martins
Hull Moving Average (HMA) The Hull Moving Average (HMA) is a refined version of the traditional moving average, designed to minimize lag while keeping the line smooth and precise . Developed by Alan Hull , this indicator provides a faster and more accurate trend signal than standard moving averages such as the SMA or EMA. How It Works The Hull Moving Average uses a Weighted Moving Average (WMA) in a special way to reduce delay and smooth price movement. Its calculation follows three main steps:
STC Colored Pro
Tiago Azevedo Amorim Martins
STC Colored Pro is a powerful implementation of the Schaff Trend Cycle (STC) designed to identify high-probability trend shifts with precision and clarity. This indicator combines momentum and trend analysis to provide clear BUY and SELL signals, helping traders make faster and more confident decisions. Dynamic color visualization (Green = Uptrend, Red = Downtrend) Automatic BUY/SELL signals based on confirmed crossovers Non-repainting logic (signals only after candle close) Built-in
Filtro:
Truta Petru Lucian
443
Truta Petru Lucian 2023.11.03 19:07 
 

O usuário não deixou nenhum comentário para sua avaliação

Responder ao comentário