 MetaTrader 5
 Experts
 Indicadores
 Bibliotecas
 Utilitários
 Widgets
 Regras
Conheça o Mercado MQL5 no YouTube, assista aos vídeos tutoriais
Como comprar um robô de negociação ou indicador?
Execute seu EA na
hospedagem virtual
hospedagem virtual
Teste indicadores/robôs de negociação antes de comprá-los
Quer ganhar dinheiro no Mercado?
Como apresentar um produto para o consumidor final?
Expert Advisors e Indicadores para MetaTrader 5 - 9
 Use robôs de negociação e indicadores para aumentar os rendimentos com a negociação em Forex. Com ajuda de robôs de negociação, você pode automatizar o processo de abertura e fechamento de transações, por outra lado, os indicadores o ajudam a prever com mais precisão o comportamento futuro do mercado.
A página contém um catálogo de aplicativos MetaTrader 5.

Pending Breakout Gold Expert is an automated trading Expert Advisor for MetaTrader 5, designed to identify and execute breakout opportunities in the gold market. Shape Ratio 2.3 ,MDD 1%
The system is built around a pending-order breakout concept and combines market structure recognition, risk control, session filtering, and execution management to help traders participate in the market with more discipline. Best results require the default timeframes together. On one gold account, open five XA

Yellow Fever: Accuracy and Efficiency for MT5 The full list of products is available at the link: https://www.mql5.com/ru/users/pants-dmi/seller In a world of trading where speed and precision are crucial, Yellow Fever stands out as a tool designed for highly accurate market entries. Designed specifically for the MetaTrader 5 (MT5) platform and focused on gold trading ( XAUUSD ), the Expert Advisor offers traders an effective solution for risk management and potential profit maximization. Yellow

## Category and tags
- Category: **Experts** - Tags: `XAUUSD` `gold` `trend following` `volatility targeting` `Kalman filter` `no martingale` `prop firm` `risk management` `systematic` `H1`
## Short description
> Systematic trend book for XAUUSD H1: seven volatility-normalised trend signals incl. a Kalman > filter and a USD factor, volatility-targeted sizing, stop on every position. No martingale, no grid.
---
## Full description
PEREGRINE GOLD QUANT - XAUUSD H1
A systematic trend book

RiskGuard Pro enforces a daily loss limit, a profit lock and a maximum drawdown on your account - across your manual trades and any other EA you run. It does not open trades and it does not predict anything. What it does RiskGuard Pro watches your account equity and enforces three limits you set: Daily loss limit - measured against your start-of-day equity. Daily profit lock - stop trading once the day has gone well enough. Maximum drawdown - measured from your account's peak equity, not from to

3Candle Elder — Multi-Timeframe Confluence Panel
3Candle Elder puts three timeframes side by side in a single on-chart panel and tells you, at a glance, whether they agree. It is built on the bones of one of the most respected frameworks in trading — Dr. Alexander Elder's Triple Screen system — and modernized into a fast, objective, non-repainting dashboard that reads the same way whether you scalp the one-minute or swing the daily. --- Part 1 — The Foundation: Dr. Alexander Elder's Triple Scr

LAUNCH PRICE: $899. The price rises by $100 for every 20 copies sold, up to the final price of $1,499. Every purchase includes lifetime updates and direct support from the developer. ONE EA. FOUR MARKETS. ELEVEN YEARS OF VERIFIED HISTORY. Atlas Quant EA is a fully automated trading portfolio that combines four independent, uncorrelated strategies on the four most liquid and trending assets in the market: Nasdaq 100 (US100/USTEC), Gold (XAUUSD), USD/JPY and Bitcoin (BTCUSD). This is not another s

AURUM CADENCE Systematic Gold (XAUUSD) Expert Advisor — Trend-Following with Disclosed, Tested Risk Management At a Glance Strategy type Trend-following: EMA crossover + RSI momentum filter Instrument tested XAUUSD(£) — IG spread-bet contract Timeframe tuned & validated M15 (runs on other timeframes too — see note below) Risk controls ATR-based stop/target, daily loss limit, volatility filter, weekend-gap guard, hard per-trade margin cap Backtest win rate 50.0% (out-of-sample, previously unseen

WAVY ELLIOTT: THE ARCHITECTURE OF COMPOSURE ON GOLD
The retail gold market is a crucible of noise, panic, and over-trading. Wavy Elliott does not participate in the chaos. It masters the silence. Engineered exclusively for Gold (XAUUSD) on the 4-Hour (H4) timeframe, Wavy Elliott is an institutional-grade quantitative execution engine. Built strictly on top-down Multi-Timeframe (MTF) market structure and classical Elliott Wave cycle principles, this system completely discards lagging retail in

Range Detector Pro ATR-Based Consolidation Zone Indicator with Breakout Markers Overview Range Detector Pro is a professional chart indicator designed to identify and visualize market consolidation zones in real time. It uses an ATR-normalized approach to detect price compression, classify range size, and display the active range directly on the chart. Unlike simple rectangle overlays, this indicator continuously manages the detected zone as price evolves, making it suitable for traders who wan

"Every Gap Tells a Story. RiftFade Pro Reads the Ending Before the Market Writes It." RiftFade Pro is a fully automated Expert Advisor built around one of the most persistent, statistically recurring behaviors in price action: the tendency of markets to return and fill the gaps they leave behind. Where most traders watch gaps form and hesitate, RiftFade Pro identifies them instantly, maps the exact untraded price territory they create, and manages the entire trade lifecycle around the moment pri

Overview EMA Breakout Trend Hunter Pro is a MetaTrader 5 Expert Advisor built for trend expansion / breakout entries using a triple EMA architecture (EMA 20 / 50 / 200) with slope/expansion logic, volatility filtering, and trailing profit protection. Primary instruments: XAUUSD (Gold), with multi-asset focus also covering BTCUSD and ETHUSD where your broker offers stable CFD/crypto execution. Timeframes commonly used: M15 and H4 (validate per symbol). The Pro edition emphasizes regime-aware risk

Plan. Protect. Execute.
RuleCommand Protocol is a trade-planning, risk-control and execution environment for MetaTrader 5. It brings the steps before, during and after an order into one chart interface: market selection, direction, entry, stop loss, target, risk-based position sizing, execution and position management.
Protocol does not replace the trader's judgment and does not guarantee trading results. Its purpose is to make the intended plan visible and to turn that plan into a controlled

VWAP Analytics Advanced Suite for MetaTrader 5
Gain institutional-grade market insight with the VWAP Analytics Advanced Suite , a professional Volume Weighted Average Price indicator built exclusively for MetaTrader 5. This tool goes beyond a simple VWAP line; it is a complete analytical ecosystem designed to identify trend bias, measure market deviation, and provide high-probability entry and exit signals with precision timing. Whether you are a day trader, scalper, or swing trader, this su

️ Candle Timer Advanced Suite for MetaTrader 5
Gain the ultimate edge in precision timing with the Candle Timer Advanced Suite. This is not just a simple countdown; it is a professional-grade analytical tool designed to keep you perfectly synchronized with the market, ensuring you never miss a critical entry or exit due to server lag or misinterpretation. Built specifically for MetaTrader 5, this suite offers unparalleled flexibility, allowing you to visualize time exactly how you need it, acr

Spread & Broker Server Analytics Advanced Suite for MetaTrader 5
Master the fundamental mechanism of market liquidity with the Spread Analytics Advanced Suite, a professional-grade monitoring and alert tool built exclusively for MetaTrader 5. In modern trading, the Bid-Ask spread is your primary transaction cost. This suite provides the transparency and precision required to manage these costs effectively, ensuring you trade only when conditions are optimal.
Designed for scalpers, news trad

# Volume Support Resistance Map - Supports and resistances drawn by volume
*Category: Experimental | Difficulty: intermediate | Window: chart window (overlaid on price) | Markets: Universal (Forex, indices, commodities, crypto, stocks) | Suggested timeframes: M15, M30, H1, H4, D1*
## Short description
> Horizontal bars drawn on the chart, long in proportion to the volume traded at each level: above price the selling volume marking resistances, below it the buying volume marking supports.
##

# Timeframe Divergence Monitor - When horizons disagree
*Category: Multi Timeframe Hybrids | Difficulty: intermediate | Window: separate window below the chart | Markets: Universal (Forex, indices, commodities, crypto, stocks) | Suggested timeframes: M5, M15, M30, H1, H4*
## Short description
> Measures the momentum disagreement between current and higher timeframes, highlighting phases where the two horizons move in opposite directions.
## Full description
### Overview
When the current t

# HTF Level Projector - The levels everyone watches
*Category: Multi Timeframe Hybrids | Difficulty: beginner | Window: chart window (overlaid on price) | Markets: Universal (Forex, indices, commodities, crypto, stocks) | Suggested timeframes: M5, M15, M30, H1, H4*
## Short description
> Projects onto the current chart the high, low and close of the last complete higher period, updating only on period close.
## Full description
### Overview
Yesterday high and low are shared references, no
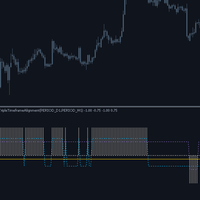
# Triple Timeframe Alignment - Three horizons, one score
*Category: Multi Timeframe Hybrids | Difficulty: intermediate | Window: separate window below the chart | Markets: Universal (Forex, indices, commodities, crypto, stocks) | Suggested timeframes: M5, M15, M30, H1, H4*
## Short description
> Checks whether current, middle and higher timeframes point the same way, showing both the overall score and each horizon direction.
## Full description
### Overview
Full alignment of the three tim

# Higher Timeframe Bias - The higher timeframe without deception
*Category: Multi Timeframe Hybrids | Difficulty: intermediate | Window: separate window below the chart | Markets: Universal (Forex, indices, commodities, crypto, stocks) | Suggested timeframes: M5, M15, M30, H1, H4*
## Short description
> Brings a higher timeframe direction onto the current chart using only already closed bars, avoiding the most insidious form of repaint.
## Full description
### Overview
Multi timeframe ind

# Momentum Thrust Pattern - Thrust, pause, resumption
*Category: Pattern Recognition | Difficulty: intermediate | Window: chart window (overlaid on price) | Markets: Universal (Forex, indices, commodities, crypto, stocks) | Suggested timeframes: M15, M30, H1, H4, D1*
## Short description
> Recognises the thrust, contained pause and resumption beyond the extreme sequence, signalling only once all three phases have completed.
## Full description
### Overview
Directional moves almost always

Stop Blowing Prop Firm Accounts. Start Trading with Institutional Intelligence. The AQ Adaptive Learning EA v4.11 is not a standard "set-and-forget" bot. It is an advanced, self-correcting trading system designed specifically for MetaTrader 5. It combines Machine Learning principles with strict Prop Firm risk management to survive in dynamic market conditions where static EAs fail. Most automated strategies blow accounts because they use fixed rules in a changing market. The AQ Adaptive Learnin
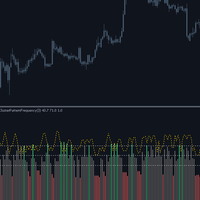
# Cluster Pattern Frequency - Eight sequences and their statistics
*Category: Pattern Recognition | Difficulty: advanced | Window: separate window below the chart | Markets: Universal (Forex, indices, commodities, crypto, stocks) | Suggested timeframes: M30, H1, H4, D1*
## Short description
> Encodes every three bar sequence into one of eight possible configurations and measures the historical frequency of it being followed by an upward move.
## Full description
### Overview
Every three b

Overview Ultimate Hybrid Pro is an advanced automated trading system for MetaTrader 5 that combines the most powerful signal generation techniques from two proven EA families: the Ultimate Confluence Engine and the Liquidity Counter Pro . The result is a multi‑strategy, multi‑symbol robot that leverages candle patterns, swing & crossover, breakout with volume spike, reversal patterns, and Fibonacci retracements – all filtered through a comprehensive confluence scoring system and

# Three Bar Structure Map - Geometry without thresholds
*Category: Pattern Recognition | Difficulty: beginner | Window: separate window below the chart | Markets: Universal (Forex, indices, commodities, crypto, stocks) | Suggested timeframes: M15, M30, H1, H4, D1*
## Short description
> Classifies every three bar group into four geometric configurations, using no arbitrary threshold: two bars either exceed each other or they do not.
## Full description
### Overview
Every group of three co

# Pin Bar Rejection Scanner - Rejection where it matters
*Category: Pattern Recognition | Difficulty: intermediate | Window: chart window (overlaid on price) | Markets: Universal (Forex, indices, commodities, crypto, stocks) | Suggested timeframes: M15, M30, H1, H4, D1*
## Short description
> Recognises bars with a dominant wick but flags them only when they are significant in absolute terms and occur at a recent extreme.
## Full description
### Overview
A bar with a very long wick tells

# Inside Bar Breakout Map - Compression with ready levels
*Category: Pattern Recognition | Difficulty: beginner | Window: chart window (overlaid on price) | Markets: Universal (Forex, indices, commodities, crypto, stocks) | Suggested timeframes: M15, M30, H1, H4, D1*
## Short description
> Counts consecutive inside bars and draws the two breakout levels of the mother bar, holding them fixed while the pattern is active.
## Full description
### Overview
An inside bar, entirely contained wit

# Engulfing Quality Score - Not all engulfings are equal
*Category: Pattern Recognition | Difficulty: intermediate | Window: chart window (overlaid on price) | Markets: Universal (Forex, indices, commodities, crypto, stocks) | Suggested timeframes: M15, M30, H1, H4, D1*
## Short description
> Checks the engulfing pattern and scores it on four additional criteria, flagging only those exceeding the quality threshold.
## Full description
### Overview
The engulfing pattern is among the best k

# Candle Body Anatomy - Candle proportions in numbers
*Category: Pattern Recognition | Difficulty: beginner | Window: separate window below the chart | Markets: Universal (Forex, indices, commodities, crypto, stocks) | Suggested timeframes: M15, M30, H1, H4, D1*
## Short description
> Splits every candle into body and wicks as a percentage of the range and classifies it on explicit numeric thresholds instead of qualitative judgement.
## Full description
### Overview
Traditional candle nam

DELTA ATLAS Orderbook Order-Flow Visualization Dashboard for MetaTrader 5 Futures
A unified, full-screen dashboard for discretionary futures traders that turns the raw order flow into one clear picture. Every executed trade is rendered as volume bubble scrolling across a live liquidity heatmap, read against a real depth-of- market ladder, a live footprint, the session volume profile and cumulative delta — the whole auction, drawn in real time. On top of the tape sits a graded Analyst and a fam

# Level Decay Model - A level that wears out
*Category: Support and Resistance | Difficulty: advanced | Window: chart window (overlaid on price) | Markets: Universal (Forex, indices, commodities, crypto, stocks) | Suggested timeframes: M30, H1, H4, D1*
## Short description
> Assigns each level a strength that decays over time and with every test it undergoes. The level is abandoned once residual strength falls below the threshold.
## Full description
### Overview
A level does not have unl

# Range Boundary Tracker - Edges that do not follow price
*Category: Support and Resistance | Difficulty: intermediate | Window: chart window (overlaid on price) | Markets: Universal (Forex, indices, commodities, crypto, stocks) | Suggested timeframes: M15, M30, H1, H4, D1*
## Short description
> Recognises when the market enters a range, fixes its two extremes and holds them still while the range lasts, as a trader would draw them.
## Full description
### Overview
A channel that follows

# False Breakout Filter - The failed break as a signal
*Category: Support and Resistance | Difficulty: intermediate | Window: chart window (overlaid on price) | Markets: Universal (Forex, indices, commodities, crypto, stocks) | Suggested timeframes: M15, M30, H1, H4, D1*
## Short description
> Watches every break for a fixed number of bars and classifies it only afterwards. A failed break produces an arrow the opposite way, because it is itself a signal.
## Full description
### Overview
E

# Confluence Score Map - Where several references converge
*Category: Support and Resistance | Difficulty: advanced | Window: chart window (overlaid on price) | Markets: Universal (Forex, indices, commodities, crypto, stocks) | Suggested timeframes: M30, H1, H4, D1*
## Short description
> Computes four independent families of levels and draws only the price bands where at least the required minimum number of references converges.
## Full description
### Overview
A level where several inde

# Untested Level Finder - The levels still intact
*Category: Support and Resistance | Difficulty: beginner | Window: chart window (overlaid on price) | Markets: Universal (Forex, indices, commodities, crypto, stocks) | Suggested timeframes: M15, M30, H1, H4, D1*
## Short description
> Draws only the swing levels price has never retested since they formed. A level stops being drawn the moment it is tested.
## Full description
### Overview
A level that has already rejected price three times

# Supply Demand Zone Mapper - Compressed base and decisive departure
*Category: Support and Resistance | Difficulty: intermediate | Window: chart window (overlaid on price) | Markets: Universal (Forex, indices, commodities, crypto, stocks) | Suggested timeframes: M15, M30, H1, H4, D1*
## Short description
> Recognises consolidation bases followed by a decisive move and draws them as zones, which remain until price crosses them fully.
## Full description
### Overview
A demand zone forms wh

# Dynamic Pivot Zones - Pivots as zones, not lines
*Category: Support and Resistance | Difficulty: beginner | Window: chart window (overlaid on price) | Markets: Universal (Forex, indices, commodities, crypto, stocks) | Suggested timeframes: M5, M15, M30, H1*
## Short description
> Turns pivots into zones whose width depends on the previous period volatility. The levels stay fixed for the whole session, with no recalculation.
## Full description
### Overview
Classic pivots are infinitely

# Break Retest Detector - The full sequence, not just the break
*Category: Support and Resistance | Difficulty: intermediate | Window: chart window (overlaid on price) | Markets: Universal (Forex, indices, commodities, crypto, stocks) | Suggested timeframes: M15, M30, H1, H4, D1*
## Short description
> Recognises the full sequence of break, return to the level and reaction. It signals only when all three conditions occur in the correct order.
## Full description
### Overview
Breaking a le

# Round Number Magnet - Do round numbers really matter?
*Category: Support and Resistance | Difficulty: beginner | Window: chart window (overlaid on price) | Markets: Universal (Forex, indices, commodities, crypto, stocks) | Suggested timeframes: M15, M30, H1, H4, D1*
## Short description
> Draws round levels with an automatically computed step and measures how much price actually reacts to them on this specific instrument.
## Full description
### Overview
Round numbers attract orders: st

# Level Strength Ranker - Only the two levels that matter
*Category: Support and Resistance | Difficulty: intermediate | Window: chart window (overlaid on price) | Markets: Universal (Forex, indices, commodities, crypto, stocks) | Suggested timeframes: M30, H1, H4, D1*
## Short description
> Scores every level by number of touches, size of reactions and recency, drawing only the strongest one above and below price.
## Full description
### Overview
Not all levels are equal. A level touched

# Reversal Probability Gauge - Historical frequency by analogy
*Category: Oscillators | Difficulty: advanced | Window: separate window below the chart | Markets: Universal (Forex, indices, commodities, crypto, stocks) | Suggested timeframes: M30, H1, H4, D1*
## Short description
> Searches history for bars with a state similar to the current one and counts in what percentage of those cases price then moved the opposite way. It is an observed frequency, not a forecast.
## Full description
#

# Overbought Duration Tracker - How long the extreme has lasted
*Category: Oscillators | Difficulty: intermediate | Window: separate window below the chart | Markets: Universal (Forex, indices, commodities, crypto, stocks) | Suggested timeframes: M15, M30, H1, H4, D1*
## Short description
> Measures how many bars the oscillator has spent in the extreme zone and compares it with the average duration of past stays. It avoids the error of selling on the first overbought touch.
## Full descript

# Volatility Scaled RSI - Strength separated from volatility
*Category: Oscillators | Difficulty: intermediate | Window: separate window below the chart | Markets: Universal (Forex, indices, commodities, crypto, stocks) | Suggested timeframes: M15, M30, H1, H4, D1*
## Short description
> A relative strength index where every change is normalised by the volatility of its own moment. It measures pure direction instead of a blend of direction and volatility.
## Full description
### Overview

# Extreme Reading Frequency - How rare is this extreme
*Category: Oscillators | Difficulty: intermediate | Window: separate window below the chart | Markets: Universal (Forex, indices, commodities, crypto, stocks) | Suggested timeframes: M15, M30, H1, H4, D1*
## Short description
> Measures how frequently the oscillator has crossed the thresholds over recent bars. A rare extreme is informative, a frequent one is simply that market norm.
## Full description
### Overview
When an oscillator
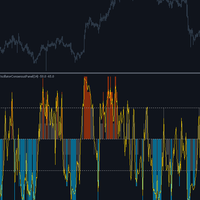
# Oscillator Consensus Panel - Four comparable oscillators
*Category: Oscillators | Difficulty: intermediate | Window: separate window below the chart | Markets: Universal (Forex, indices, commodities, crypto, stocks) | Suggested timeframes: M15, M30, H1, H4, D1*
## Short description
> Computes four oscillators built on different principles and makes them comparable by converting them into percentile ranks, before aggregating them into a consensus measure.
## Full description
### Overview

# Dual Range Oscillator - Two ranges compared
*Category: Oscillators | Difficulty: beginner | Window: separate window below the chart | Markets: Universal (Forex, indices, commodities, crypto, stocks) | Suggested timeframes: M15, M30, H1, H4, D1*
## Short description
> Measures the price position within two ranges of very different length and shows their difference. It separates a move just started from one already mature on every scale.
## Full description
### Overview
Price can sit at t

# Cycle Phase Oscillator - Cycle position in degrees
*Category: Oscillators | Difficulty: advanced | Window: separate window below the chart | Markets: Universal (Forex, indices, commodities, crypto, stocks) | Suggested timeframes: M30, H1, H4, D1*
## Short description
> Expresses the market position in its own cycle as a phase angle from minus one hundred eighty to plus one hundred eighty degrees, with an amplitude measure indicating how reliable the phase is.
## Full description
### Over

# Mean Reversion Pressure - Deviation that actually pays
*Category: Oscillators | Difficulty: advanced | Window: separate window below the chart | Markets: Universal (Forex, indices, commodities, crypto, stocks) | Suggested timeframes: M30, H1, H4, D1*
## Short description
> Measures price deviation from the mean and weights it by the market actual tendency to revert, estimated on recent data. It signals only when the deviation is exploitable.
## Full description
### Overview
It is not en

# Percentile Rank Oscillator - Thresholds that are frequencies
*Category: Oscillators | Difficulty: beginner | Window: separate window below the chart | Markets: Universal (Forex, indices, commodities, crypto, stocks) | Suggested timeframes: M15, M30, H1, H4, D1*
## Short description
> An oscillator based on the percentile rank of price within its own recent distribution. A value of 90 always and everywhere means price is higher than ninety per cent of observations.
## Full description
###

# Liquidity Vacuum Finder - The empty corridors of price
*Category: Volume | Difficulty: advanced | Window: chart window (overlaid on price) | Markets: Universal (Forex, indices, commodities, crypto, stocks) | Suggested timeframes: M15, M30, H1, H4, D1*
## Short description
> Identifies price bands crossed on low volume, where nothing will slow price on its return. It draws the nearest vacuum above and below current price.
### Overview
The concept is the exact complement of the volume prof

# Relative Volume Heatmap - Volume relative to its own hour
*Category: Volume | Difficulty: beginner | Window: separate window below the chart | Markets: Universal (Forex, indices, commodities, crypto, stocks) | Suggested timeframes: M5, M15, M30, H1*
## Short description
> Compares the bar volume with the historical average of the same hour band and colours it on four levels. It spots genuine participation anomalies, not clock effects.
### Overview
Absolute volume is nearly useless on int

# Accumulation Phase Scanner - Compressed range, high volume
*Category: Volume | Difficulty: intermediate | Window: separate window below the chart | Markets: Universal (Forex, indices, commodities, crypto, stocks) | Suggested timeframes: M15, M30, H1, H4, D1*
## Short description
> Recognises accumulation phases by combining three conditions: range compressed versus normal, volume above average and no net price progress.
### Overview
Accumulation has a recognisable signature: price stays

# Effort Versus Result - Four bar categories
*Category: Volume | Difficulty: intermediate | Window: separate window below the chart | Markets: Universal (Forex, indices, commodities, crypto, stocks) | Suggested timeframes: M15, M30, H1, H4, D1*
## Short description
> Classifies every bar by comparing effort, the volume, with result, the range, both as standard scores. Four categories with distinct operational meaning follow.
### Overview
The effort versus result principle is one of the fou

# Volume Divergence Tracker - Price to volume correlation
*Category: Volume | Difficulty: intermediate | Window: separate window below the chart | Markets: Universal (Forex, indices, commodities, crypto, stocks) | Suggested timeframes: M15, M30, H1, H4, D1*
## Short description
> Measures the rolling correlation between the size of price moves and the change in volume. It recognises when movement loses the support of participation.
### Overview
In a healthy market price and volume move tog

# Smart Money Flow Index - Opening versus rest of the day
*Category: Volume | Difficulty: intermediate | Window: separate window below the chart | Markets: Indices | Suggested timeframes: M5, M15, M30, H1*
## Short description
> Separates money flow between the first session hours and the rest of the day, showing their divergence. A time based convention, not a measure of who is trading.
### Overview
There is a long standing observation in equity market analysis: the first part of a sessio

# Volume Weighted Range Profile - Rolling window profile
*Category: Volume | Difficulty: advanced | Window: chart window (overlaid on price) | Markets: Universal (Forex, indices, commodities, crypto, stocks) | Suggested timeframes: M15, M30, H1, H4, D1*
## Short description
> Builds a volume profile on a rolling window and extracts the point of control and value area. Unlike session profiles, it does not reshape itself during the day.
### Overview
The volume profile identifies the levels w

# Volume Climax Detector - The signature of absorption
*Category: Volume | Difficulty: intermediate | Window: chart window (overlaid on price) | Markets: Universal (Forex, indices, commodities, crypto, stocks) | Suggested timeframes: M15, M30, H1, H4, D1*
## Short description
> Recognises climax bars: exceptional volume, wide range but small body, that is price pushing far and coming back. It marks the bars with arrows on the chart.
### Overview
A volume spike alone means nothing: it can a

# Cumulative Delta Proxy - Delta estimated from OHLC and volume
*Category: Volume | Difficulty: intermediate | Window: separate window below the chart | Markets: Universal (Forex, indices, commodities, crypto, stocks) | Suggested timeframes: M5, M15, M30, H1*
## Short description
> Estimates the buyer/seller imbalance from the close position within the range, weighted by volume, accumulating it per session in equivalent imbalance bars.
### Overview
True delta, the difference between volume

# Volatility Shock Decay - Half-life of post-shock recovery
*Category: Volatility | Difficulty: advanced | Window: separate window below the chart | Markets: Universal (Forex, indices, commodities, crypto, stocks) | Suggested timeframes: H1, H4, D1*
## Short description
> Estimates the persistence coefficient of volatility and derives its half-life, how many bars a deviation from normal needs to halve. It also shows the size of the current shock.
### Overview
When volatility explodes, the

# Downside Upside Vol Ratio - Risk asymmetry
*Category: Volatility | Difficulty: intermediate | Window: separate window below the chart | Markets: Universal (Forex, indices, commodities, crypto, stocks) | Suggested timeframes: H1, H4, D1*
## Short description
> Computes two separate semi-deviations, one on negative returns only and one on positive ones, and reports their proportion. It measures an asymmetry standard deviation conceals.
### Overview
Standard deviation treats an upward and a

# Intraday Volatility Seasonality - Hourly volatility profile
*Category: Volatility | Difficulty: intermediate | Window: separate window below the chart | Markets: Universal (Forex, indices, commodities, crypto, stocks) | Suggested timeframes: M5, M15, M30, H1*
## Short description
> Builds the instrument average hourly volatility profile and compares it with the actual range of the current bar. It separates normally quiet hours from genuine anomalies.
### Overview
Intraday volatility is n

# Compression Expansion Detector - Squeeze and release
*Category: Volatility | Difficulty: intermediate | Window: separate window below the chart | Markets: Universal (Forex, indices, commodities, crypto, stocks) | Suggested timeframes: M15, M30, H1, H4, D1*
## Short description
> Measures how far short term volatility has narrowed relative to the reference, counts how many bars the compression has lasted and highlights the bars following the release.
### Overview
Volatility is not stable:

# Volatility Breakout Projection - Levels projected from the open
*Category: Volatility | Difficulty: beginner | Window: chart window (overlaid on price) | Markets: Universal (Forex, indices, commodities, crypto, stocks) | Suggested timeframes: M5, M15, M30, H1*
## Short description
> Anchors a reference to each session open and projects two pairs of levels computed as fractions of the average daily range. Levels stay fixed for the whole session.
### Overview
If an instrument covers on ave

# Overnight Gap Risk - The risk stops cannot cover
*Category: Volatility | Difficulty: intermediate | Window: separate window below the chart | Markets: Stocks | Suggested timeframes: H1, H4, D1*
## Short description
> Splits each bar change into gap and intra-bar movement, and reports the share of risk attributable to gaps, the part no stop can protect against.
### Overview
The risk of a position held past the close is not the same as that of the same position closed intraday, and the dif

# Garman Klass Volatility - An estimator using the whole OHLC
*Category: Volatility | Difficulty: advanced | Window: separate window below the chart | Markets: Universal (Forex, indices, commodities, crypto, stocks) | Suggested timeframes: M15, M30, H1, H4, D1*
## Short description
> A volatility estimator using open, high, low and close instead of closes only. Its ratio to the classic estimate separates intra-bar movement from close-to-close movement.
### Overview
The standard deviation o

Relative Volume Profile (RVP) Stop guessing where the smart money is trading. See the exact price levels that matter. Overview Traditional Volume Profiles tell you where volume occurred, but they leave out a crucial piece of the puzzle: intensity . The Relative Volume Profile (RVP) is a next-generation charting tool that fuses standard price profiling with Relative Volume (RVOL) analysis. Instead of drawing plain, monotone blocks, RVP color-codes every single price level based on aggressive buyi

# Volatility Regime Classifier - Classification with hysteresis
*Category: Volatility | Difficulty: intermediate | Window: separate window below the chart | Markets: Universal (Forex, indices, commodities, crypto, stocks) | Suggested timeframes: M15, M30, H1, H4, D1*
## Short description
> Classifies volatility into four regimes using a hysteresis state machine, eliminating the constant flipping typical of fixed thresholds. The active threshold is drawn.
### Overview
Classifying volatility

# Volatility Forecast EWMA - Forecasting the next bar
*Category: Volatility | Difficulty: advanced | Window: separate window below the chart | Markets: Universal (Forex, indices, commodities, crypto, stocks) | Suggested timeframes: M15, M30, H1, H4, D1*
## Short description
> Estimates next bar volatility with an EWMA model on variance, the same scheme used in portfolio risk management, alongside the volatility actually observed.
### Overview
Every volatility indicator looks backwards and

# Realized Volatility Cone - Historical volatility percentiles
*Category: Volatility | Difficulty: intermediate | Window: separate window below the chart | Markets: Universal (Forex, indices, commodities, crypto, stocks) | Suggested timeframes: M30, H1, H4, D1*
## Short description
> Draws realized volatility together with the percentiles of its own historical distribution. It tells whether the current level is high or low for that specific instrument.
### Overview
Knowing that realized vo

# Momentum Entropy Filter - Order versus randomness in thrusts
*Category: Momentum | Difficulty: advanced | Window: separate window below the chart | Markets: Universal (Forex, indices, commodities, crypto, stocks) | Suggested timeframes: M30, H1, H4, D1*
## Short description
> Computes the Shannon entropy of the recent momentum distribution and converts it into an order score from 0 to 100. It separates markets with recurring structure from those without regularity.
### Overview
Shannon e
O Mercado MetaTrader é a única loja onde você pode baixar um robô demonstração de negociação gratuitamente para testes e otimização usando dados históricos.
Leia a visão geral e opiniões de outros clientes sobre os aplicativos, faça o download para o seu terminal e teste um robô de negociação antes de comprá-lo. Apenas no Mercado MetaTrader você pode testar um aplicativo de forma absolutamente gratuita.

Você está perdendo oportunidades de negociação:
- Aplicativos de negociação gratuitos
- 8 000+ sinais para cópia
- Notícias econômicas para análise dos mercados financeiros
Registro
Login
Você concorda com a política do site e com os termos de uso
Se você não tem uma conta, por favor registre-se