Conheça o Mercado MQL5 no YouTube, assista aos vídeos tutoriais
Como comprar um robô de negociação ou indicador?
Execute seu EA na
hospedagem virtual
hospedagem virtual
Teste indicadores/robôs de negociação antes de comprá-los
Quer ganhar dinheiro no Mercado?
Como apresentar um produto para o consumidor final?
Pagamento de Indicadores Técnicos para MetaTrader 4 - 65

Indicator function This index buys and sells according to the color, using time is one hour,Please run the test on a 30-minute cycle It is best to use 1H for testing About update questions In order to be more suitable for market fluctuations, the company regularly updates the indicators Product cycle and trading time applicable to indicators Applicable mainstream currency pair EUR/USD GBP/USD NZD/USD AUD/USD USD/JPY USD/CAD USD/CHF Applicable mainstream cross currency pair EUR/JPY EUR/GBP E

It will be the best tool for you to make a profit! Through unique algorithms You're going to see an amazing amount of right trading signals Make huge profits every day and realize more possibilities! Like the car no money to buy it, the love of the girls dare not to pursue?Or the credit card bill is not paid, the rent does not have the extra money to settle?Or are you fed up with being bossed around by your boss and Hope to get more people's respect?Can't afford to buy the things you want ? wa

Indicator function Buy and sell by indicator color It is best to use 1H for testing About update questions In order to be more suitable for market fluctuations, the company regularly updates the indicators Product cycle and trading time applicable to indicators Applicable mainstream currency pair EUR/USD GBP/USD NZD/USD AUD/USD USD/JPY USD/CAD USD/CHF Applicable mainstream cross currency pair EUR/JPY EUR/GBP EUR/CHF EUR/CAD EUR/NZD AUD/CAD AUD/NZD AUD/CHF AUD/JPY GBP/JPY GBP/CHF NZD/JPY App

Indicator function Moving averages cross a short-term buy and sell, moving averages cross a 50 horizontal line a long-term buy and sell It is best to use 1H for testing About update questions In order to be more suitable for market fluctuations, the company regularly updates the indicators Product cycle and trading time applicable to indicators Applicable mainstream currency pair EUR/USD GBP/USD NZD/USD AUD/USD USD/JPY USD/CAD USD/CHF Applicable mainstream cross currency pair EUR/JPY EUR/GB

Leave a review for this product, and receive another "Free" product that you choose. You can see my other products here: https://www.mql5.com/en/users/zakri/seller
Trend Detective is an advanced trend detection indicator which shows accurate entry points in direction of trend. It uses smart technology in order to detect entry points, trend changing points, and TP points. It also shows hit rate for current chart using selected parameters. Hit rate for this indicator on different charts can be

Think of an Experienced Traders’ Brain as a blueprint for a trading algorithm. Then the desire to keep charts as clutter free as possible. What you see below is a blueprint of Paul Bratby’s thought process but even he admits, he is getting too old to focus on all of these! • 9 Decision Points before Paul considers grading the trade a 3* trade
• Then another special Decision Point will make it a 4* trade
• Another for 5* trade
• And Finally, a total of 12 Decision Points being correct before
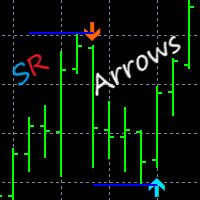
This indicator gives you arrows, two SR lines and a white trend line. Uses a special trend algorithm to plot the arrows, combined with support and resistance inputs. Perfect for channel trading. Features alert functions.
Parameter TrendArrowPeriod. Parameter TrendLinePeriod. (Change to your preference) How to use: Simply attach to any chart with default settings. Zoom in the chart, to see the two blue SR lines and arrows more clearly. It is very important to wait for a new blue SR line to appea

The peculiarity of Star 4D is the presence of a signal for entry / exit - the indicator line denotes "buy" or "sell" signals in a certain color. The accuracy of this signal is quite acceptable, see and judge for yourself. Star 4D is also good for getting out of position. The indicator almost completely captures the trend, but filters must be used during a flat. When entering a position, you will always follow the trend. This great property makes Star 4D more attractive.
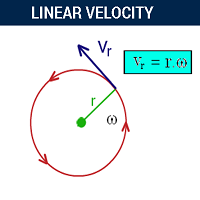
LinearVelocity Indicator
Velocity is Distance/Time where Distance is Close-Open basicly. Linear velocity; calculated with tick volume*Velocity in smoothed way. Red line shows LinearVelocity based of zero level in that way. And Magenta line is Moving avrages of LinearVelocity. Final Indicator helps you detecting trend in different timeframes. Default input parameters for M5 timeframe, and you can change them for different timeframes and different pairs. I wish you good profits.
The indicator represents 2 lines of different periods: one line is short-term (red line), the other is long-term (blue line). Each of the lines is a hard Moving Average, weighted by many parameters. Accordingly, you need to trade according to chart volatility. For convenience, the indicator has been added moving averages of the High, Low, Median ((High-Low) / 2) periods.
Input parameters:
IndicatorPeriod: several periods (general- general period, calculation for all periods; small- short-te

The indicator sets two bells at the planned levels. The upper bell is set above Ask price and lower bell is below Bid price. You can set both or one of them. When the level is exceeded, indicator emit a single sounds. Sound is emit with every arriving tick. In fast arrivals of Tick, the sounds is continuously. The bells are initially entered manually in the input window. They can be modified by moving the set of lines in chart. It is good practice top bell set slightly below valid level

Indicator function Select a trend based on the Angle above and below the indicator curve, and choose overbought and oversold when an action crosses the trend line It is best to use 1H for testing About update questions In order to be more suitable for market fluctuations, the company regularly updates the indicators Product cycle and trading time applicable to indicators Applicable mainstream currency pair EUR/USD GBP/USD NZD/USD AUD/USD USD/JPY USD/CAD USD/CHF Applicable mainstream cross c

This is an indicator with real-time reminder function, which can realize real-time monitoring of four harmonic patterns of multiple cycles (30 minute chart, 1 hour chart, 4 hour chart, 1 day chart), and help traders to have insight into market reversal opportunities. Gartly Bat Butterfly Cypher Before loading into the chart, you need to manually input the switch parameters, which are the harmonic patterns and time period you want to monitor: M30 / H1 / H4 / D1. It is on when the corresponding

TDI Signals generates buy and sell arrows based on a TDI(Traders Dynamic Index) algorithm. It looks for price breakouts, continuations and reversals. By default it runs in the trend mode but user is provided with the option to change that to reversal mode. Trader can use the mode which compliments his/her trading style.
Usage:- TDI Signals can be used as a stand alone indicator with context or even be added to strategies to make confirmations more strong. Volatility based stop loss, take pr

Indicator function Choose buy and sell at horizontal line 0 It is best to use 1H for testing About update questions In order to be more suitable for market fluctuations, the company regularly updates the indicators Product cycle and trading time applicable to indicators Applicable mainstream currency pair EUR/USD GBP/USD NZD/USD AUD/USD USD/JPY USD/CAD USD/CHF Applicable mainstream cross currency pair EUR/JPY EUR/GBP EUR/CHF EUR/CAD EUR/NZD AUD/CAD AUD/NZD AUD/CHF AUD/JPY GBP/JPY GBP/CHF NZ
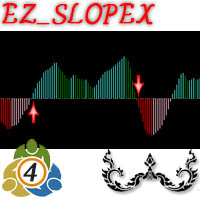
EZ Slope X is an Oscillator Indicator very easy to used just look at the Indicator and the base line (Zero line)
Trade Setup for Trend follow : - when the indicator is above 0 is gone Buy. - when the indicator is below 0 is gone Sell.
Trade Setup for Swing Trade : Bullish Market : - Open Buy when the indicator turn Light Green color. - Close Buy when the indicator turn Dark Green color. Bearish Market : - Open Sell when the indicator turn to Red color. - Close Sell when the indicator turn

Indicator function Buy and sell at the 0.19 threshold.Notice that the level number is 0.19! It is best to use 1H for testing About update questions In order to be more suitable for market fluctuations, the company regularly updates the indicators Product cycle and trading time applicable to indicators Applicable mainstream currency pair EUR/USD GBP/USD NZD/USD AUD/USD USD/JPY USD/CAD USD/CHF Applicable mainstream cross currency pair EUR/JPY EUR/GBP EUR/CHF EUR/CAD EUR/NZD AUD/CAD AUD/NZD AU

Are you looking for a powerful tool to analyze currency strength and identify the best trading opportunities? Look no further than the Currency Strength Indicator. Our easy-to-use tool offers a wide range of features that will help you professionally define weak and strong currency pairs, so you can make informed trading decisions with ease. One of the most significant benefits of our indicator is the ability to select up to 10 currencies for monitoring. And the currencies are not limited to fi

Indicator function Choose to go long or short when crossing the EMA or crossing the 0 line below It is best to use 1H for testing About update questions In order to be more suitable for market fluctuations, the company regularly updates the indicators Product cycle and trading time applicable to indicators Applicable mainstream currency pair EUR/USD GBP/USD NZD/USD AUD/USD USD/JPY USD/CAD USD/CHF Applicable mainstream cross currency pair EUR/JPY EUR/GBP EUR/CHF EUR/CAD EUR/NZD AUD/CAD AUD/N

Indicator function Please set the level line with a value of 0 and buy and sell at the level line of 0 It is best to use 1H for testing About update questions In order to be more suitable for market fluctuations, the company regularly updates the indicators Product cycle and trading time applicable to indicators Applicable mainstream currency pair EUR/USD GBP/USD NZD/USD AUD/USD USD/JPY USD/CAD USD/CHF Applicable mainstream cross currency pair EUR/JPY EUR/GBP EUR/CHF EUR/CAD EUR/NZD AUD/CAD

Indicator function Choose to buy and sell according to the system prompts It is best to use 1H for testing About update questions In order to be more suitable for market fluctuations, the company regularly updates the indicators Product cycle and trading time applicable to indicators Applicable mainstream currency pair EUR/USD GBP/USD NZD/USD AUD/USD USD/JPY USD/CAD USD/CHF Applicable mainstream cross currency pair EUR/JPY EUR/GBP EUR/CHF EUR/CAD EUR/NZD AUD/CAD AUD/NZD AUD/CHF AUD/JPY GBP/

Indicator function Choose to buy and sell where the EMA crosses
It is best to use 1H for testing About update questions In order to be more suitable for market fluctuations, the company regularly updates the indicators Product cycle and trading time applicable to indicators Applicable mainstream currency pair EUR/USD GBP/USD NZD/USD AUD/USD USD/JPY USD/CAD USD/CHF Applicable mainstream cross currency pair EUR/JPY EUR/GBP EUR/CHF EUR/CAD EUR/NZD AUD/CAD AUD/NZD AUD/CHF AUD/JPY GBP/JPY GBP/

Indicator function Choose to buy and sell where the yellow EMA crosses zero It is best to use 1H for testing About update questions In order to be more suitable for market fluctuations, the company regularly updates the indicators Product cycle and trading time applicable to indicators Applicable mainstream currency pair EUR/USD GBP/USD NZD/USD AUD/USD USD/JPY USD/CAD USD/CHF Applicable mainstream cross currency pair EUR/JPY EUR/GBP EUR/CHF EUR/CAD EUR/NZD AUD/CAD AUD/NZD AUD/CHF AUD/JPY GB
indicator for trading in the forex markets and others. Complete absence of redrawing.
recommendations and with default period. conservative trading method take profit 50 pips stop loss 80-100 pips closing deals by take profit - stop loss or by the opposite signal aggressive trading method take profit 100 pips stop loss 100 pips closing deals by take profit - stop loss or by the opposite signal the signal is sent to the current candle at the moment of its appearance there is a sound alert and

Indicator function Choose to buy and sell where the yellow moving average crosses zero. Arrow for overbought oversold reference only The indicator is suitable for the best time period of 1H
About update questions In order to be more suitable for market fluctuations, the company regularly updates the indicators Product cycle and trading time applicable to indicators Applicable mainstream currency pair EUR/USD GBP/USD NZD/USD AUD/USD USD/JPY USD/CAD USD/CHF Applicable mainstream cross currenc
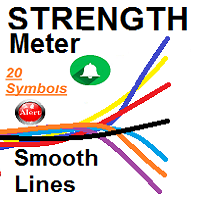
Currencies Strength Meter Smooth Lines Currencies Strongest Weakest SMOOTH STRENGTH METER INDICATOR (SMOOTH LINE) it draws Currencies TREND Volatility Power / Strength lines : - Detects the 2 highly TRENDED Volatile pairs ( will be the Bold Lines ) - A very Helpful Indicator - It draws smooth lines for up to 20 currencies pairs representing Volatility strength and power - First it indicates the most powerful trended direction pairs : Strongest / Weaker - MAIN FUNCTION :i
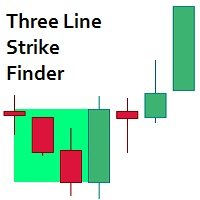
The three line strike pattern, which consists of three bullish or bearish candles, and a fourth candle that is larger than the previous three in the opposite direction, can be traded many ways. This indicator simply highlights those previous trades, and then pushes out targets in the direction of the last candle.
Advantages of three line strike The three line strike can be traded as part of a bullish and bearish engulfing pattern, 2 bar reversal set up and n-Bar rallies and declines.
How it
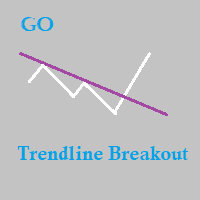
GO Trendline Breakout indicator is designed to find the breakouts of trendlines in the direction of the trend. Feel free to check out my other products here : https://www.mql5.com/en/users/gyila.oliver/seller#products
the indicator implements a unique trend detection algorithm, and finds the trendlines from swing highs/lows/ The indicator implements visual alerts and push notifications.
The indicator can be used on any currency pair / stocks/ indices and on any timeframe.
How to use t
Leave a review for this product, and receive another "Free" product that you choose. You can see my other products here: https://www.mql5.com/en/users/zakri/seller
Harmonic Patterns Detector indicator draws harmonic patterns on chart. Harmonic patterns have a high hit-rate of around 80% and are excellent for trade entries. They are used as price reversal points. Some of them have a long history of usage and were created by famous traders like H. M. Gartley. Many harmonic patterns are included

This indicator computes a channel around the price based on highs and lows of the previous bars (whose number is set by user). The indicator provides alerts when upper or lower channel bands are crossed by closing price. User can receive a standard alert on MT4 and/or a push notification on Metatrader app. User can configure the indicator through the following parameters: InpPeriod - number of previous bars UseAlert - if set to True, enables visual alert on the display UsePush - if set to Tr
This indicator computes two lines representing the price bar strength. Close, high and low of each bar are compared with the highest high and lowest low of the last N bars, where N is a parameter set by user. Two lines are computed, a red one and a green one, with values between 0 and 100. High values of the red line means that close is very far from the bar high, while high value of the green line means price is very far from the bar low . The indicator provides alerts when red or green line a

FXC iMACD-DivergencE MT4 Indicator
This is an advanced MACD indicator that finds trend-turn divergences on the current symbol. The indicator detects divergence between the MACD and the price movements as a strong trend-turn pattern.
Main features: Advanced divergence settings
Price based on Close, Open or High/Low prices Give Buy/Sell open signals PUSH notifications
E-mail sending Pop-up alert Customizeable Information panel Input parameters: MACD Fast-EMA: The Fast-EMA variable of the MACD
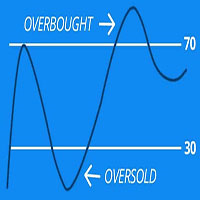
Scan all your favorite pairs with RSI, and get notified on your preferred time frames.
Settings are Customizable
Click to change time frame or open new pairs
Notification: Phone/Popup/Email The relative strength index (RSI) is a technical indicator used in the analysis of financial markets. It is intended to chart the current and historical strength or weakness of a pair/stock based on the closing prices of a recent trading period. The RSI is most typically used on a 14 period, measured o
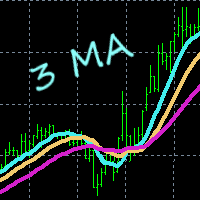
This indicator gives you a modified version of three Moving Averages. Great for scalping. Does not feature any alerts, and is best used manually after confirming multi line displays. Settings: Period1 Period2 Period3 Period4 How to use: Simply attach to any chart with default settings. Buy when the 4 lines converge below the price. Sell when the 4 lines converge above the price. Take note of the slope of Period4. See example pictures below. Best results when looking at three or more time frame
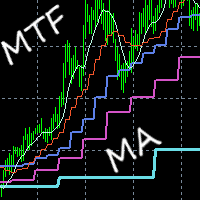
This indicator displays a modified version of Moving Averages for multiple time frames: Current (TF indicator is attached to), M5, M15, M30, H1, H4, Daily, Weekly and Monthly. NB: Make sure to download currency history before testing and use. No need to set up the indicator. Features an audible alert function for the current chart's line. How to use: Simply attach to M5 chart. Hover over the lines to see the line's time frame. Buy when more than two MTF lines cross closely together below the pri

A reliable and profitable tool in the right hands For binary options with expiration time in one candle of the traded timeframe Money management recommended Martingale in 1 or 2 knees Example First deal 1 dollar If the deal loses Second trade $ 3 Profit 2 knee option The second trade loses Third deal $ 9 Profit. All the following transactions after the 3rd one you open at your own risk In the case of small deposits, it is recommended to use only 1 knee of Martingale Up arrow buy Down arrow sale
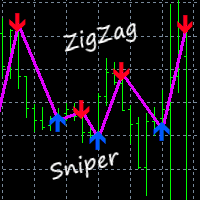
This indicator gives you a modified ZigZag, combined with a special algorithm. Great for scalping. Perfect for channel trading. Parameter TrendPeriod. Features alert functions. How to use: Simply attach to any chart with default settings. Buy when the line crosses below the price, and blue arrow. Sell when the line crosses above the price, and red arrow. It helps to keep the audible alert set to true. Best results when checking two or more timeframes before entering trades. (See comment #1 for

DMAX SIGNAL IS VERY POWERFUL TOOL TO HELP YOU ENTRY,ITS CAN DETECT OVERSOLD AND OVERBOUGHT IN FOREX MARKET. ITS CAN TRADE 24 FOREX PAIR IN MARKET, 80% ACCURATE RESULT. MANY TRADER FAIL BECAUSE OF ENTRY POINT AND EXIT POINT , SIGNAL OF DMAX WILL GIVE VERY GOOD SIGNAL TO LET YOU KNOW WHERE TO ENTRY AND EXIT. RISK MANAGEMENT IS VERY IMPORTANT IN TRADING FOREX, PLEASE DONT RISK OVER 5% PER TRADE IS FORE MARKET
The Average True Range (ATR) is a tool to measure volatility. ATR MTF (Multi Time Frame) indicator provides all timeframe trends helps to identify in which kind of volatility environment the market .This indicator can be used with any Trading Systems for additional confirmation of trading entries or exits. It is a very helpful tool to calculate Targets and Stops according the current market conditions.

bull and bear filter helps you choose the most tradable currencies, saves most of you time,so you can focus on trading instead of filtering the tradable currencies exhaustedly. 1. It works in the main chart window, the red currency pair means it's bear market, green mean bull market, white means the currencies are not filtered,neither bull nor bear, they are invisible if the chart background is white. 2. the main chart timeframe has no impact on filtering, it's based on the variable you assign i

O indicador EasyWayTradePanel para MetaTrader4 é um assistente de negociação para negociação manual em qualquer moeda em FOREX , CRYPTOCURRENCY como Bitcoin, Ethereum, Lightcoin,Ripple e mais. Também é EasyWay para usar para COMMODITY como Gold, Silver, Oil, Gas ...... e CFDs . Quando instalado no gráfico em seu período de tempo e ferramenta de negociação escolhidos, o indicador desenha automaticamente os seguintes indicadores personalizados usados na estratégia de negociação EasyWayTradePan
GO Breakout and Retest is probably the best price action indicator you can currently find on the market. Designed for price action traders and not only, the indicator helps you spot retests after breakouts of supply / demand zones.
After purchase, leave a review, a comment or make a screenshot of your purchase and contact me to receive for free the Trade Entry Manager utility !
Please read the full description of the product in order to use the indicator properly !
Feel free to check out
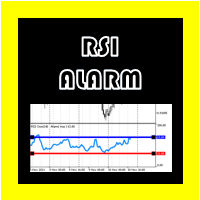
ALARME RSI (para Metatrader 4)
Este indicador funciona como um RSI normal com todas as suas configurações (periodicidade, cores, níveis, etc),
mas, adicionalmente, os alarmes podem ser definidos no nível superior e inferior (Exemplo 70 e 30), com a possibilidade de ajustar esses níveis movendo as linhas superior e inferior encontradas no indicador.
Você também pode ativar e desativar uma função adicional que coloca uma seta no gráfico quando o RSI superior ou inferior esperado é atingido.
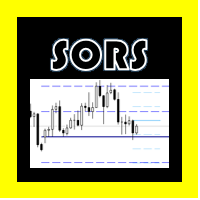
THE SORS COMPLEXES (For Metatrader 4) This indicator is designed to draw the SORS lines on the graph, these are the modern way of calculating market points that it usually respects, they are comprised of supports and resistance, but unlike the classics, these are calculated from volatility endogenous and standard deviation, In the configuration you can change the color of each level linear and hide the ones that are not needed. A = Annual. M = Monthly. W = Weekly D = Daily.

Ao analisar séries temporais financeiras, os pesquisadores geralmente fazem uma suposição preliminar de que os preços são distribuídos de acordo com a lei normal (Gaussiana). Essa abordagem se deve ao fato de que um grande número de processos reais pode ser simulado usando a distribuição normal. Além disso, o cálculo dos parâmetros desta distribuição não apresenta grandes dificuldades. No entanto, quando aplicada aos mercados financeiros, a distribuição normal nem sempre funciona. Os retornos do
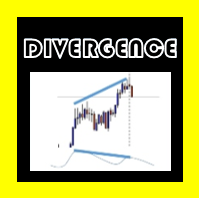
DIVERGENCE OSW (Para Metatrader 4)
Este indicador funciona em divergências e tem as seguintes funções:
Gere um alerta quando ocorrer uma divergência. Crie linhas calculando o Stoploss e Takeprofit de acordo com ondas de projeção de ondas inversas. Crie uma seta indicando a possível direção do mercado. Os sinais enviados pelo indicador são dados quando a vela termina. O Trader deve avaliar cada divergência para aceitar as entradas. Definições:
Ativação e desativação de alertas. Intervalo d

PRICE Direction Predictor Indicator (LOW BUY PRICE 4 Limited time) This Indicator provides Buy/Sell Signal based on calculations on Higher frame (main Trend) and Lower frame(Entry signals) * You should select the higher and lower frame for indicator calculations * You select the Trend line colors as you prefer * Enable or disable Alerts! Trend lines UP/Down are drawn when a trend is detected Wait for small arrows for entry : *Normally an UP arrow in an UP Trend is a BUY signal : ---you Close
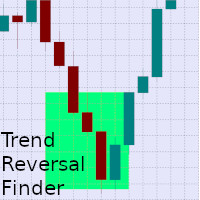
Listed in his faous book "Trading chart patterns like the pros", Suri Duddrella outlines the N-bar rally and decline reversal pattern, which simply states that when stocks make a new high or new low, momentum players will push this stock down or up until eventually they run out of steam. This indicator will look back a certain number of bars to find a continuous uninterrupted rally or decline. Once found, the pattern will look forwards to find the first bar that closes, within a certain range,

Signal trend indicator.
Detects the direction of the trend and is coloured accordingly.
Has built in audible and visual alerts when trends change.
Can send notifications to your phone or email.
Allows Trend and Counter-Trend trading.
Works on all timeframes, all currency pairs, metals, indices and cryptocurrencies.
Can be used with binary options.
Distinctive features No re-drawing; Simple and clear settings; Four types of alerts; Works on all timeframes and all trading tools; Su

A huge overhaul and improvement on the highly successful Three Line Strike Finder https://www.mql5.com/en/market/product/60396?source=Site+Profile+Seller This fantastic tool will scan your selected timeframes, and display new three line strike patterns as they appear. No more having to flip through different timeframes to check if a new three line strike pattern has emerged. The supported timeframes are, the current timeframe, 15 minute, 30 minute, 1 hour, 4 hour and Daily, all of which can be

COMMERCIAL SESSIONS This indicator shows in the selected graph divided by tables each of the sessions ASIA, JAPAN, LONDON, NEW YORK: Allows you to configure: Session Color ASIA, JAPON, LONDRES, NEW YORK Hide and show each session It works in the lowest timeframes on the market, among which H4, H1, M15, M5 and M1 are recommended. (Don't forget to check out our other indicators)
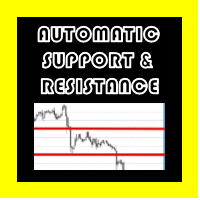
Suporte Automático e Resistência Osw MT4
Este indicador representa graficamente as linhas nos possíveis pontos de suporte e resistência do ativo selecionado.
atua em múltiplas temporalidades.
permite que você configure:
Cor das linhas. Largura das linhas. Tipo de linhas. Quando o indicador inicia seu funcionamento, ele analisa os apoios e resistências de níveis superiores para a temporalidade em que está trabalhando.
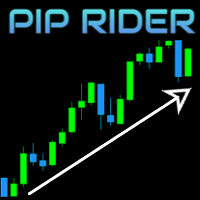
Tired of looking at indicator cluttered charts? Are you a trend trader? I have just the solution for you. Trend Boss.
This indicator allows you to choose some of the most popular trend identifiers such as CCI(Supertrend) or Ichimoku and pair them with some of the most popular entries such as Kijun/Tenkan cross or MACD zero cross. You can now keep your charts clean by hiding all those oscillators and moving averages. Only arrows will be displayed depending on your entry criteria.
Trend filt

The use of indicators is extremely simple and does not contain future functions.
The use of indicators is divided into the following simple parts:
1. The indicator is blue (upward trend) -> only buy orders
2. The indicator is pink (downtrend) -> only sell orders
3. The indicator is white (consolidation trend) -> only wait and see without send orders
4. The price is above the indicator -> Only buy orders can be made
5. The price is below the indicator -> only sell orders
To sum

This indicator needs to be used in conjunction with the " Souline Honma Surf " indicator to achieve a higher winning rate.
The use of indicators is extremely simple and does not contain future functions.
The use of Souline honma wave indicators is divided into the following simple parts:
1. The indicator is blue (upward trend) -> only buy orders
2. The indicator is pink (down trend) -> only sell orders
The use of the Souline Honma Surf indicator is divided into the following parts

FOREX KISS is an indicator that picks out reversal/turning points , it is a combination of levels , clusters and volumes , works on all time frame and all instruments. While doing the paper works which took me 5 years, my aim was to build something that will give me consistent profit all over again while keeping it simple and stupid. My hope that this indicator will bring you confidence and precision.

Os modelos de regressão descrevem a relação entre as variáveis ajustando uma linha aos dados observados. Os modelos de regressão linear usam uma linha reta, enquanto os modelos de regressão logística e não linear usam uma linha curva. A regressão permite estimar como uma variável dependente muda à medida que a(s) variável(is) independente(s) muda(m).
A regressão linear simples é usada para estimar a relação entre duas variáveis quantitativas.
Este indicador calcula a diferença de dois c
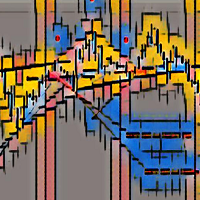
This is the one and only chart pattern indicator you need in your MT4 arsenal to for detection, showcasing and alerting for the following well-known chart patterns:
Bullish Flag Bearish Flag Bullish Pennant Bearish Pennant Bullish Cup With Handle Bearish Cup With Handle Bullish Ascending Triangle Bearish Descending Triangle Bullish Symmetrical Triangle Bearish Symmetrical Triangle Bullish Measured Move Up Bearish Measured Move Down Bullish Ascending Scallop Bearish Descending Scallop Bullish 3

Trend formation channel is a set of lines. The two central lines of the indicator represent moving averages of the specified type and period, they also form a small channel. The large channel is formed - the central lines of the indicator plus / minus the standard deviation estimate, multiplied by the coefficient selected by the user. The basic rule for plotting is that about 5% of prices should be outside these lines, and 95% - inside. If the price crosses the upper or lower line too often, th

We are an analytics company that believe in solving complicated problems with simple solutions using data. To minimize the complexities of trading, we have created a range of trading advisory products from the essence of our proprietary STAR System to enhance trading aptitude and to guide users into becoming proficient traders.
Our innovative products capitalizes on 3 core functions – Big Data, Artificial Intelligence, and Technical Expertise and it is with this core, we reshape the world
Negociar na direção de uma tendência forte reduz o risco e aumenta o potencial de lucro. Em geral, o índice direcional médio (ADX) é usado para determinar quando o preço está tendendo fortemente. Em muitos casos, é o indicador de tendência final! Afinal, a tendência pode ser sua amiga, mas com certeza ajuda saber quem são seus amigos.
ADX é usado para quantificar a força da tendência. Os cálculos do ADX são baseados em uma média móvel de expansão da faixa de preço em um determinado período de

The Progressing Indicator is a trend indicator . The indicator is simple and clear to use. The strategy of determining trend movements is based on the author's method of market analysis. The indicator will help you as an independent trading tool. It can also serve as an addition to your trading system. Progressive indicator accurately identifies entry points. Non-profit deals are few, but if they happen, the loss on them is comparable to the commission for opening a transaction. Summary of the P

Fibonacci retracements can be used to draw support lines, identify resistance levels, place stop-loss orders and set target prices. The Advanced Automatic Fibonacci retracements draws automatically all the levels. You have a lot of options to choose. For exemple you can use the tracements of another time frame (MTF) in the current chart, you can also choose between the closest level or less close to draw the retracements. You can also add 2 levels of your choice. You can add levels extensions o

O que é um Pivot?
Um pivô é um nível de preço significativo conhecido de antemão, que os traders consideram importante e podem tomar decisões de negociação em torno desse nível. Como um indicador técnico, um preço pivô é semelhante a um nível de resistência ou suporte. Se o nível do pivô for excedido, o preço deverá continuar nessa direção. Ou o preço pode reverter nesse nível ou perto dele.
O que um pivô lhe diz?
Existem pivôs e pontos de pivô. Esses termos podem significar coisas difere
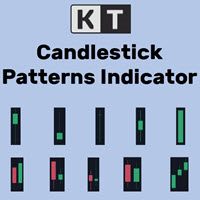
KT Candlestick Patterns finds and marks the 24 most dependable Japanese candlestick patterns in real-time. Japanese traders have been using the candlestick patterns to predict the price direction since the 18th century.
It's true that not every candlestick pattern can be equally trusted to predict the price direction reliably. However, when combined with other technical analysis methods like Support and Resistance, they provide an exact and unfolding market situation. KT Candlestick Patterns

The StatZigZag indicator looks like a regular ZigZag , but is built on the basis of completely different algorithms. The StatZigZag indicator is a broken line built from segments of regression lines of different lengths, the beginning of each of which comes from the end of the previous segment. Each regression segment is built until the variance or spread of price around it begins to exceed a certain critical value, after which the construction of this segment ends and the constr

Трендовый стрелочный индикатор. Для анализа использует несколько скользящих средних на разных таймфреймах и соотносит их с важными уровнями цены. Не перерисовывает стрелку, т.к. использует для расчета фиксированное количество исторических данных.
Пример работы индикатора приведен на скриншотах.
Лучше работает на трендовых участках рынка и показывает подтвержденное изменение направления цены. Не требует оптимизации.

O indicador IndicateMe foi criado especialmente para remover o máximo de ruído possível dos sinais que ele fornece.
O indicador foi combinado com vários outros indicadores bem conhecidos. Indicadores que têm sido utilizados: "Média móvel, indicador estocástico, índice de força relativa, móvel".
Todos os indicadores usados podem ser ajustados por você. As configurações padrão são definidas com os valores que eu gosto de usar.
Defina alertas facilmente para se manter sempre informado so
Negociar na direção de uma tendência forte reduz o risco e aumenta o potencial de lucro. Em geral, o índice direcional médio (ADX) é usado para determinar quando o preço está tendendo fortemente. Em muitos casos, é o indicador de tendência final! Afinal, a tendência pode ser sua amiga, mas com certeza ajuda saber quem são seus amigos.
ADX é usado para quantificar a força da tendência. Os cálculos do ADX são baseados em uma média móvel de expansão da faixa de preço em um determinado período de
O LordCandleSignal é um indicador para META TRADER 4, utilizando por padrão técnicas ENVELOPES, STOCHASTIC, RSI com estratégias Lord em seu código fonte. O LordCandleSignal emite um novo sinal de compra/venda através de sua estratégia antes da ação, ou seja, o sinal vem antes de acontecer. Dificil de errar, cada sinal enviado, é possível fechar com lucro até mesmo antes do próximo sinal, ou utilizando estratégia Lord, fechamento com lucros a cada 20-50 pips de forma compreensiva e segura. O Lord
O Mercado MetaTrader contém robôs de negociação e indicadores técnicos para traders, disponíveis diretamente no terminal.
O sistema de pagamento MQL5.community está disponível para todos os usuários registrados do site do MQL5.com para transações em todos os Serviços MetaTrader. Você pode depositar e sacar dinheiro usando WebMoney, PayPal ou um cartão de banco.
Você está perdendo oportunidades de negociação:
- Aplicativos de negociação gratuitos
- 8 000+ sinais para cópia
- Notícias econômicas para análise dos mercados financeiros
Registro
Login
Se você não tem uma conta, por favor registre-se
Para login e uso do site MQL5.com, você deve ativar o uso de cookies.
Ative esta opção no seu navegador, caso contrário você não poderá fazer login.